Gene: HOXA9
chr7: 27202053-27205149Expression Profile
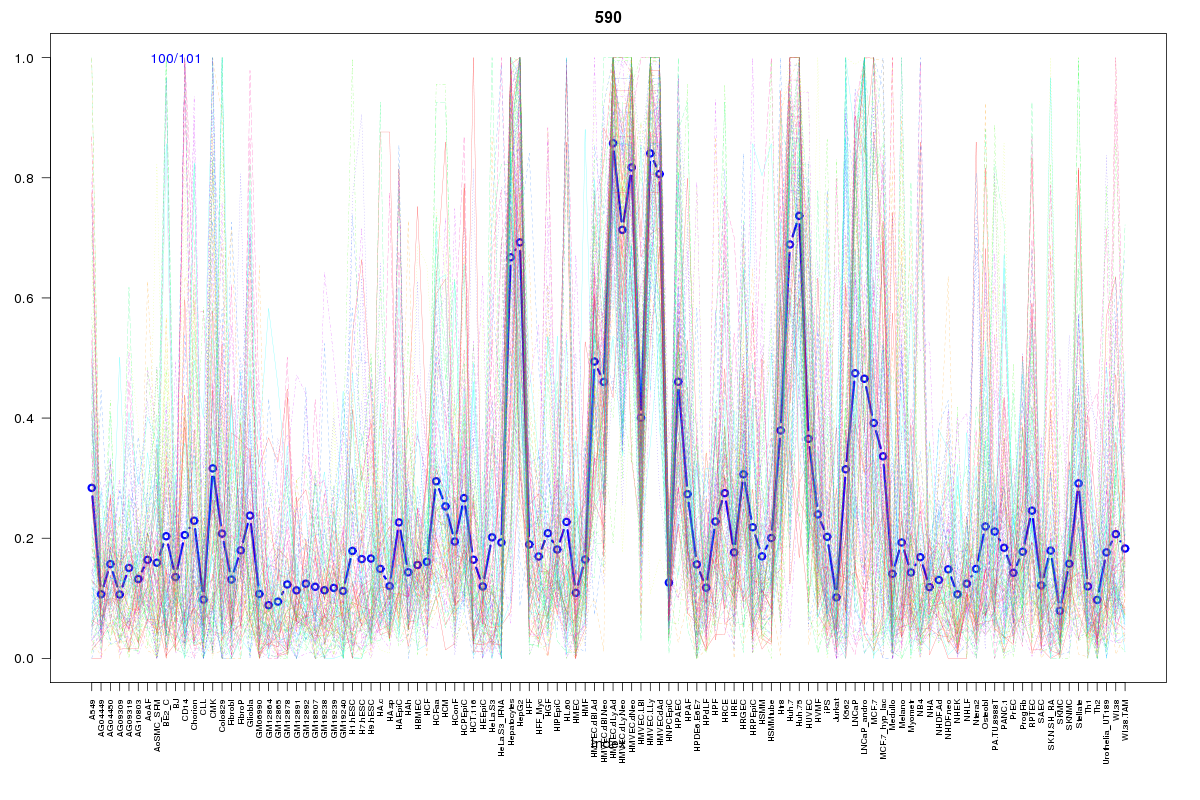
(log scale)
Graphical Connections
Distribution of linked clusters:
You may find it interesting if many of the connected DHS sites belong to the same cluster.| Cluster Profile | Cluster ID | Number of DHS sites in this cluster |
|---|---|---|
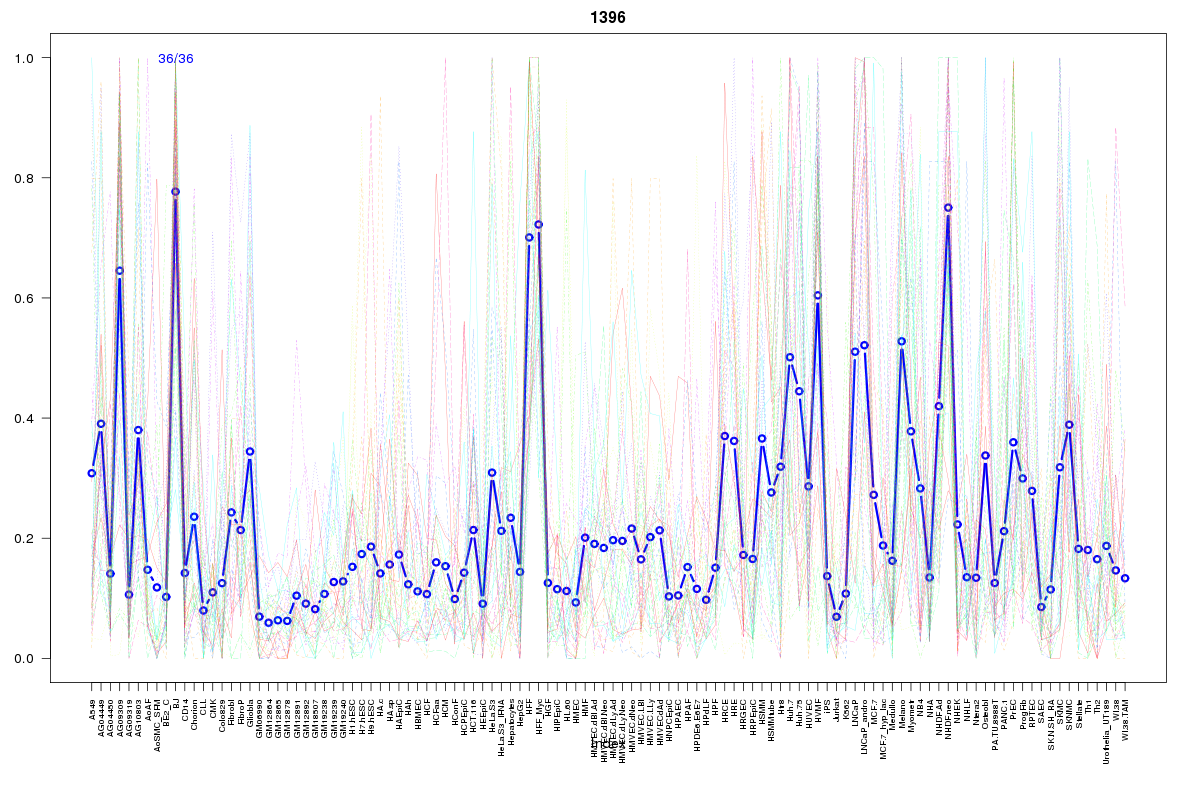 | 1396 | 11 |
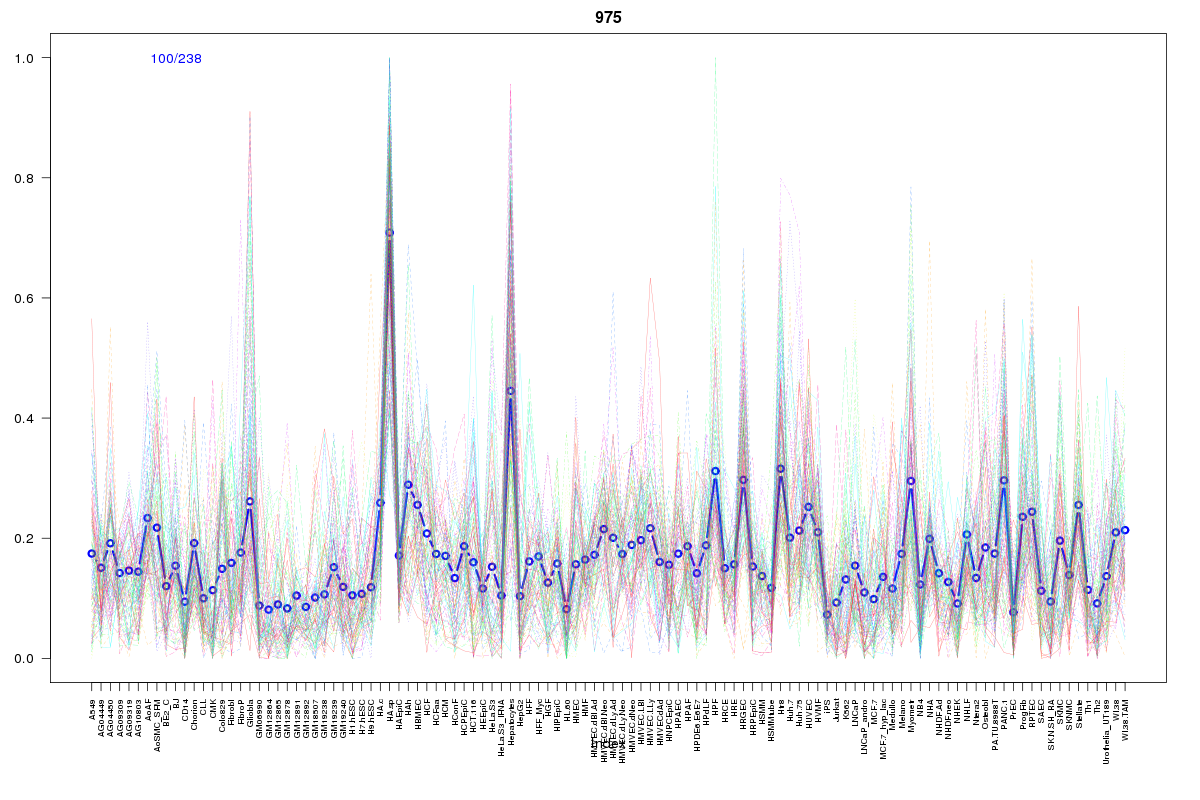 | 975 | 8 |
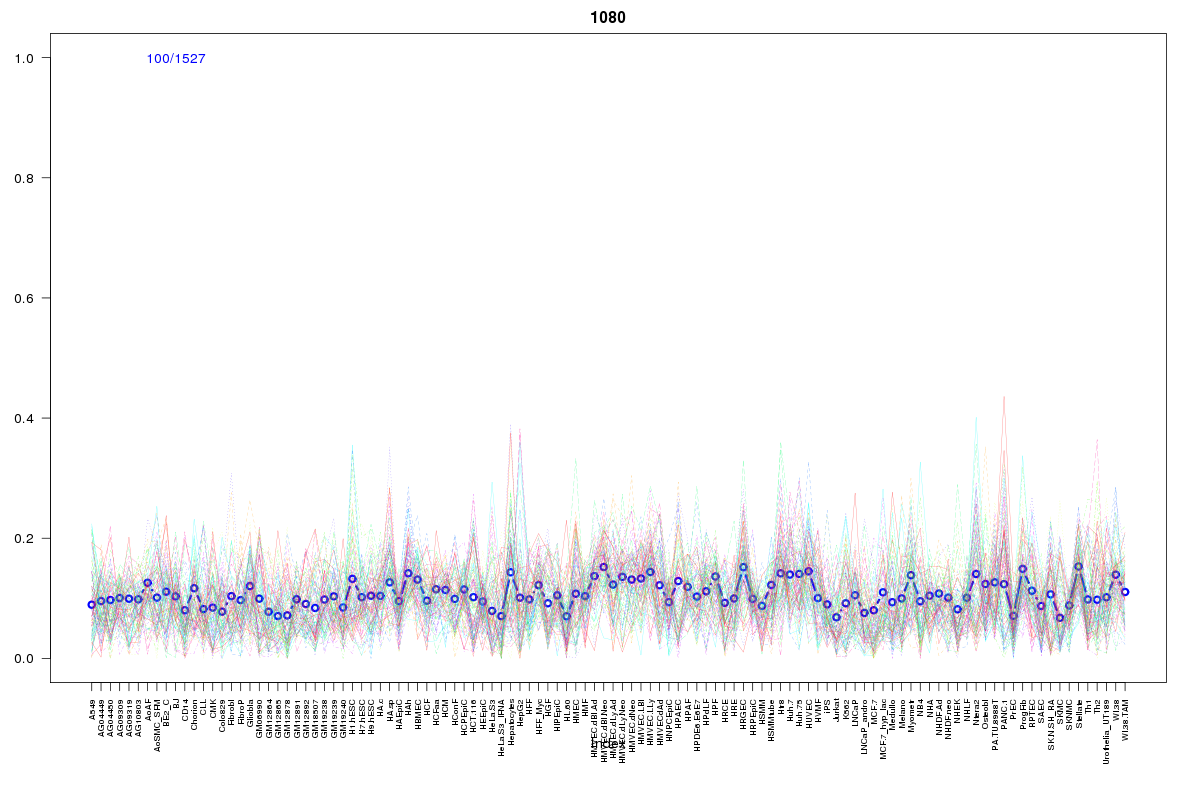 | 1080 | 7 |
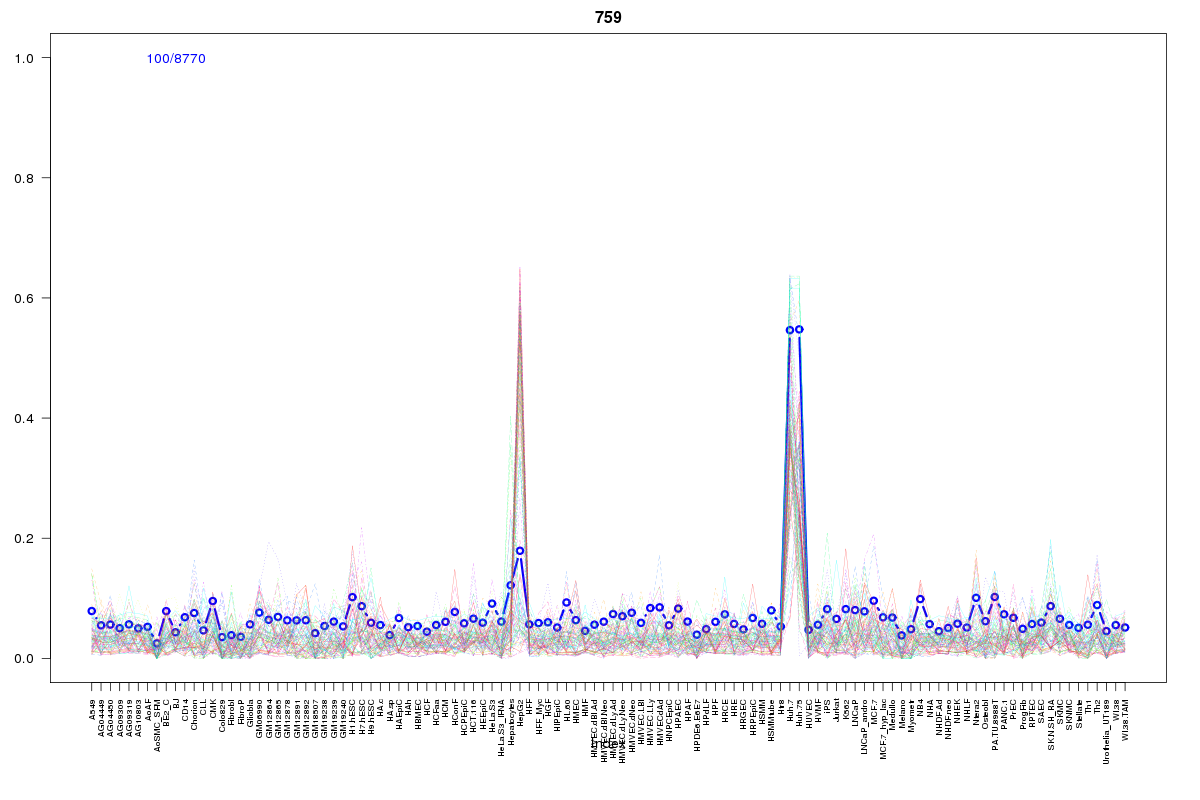 | 759 | 5 |
 | 862 | 5 |
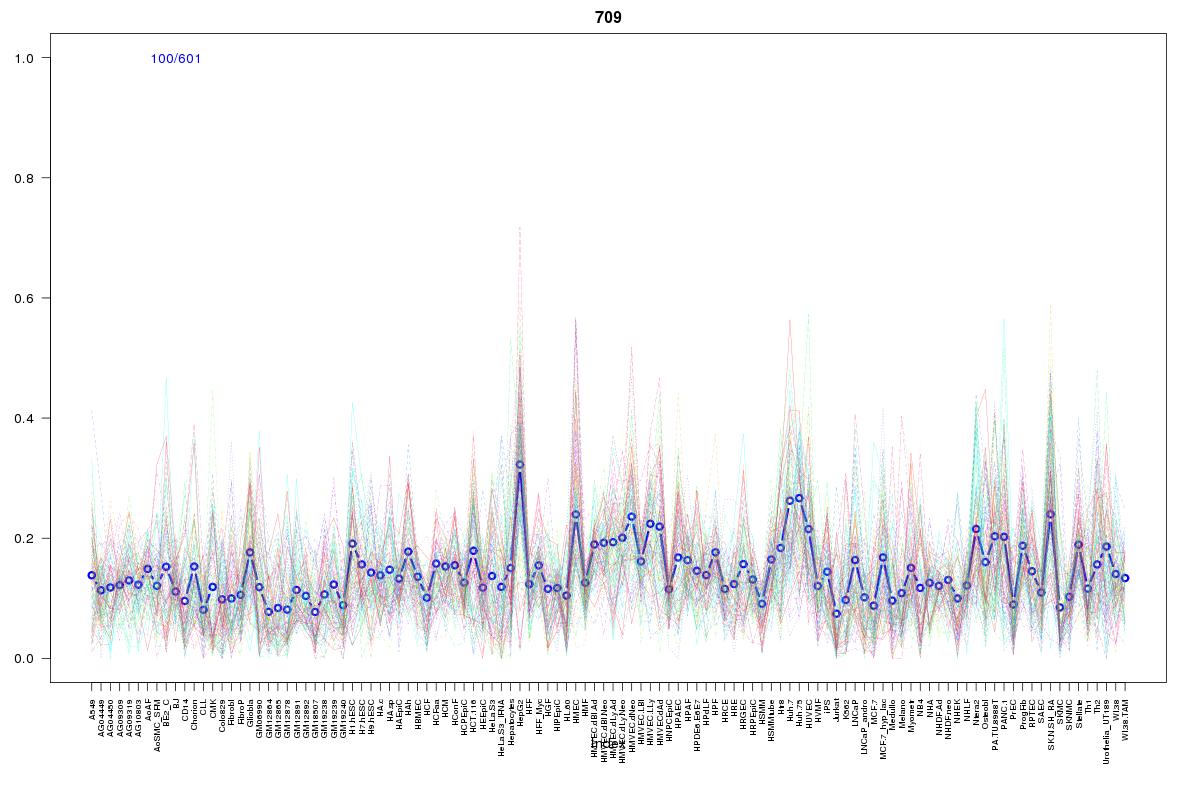 | 709 | 4 |
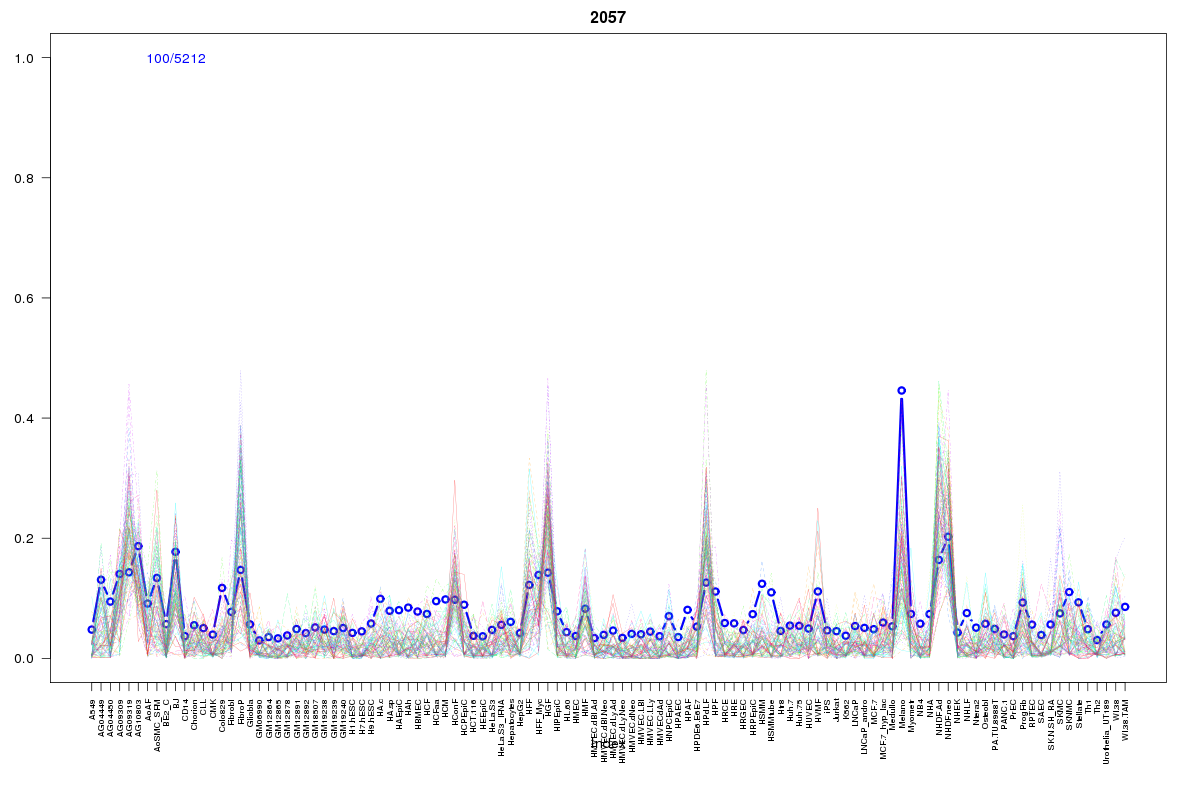 | 2057 | 4 |
 | 2279 | 4 |
 | 934 | 3 |
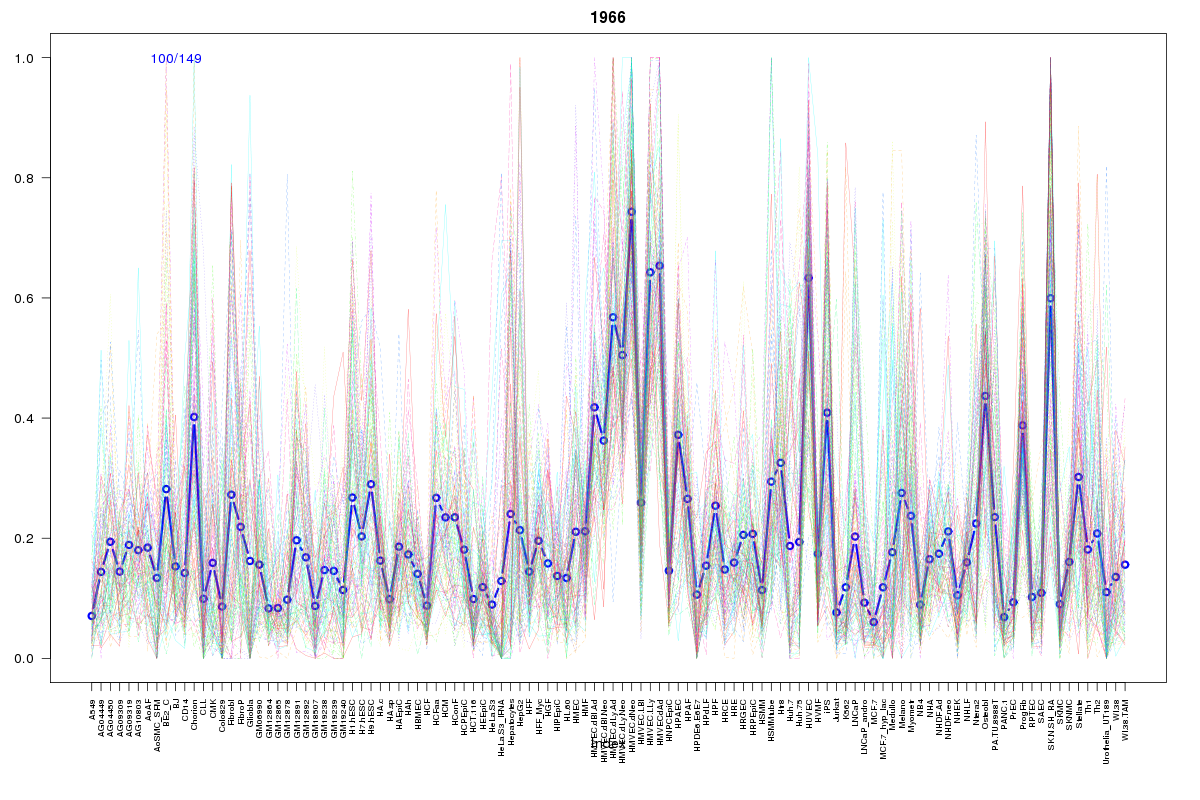 | 1966 | 3 |
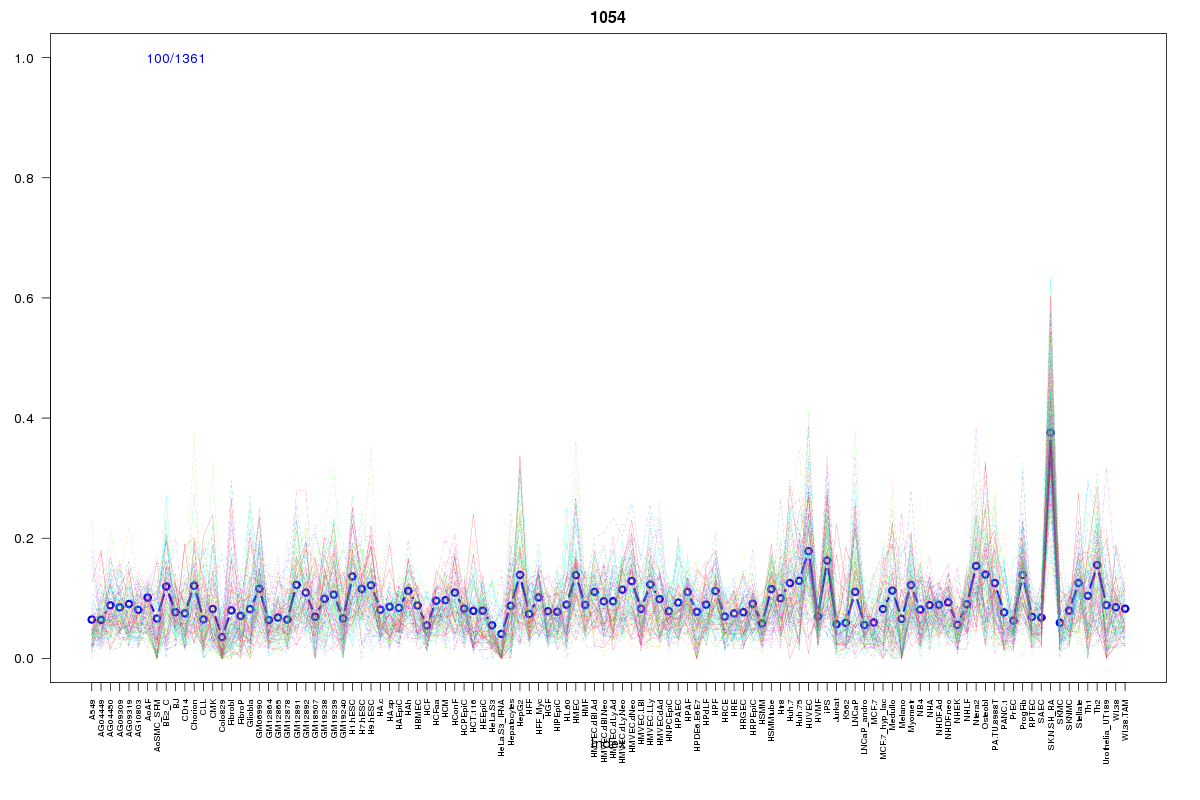 | 1054 | 3 |
 | 1738 | 3 |
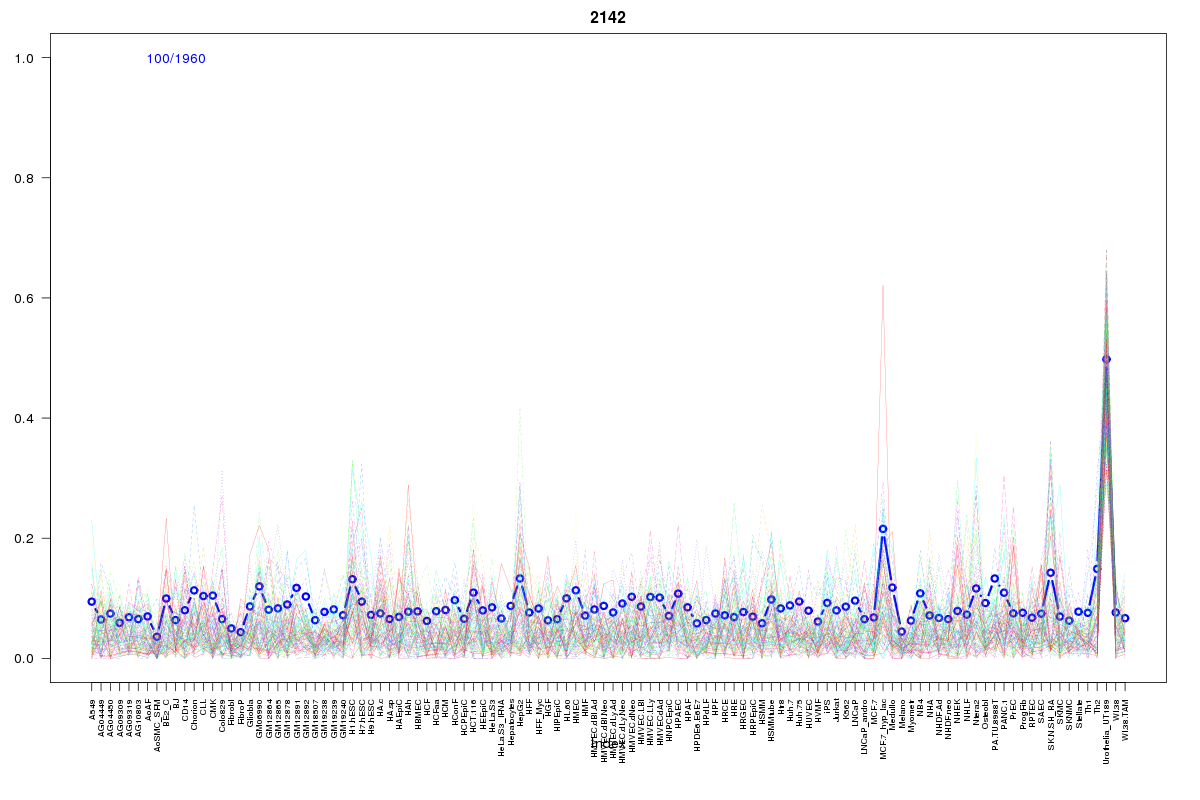 | 2142 | 3 |
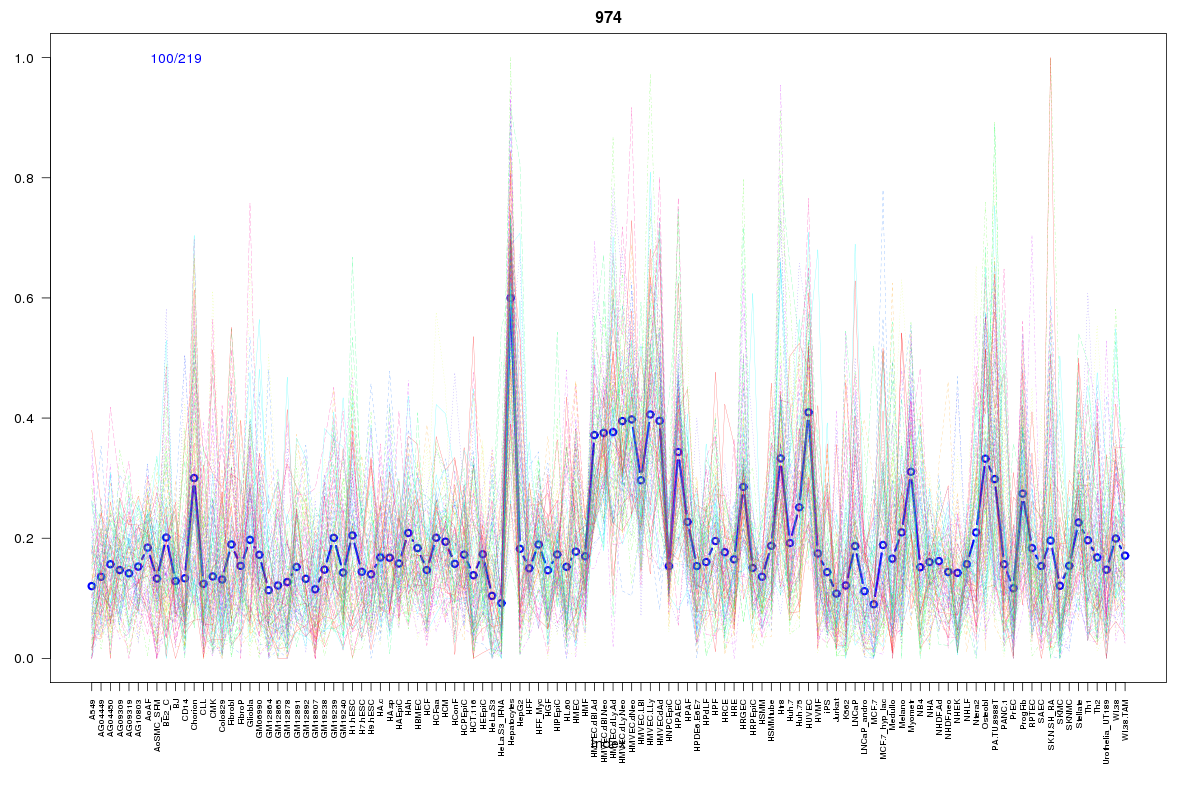 | 974 | 3 |
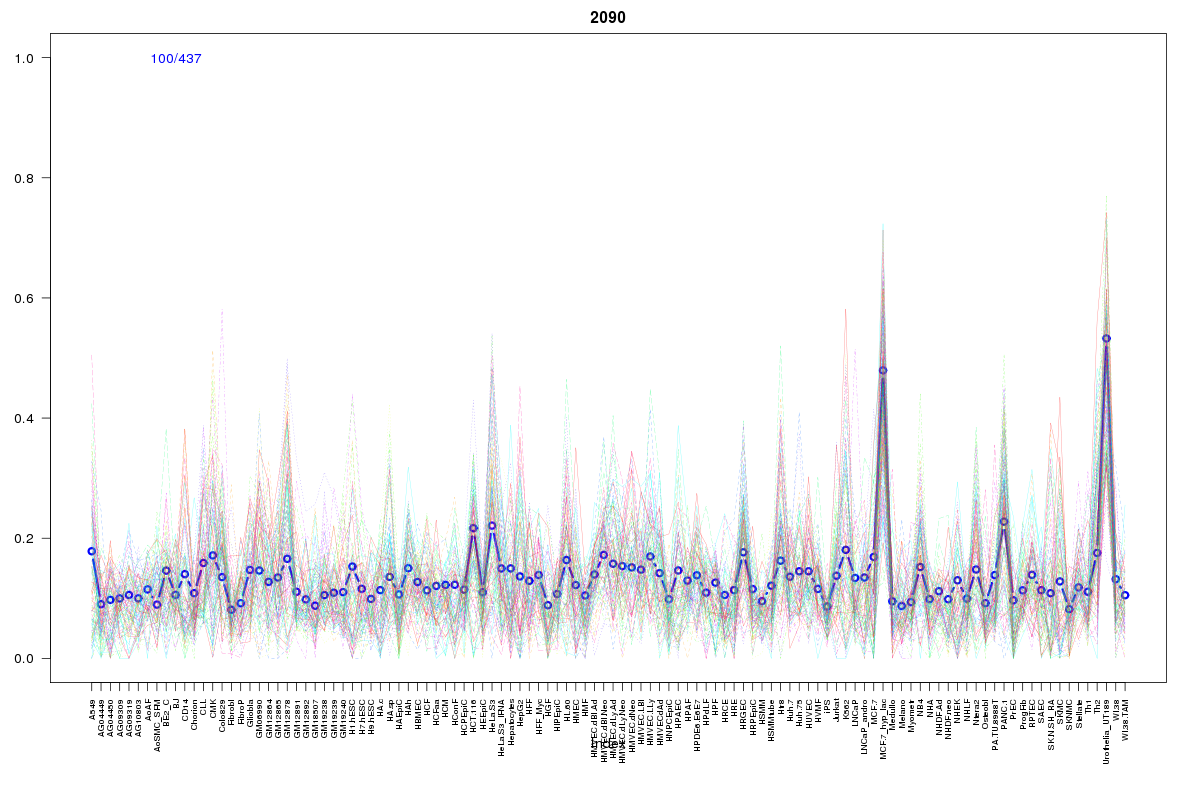 | 2090 | 2 |
 | 296 | 2 |
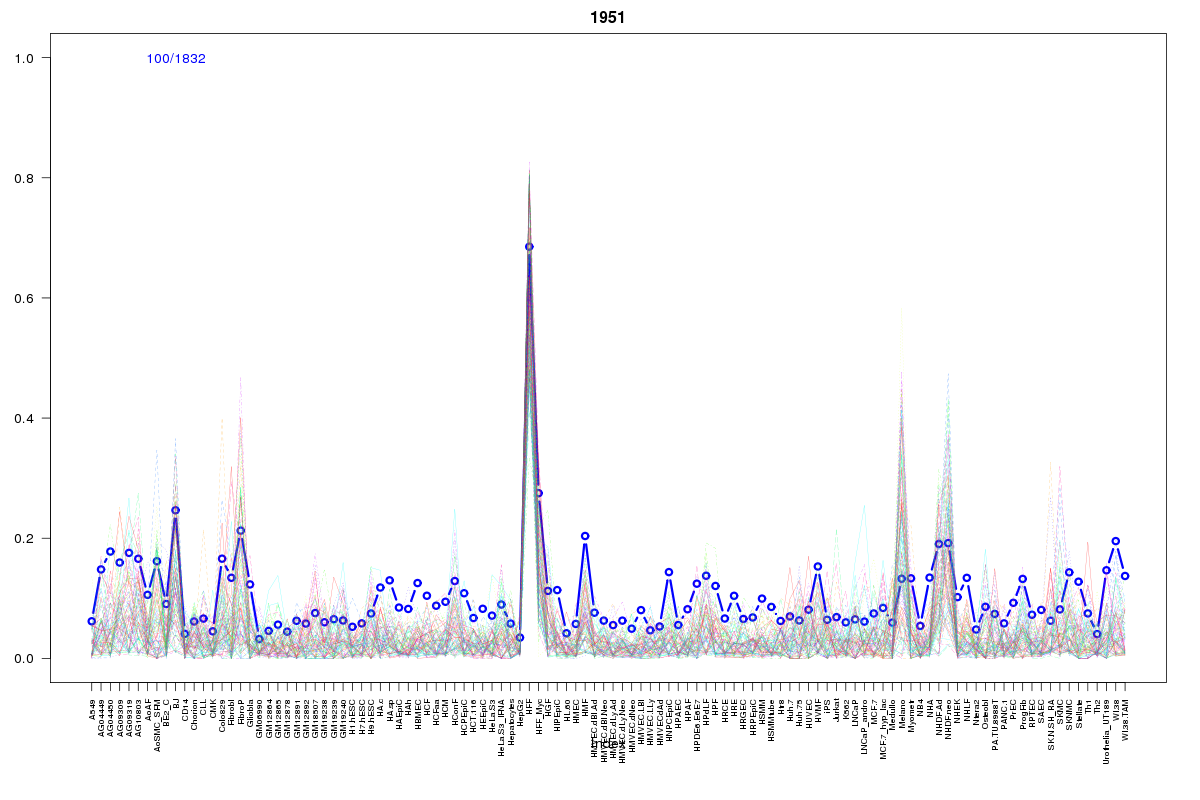 | 1951 | 2 |
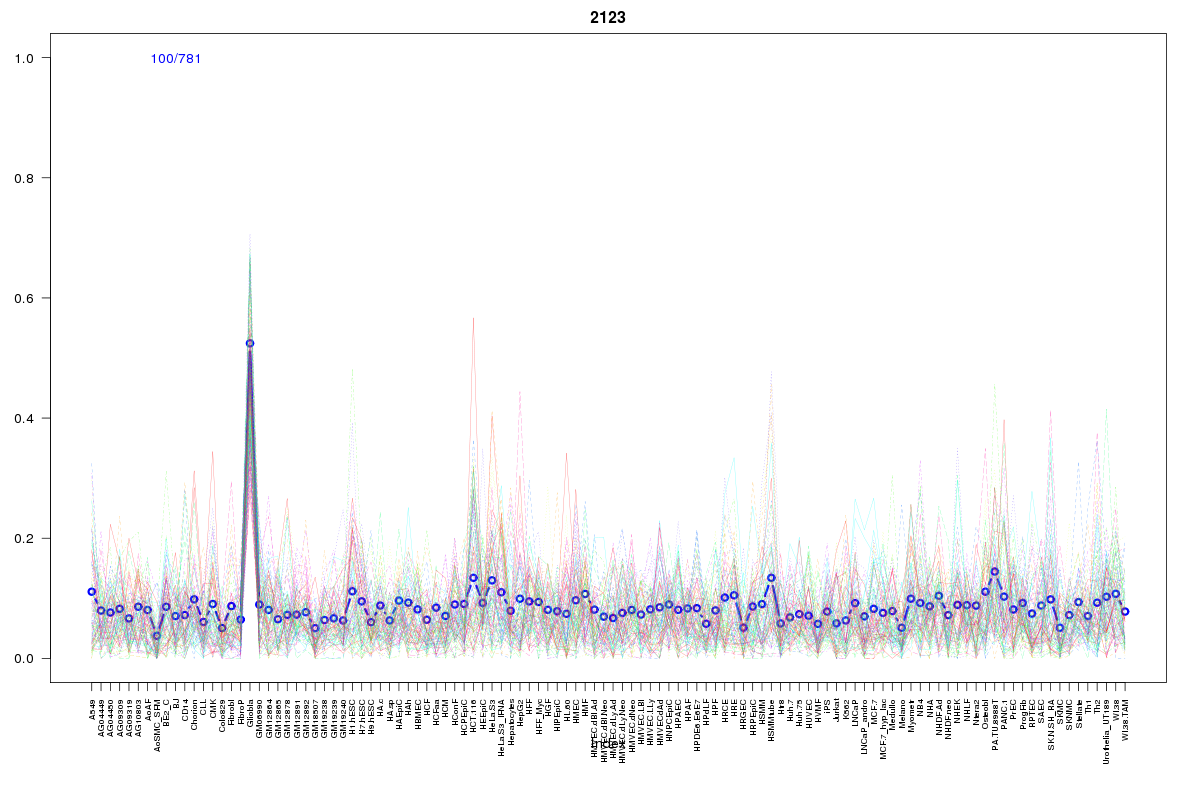 | 2123 | 2 |
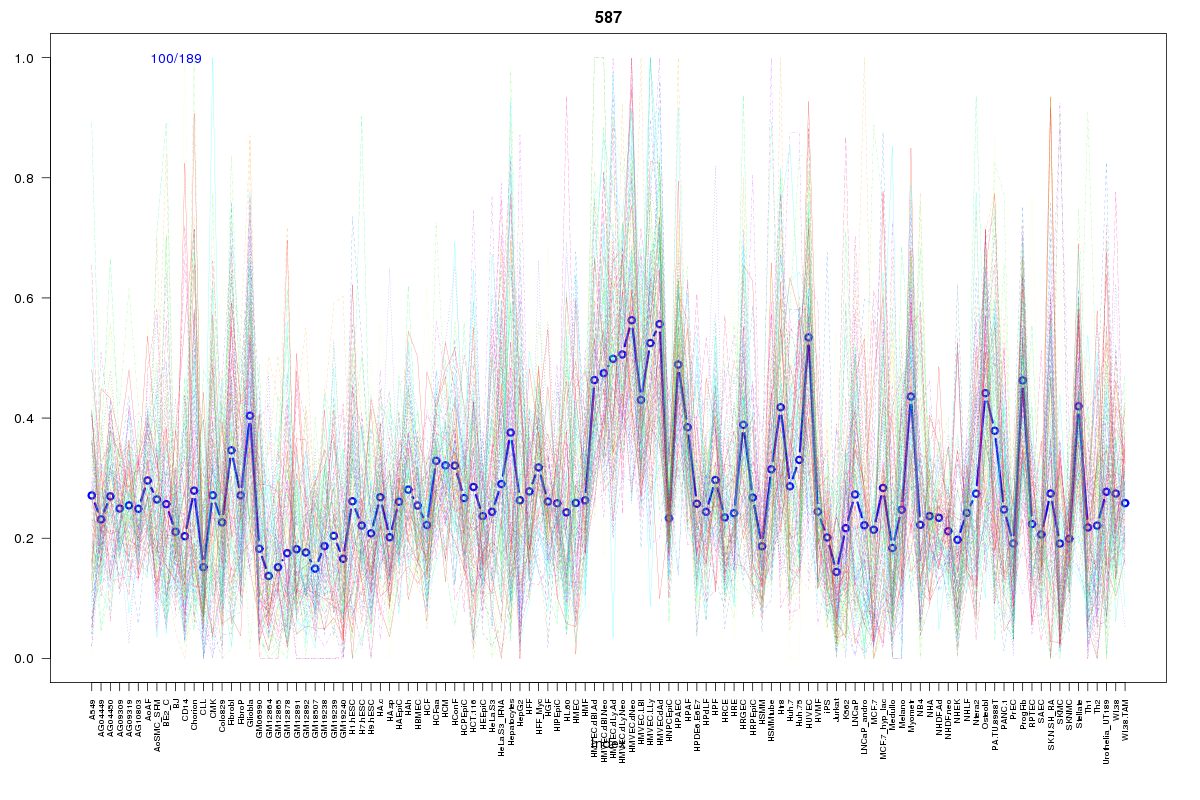 | 587 | 2 |
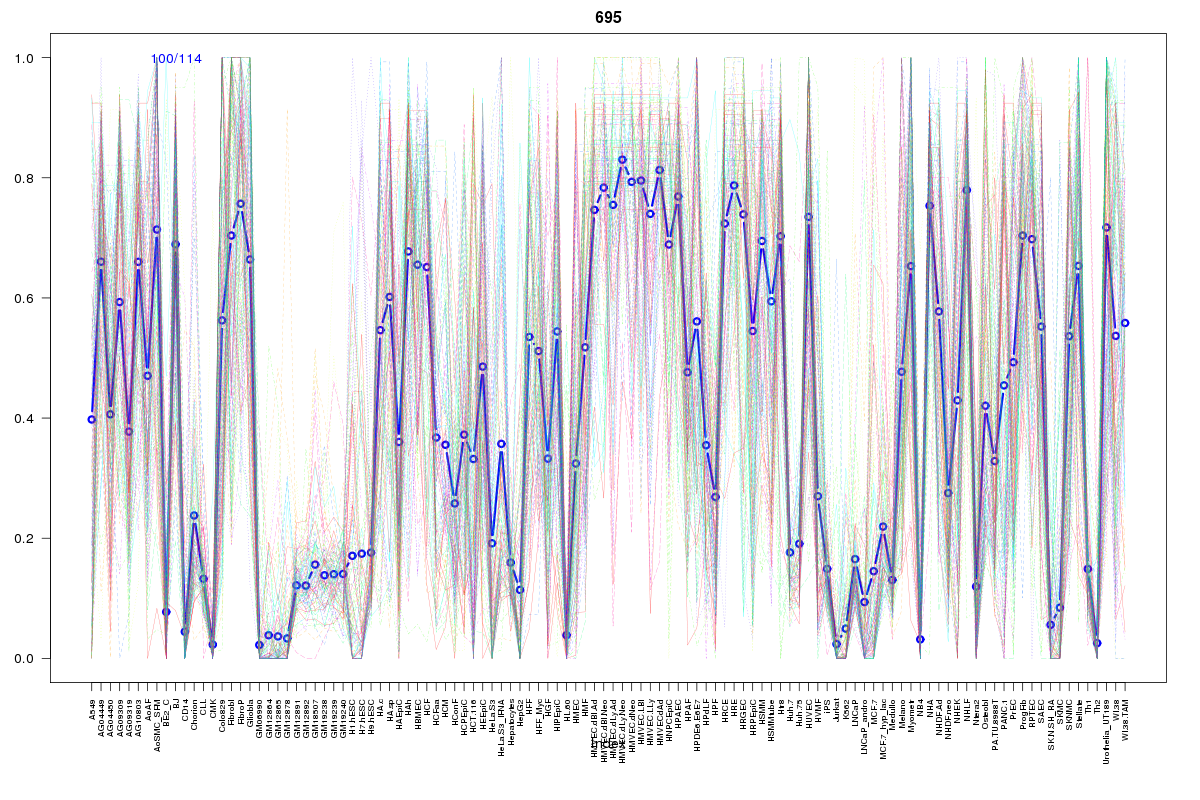 | 695 | 2 |
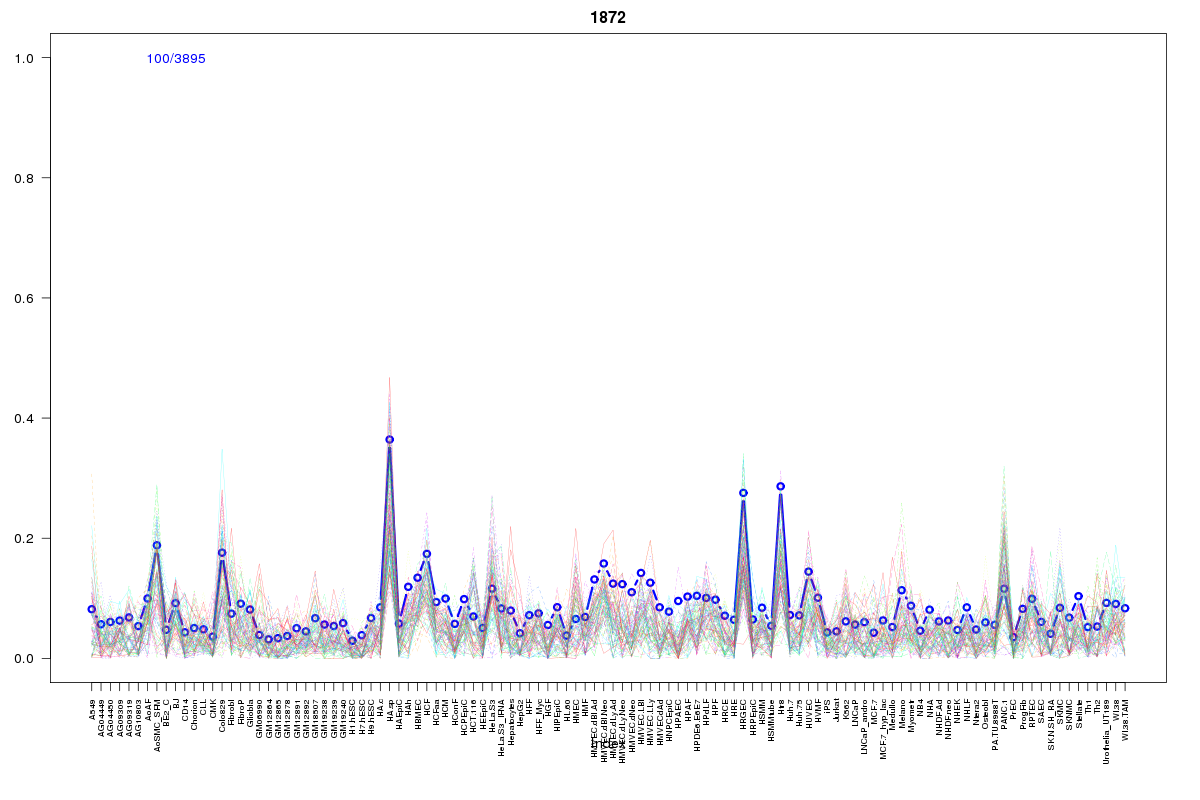 | 1872 | 2 |
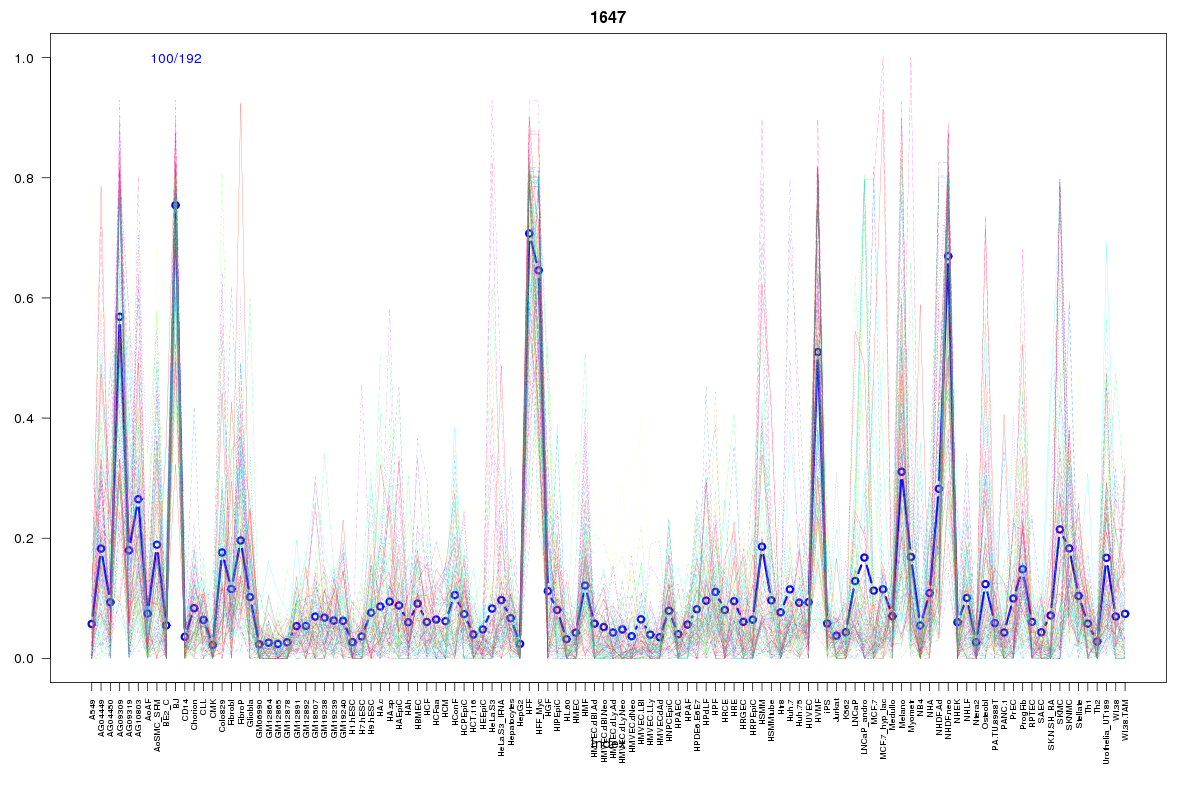 | 1647 | 2 |
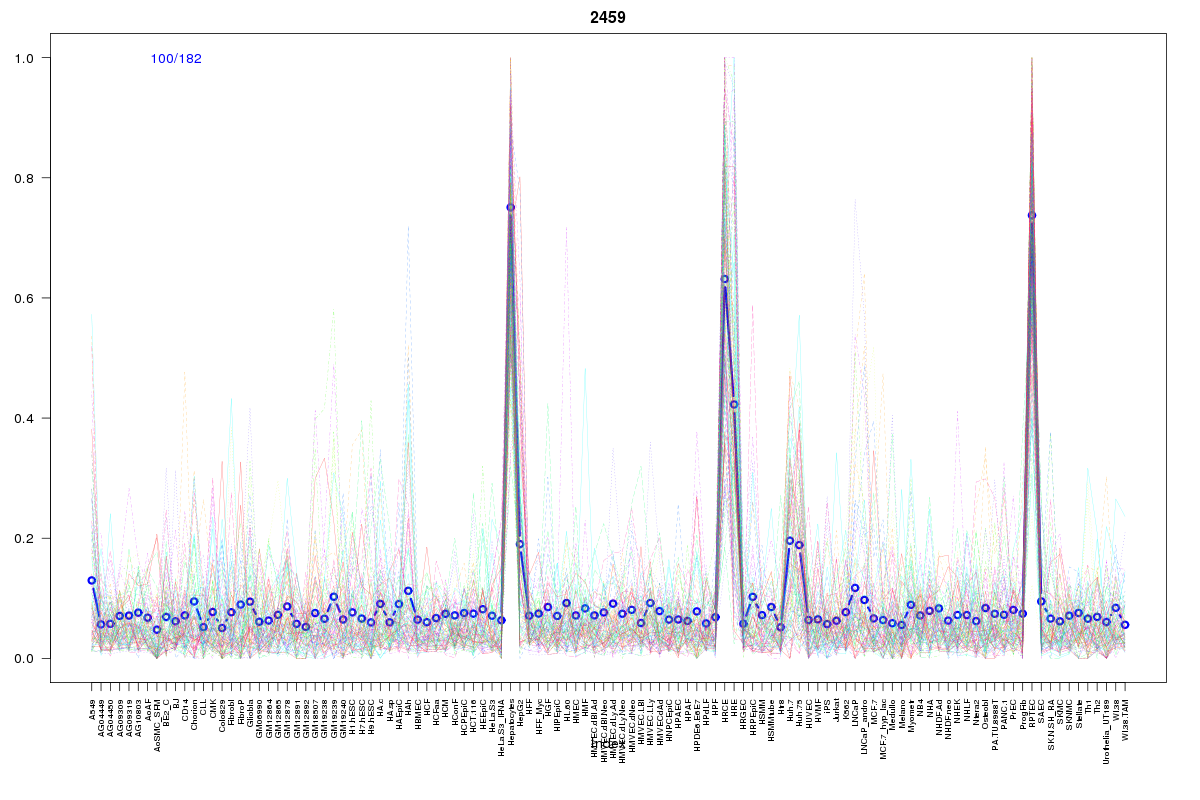 | 2459 | 2 |
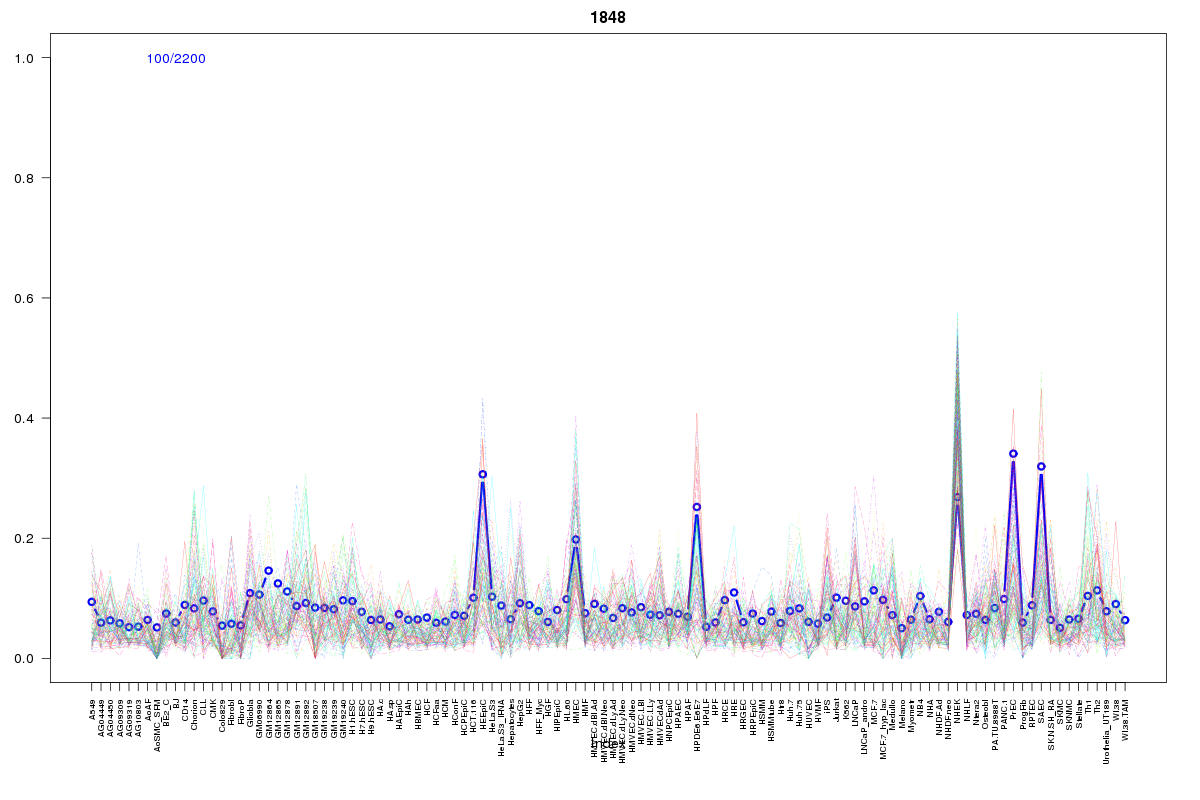 | 1848 | 2 |
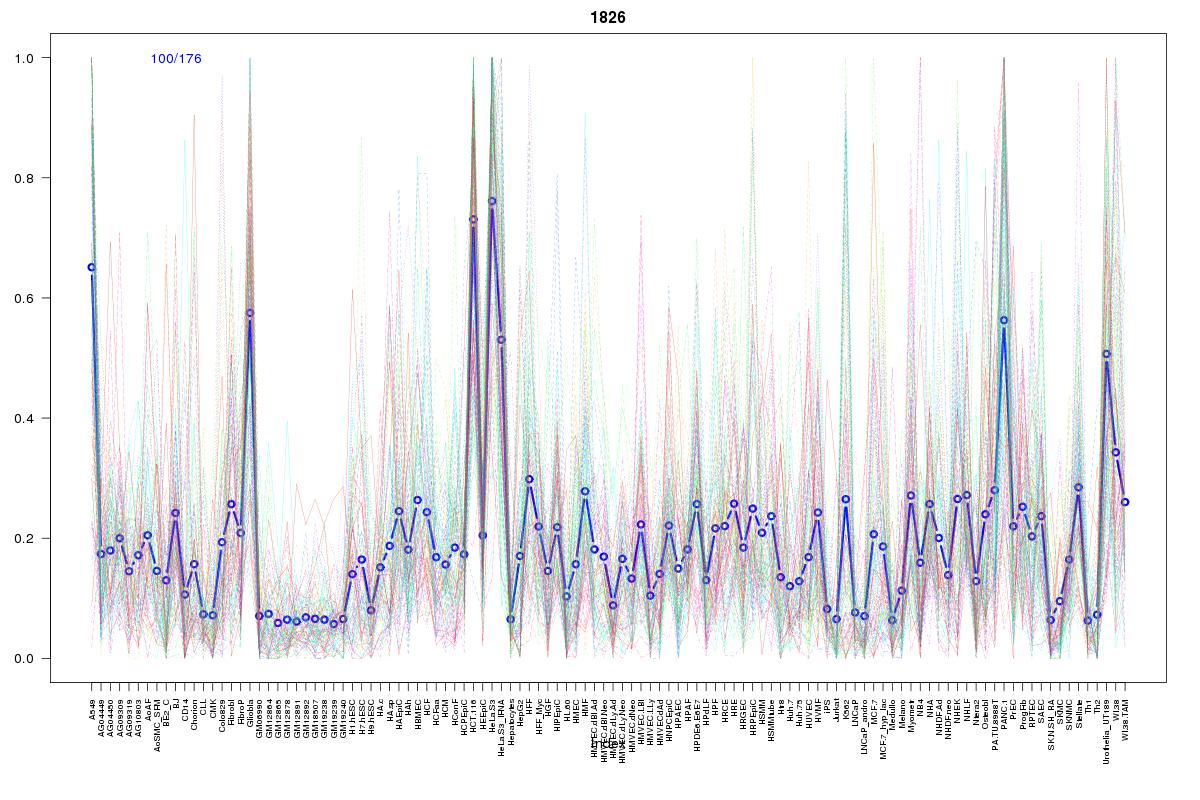 | 1826 | 2 |
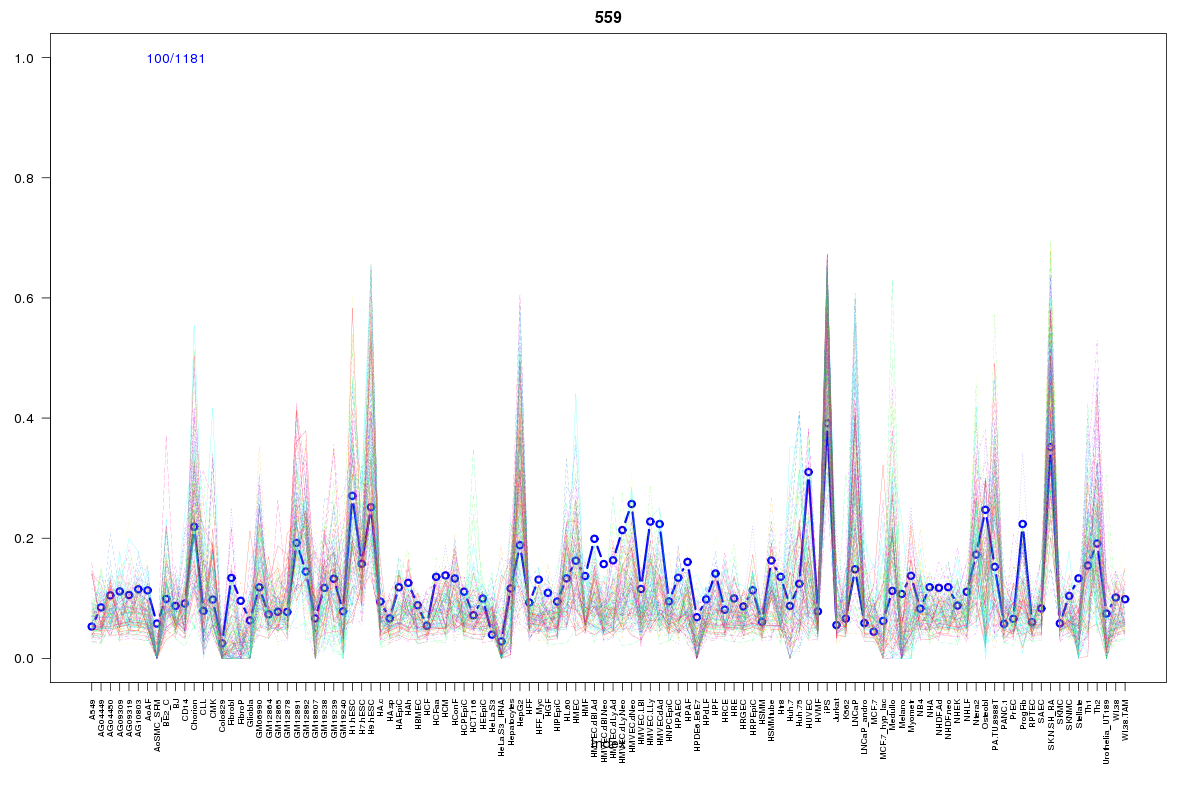 | 559 | 2 |
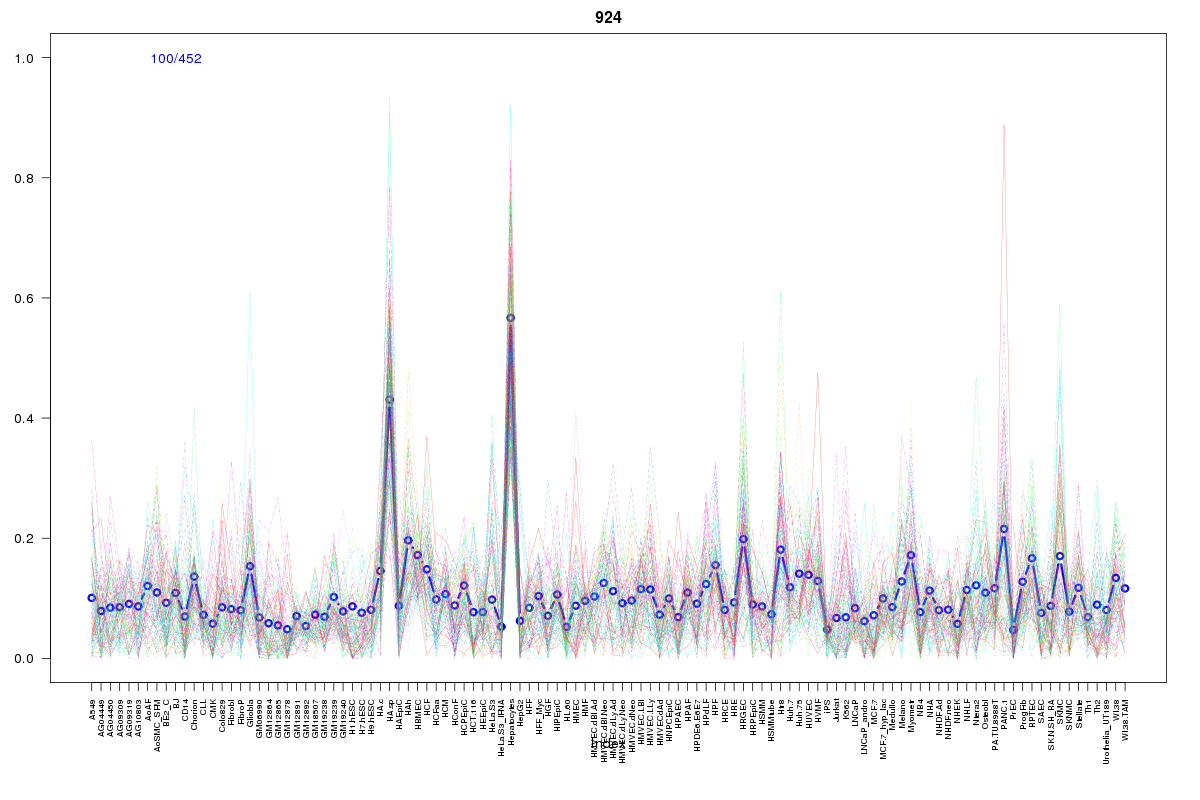 | 924 | 2 |
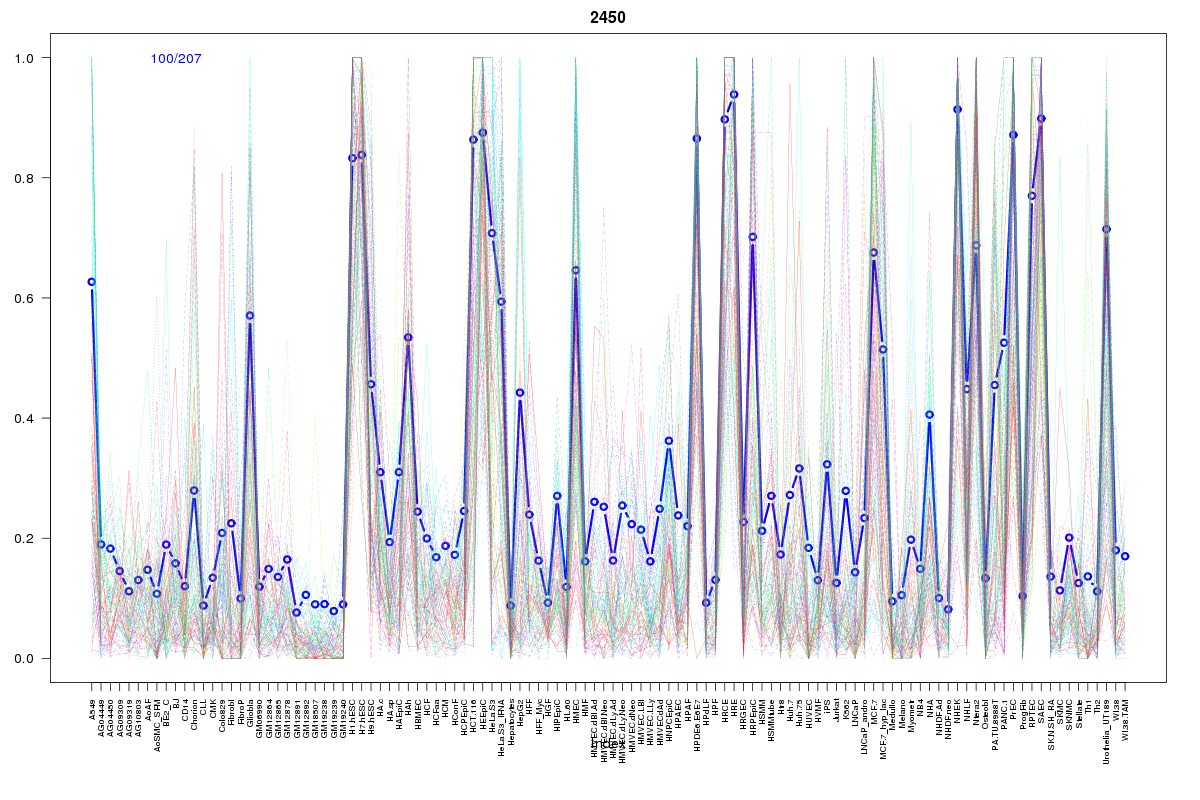 | 2450 | 1 |
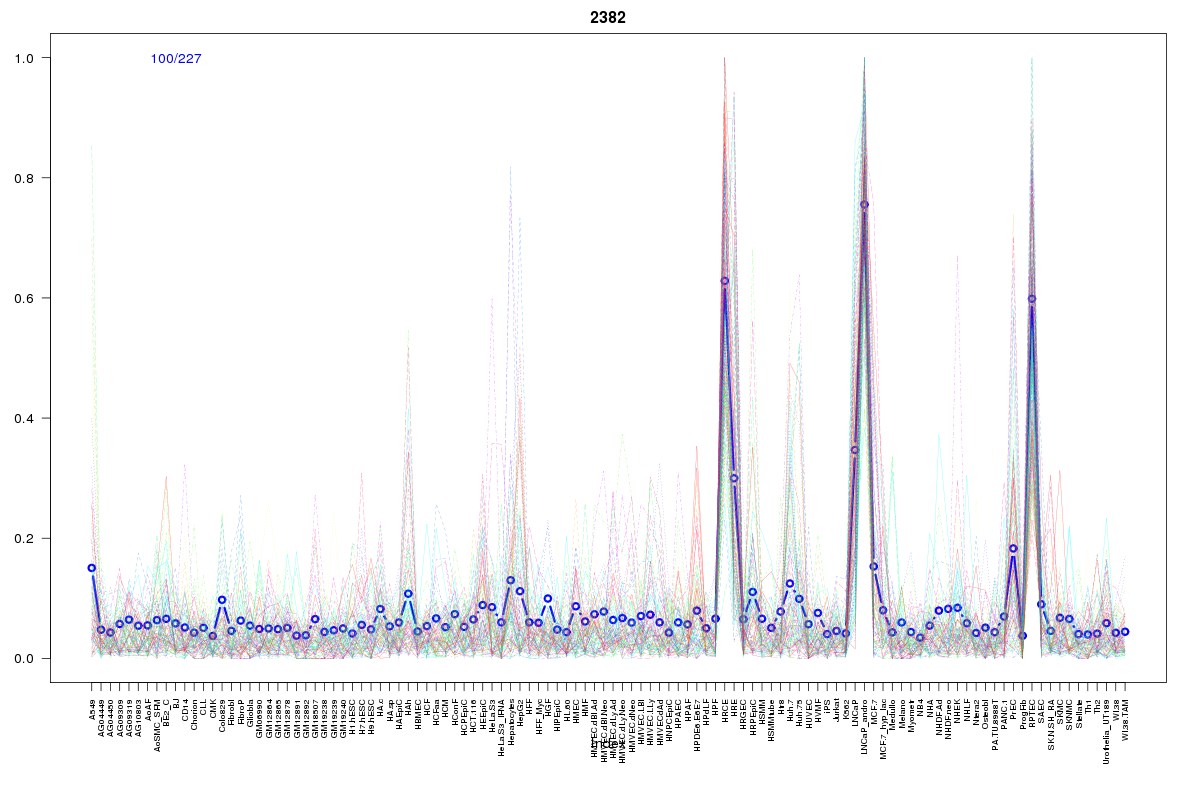 | 2382 | 1 |
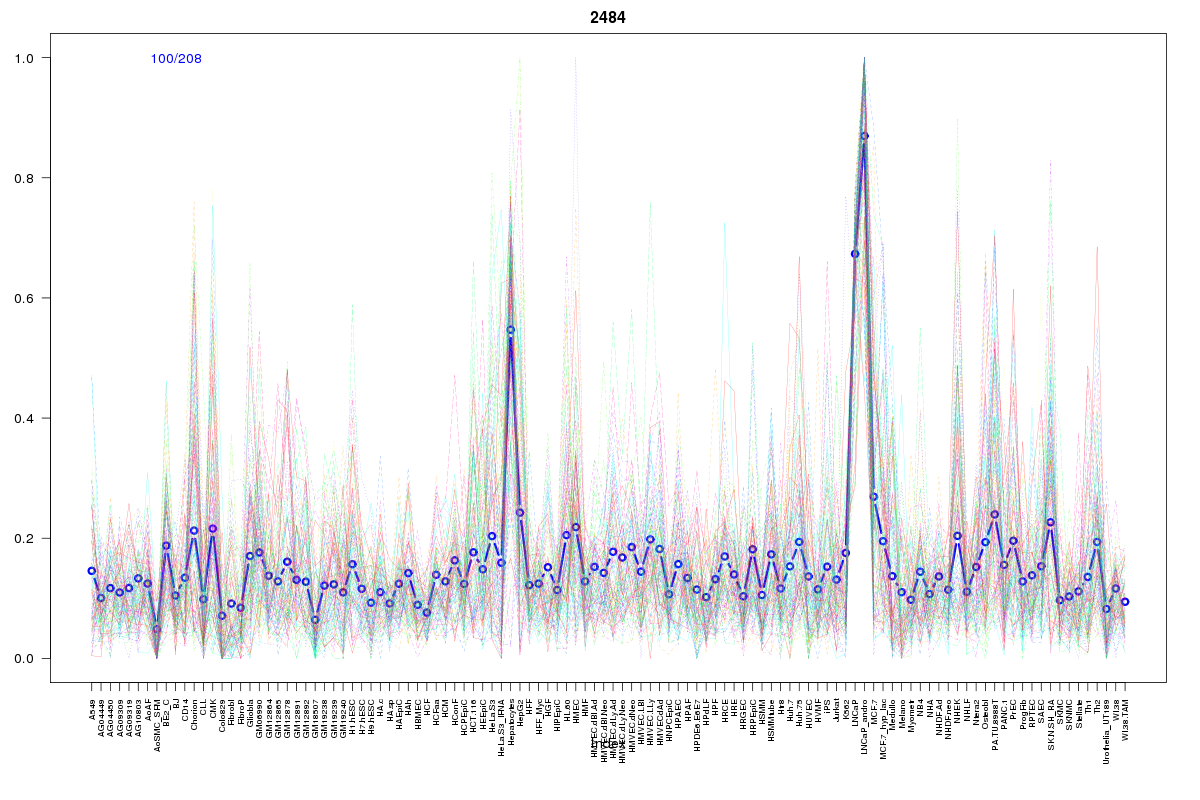 | 2484 | 1 |
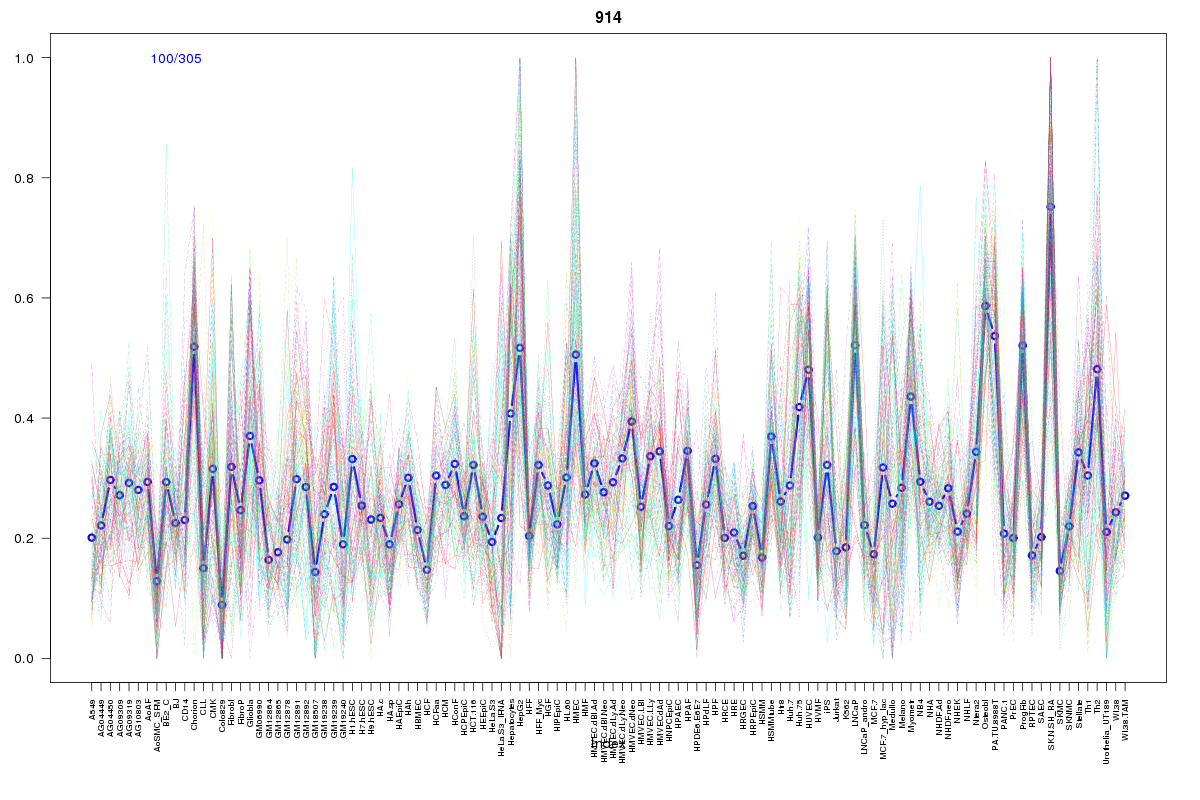 | 914 | 1 |
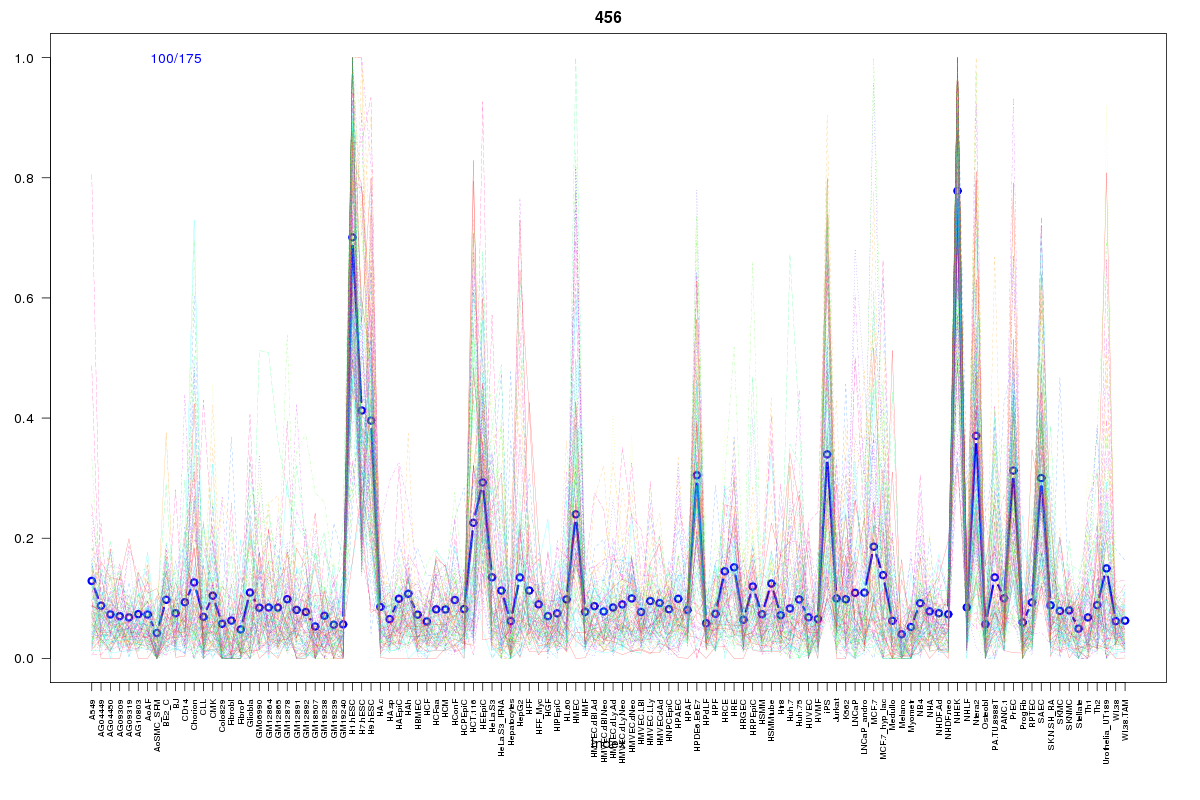 | 456 | 1 |
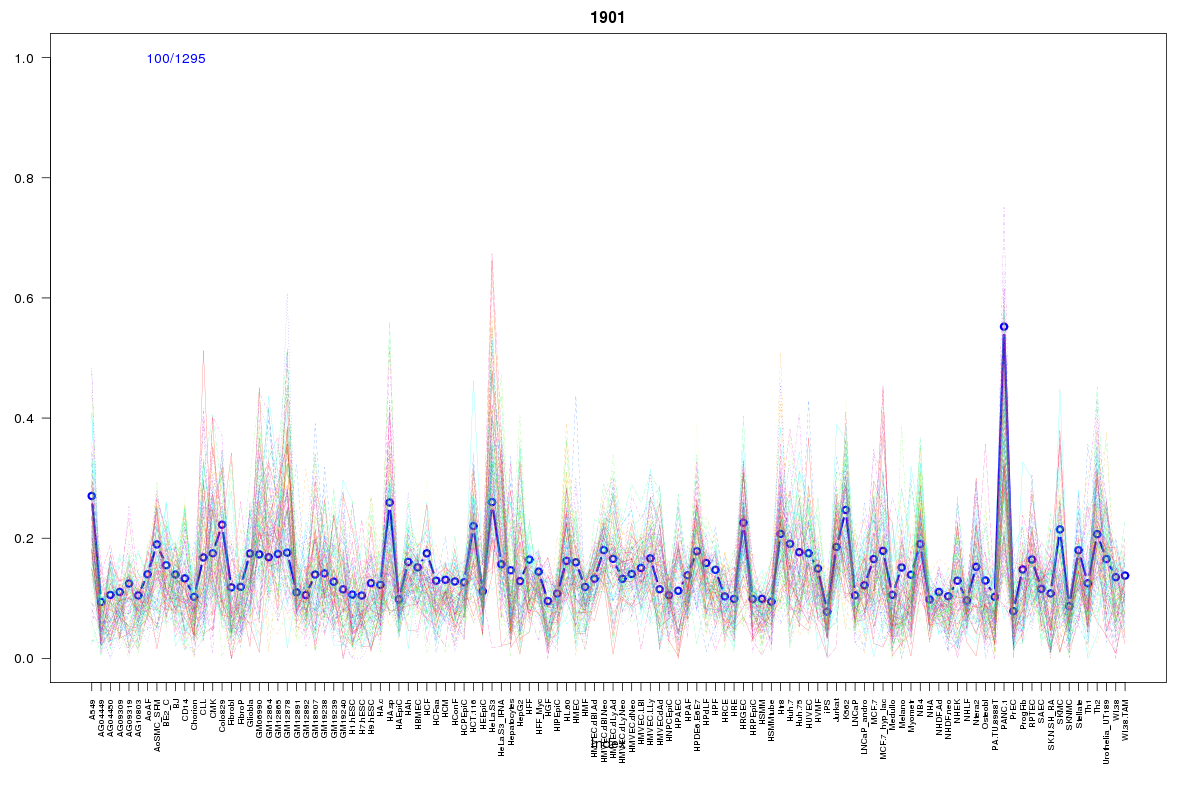 | 1901 | 1 |
 | 608 | 1 |
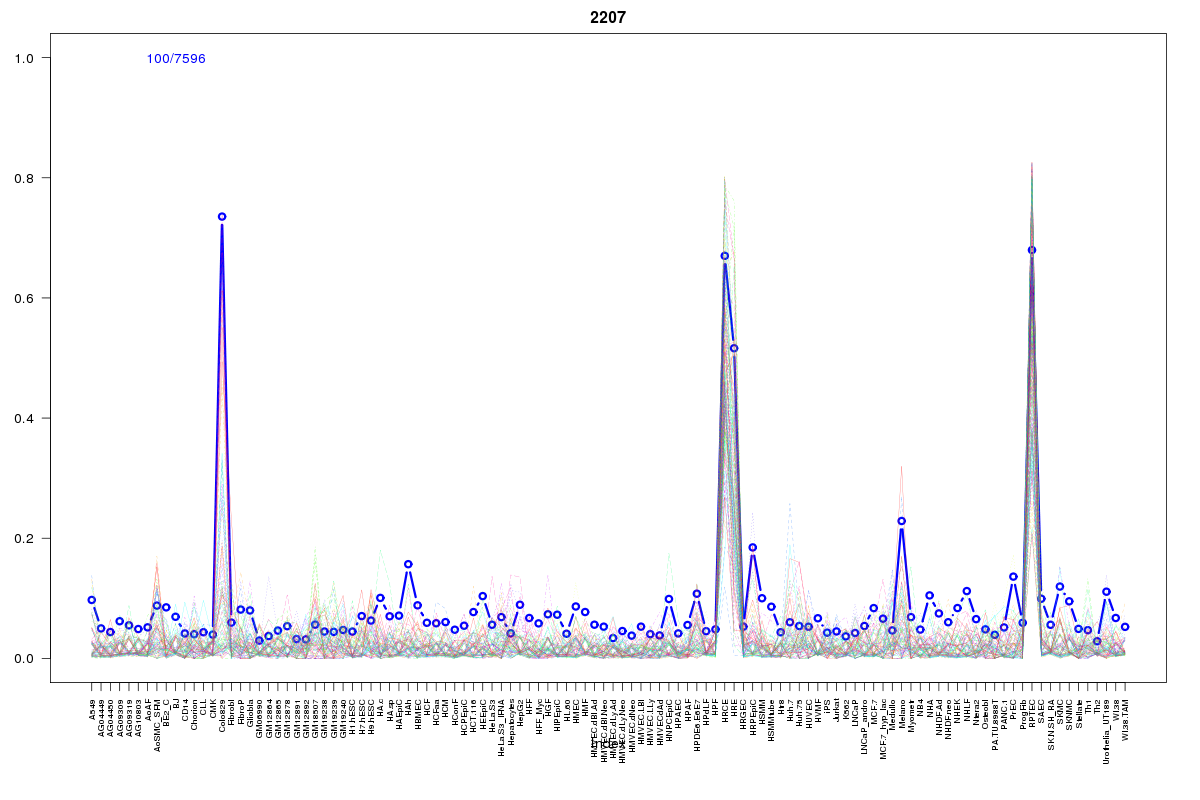 | 2207 | 1 |
 | 2181 | 1 |
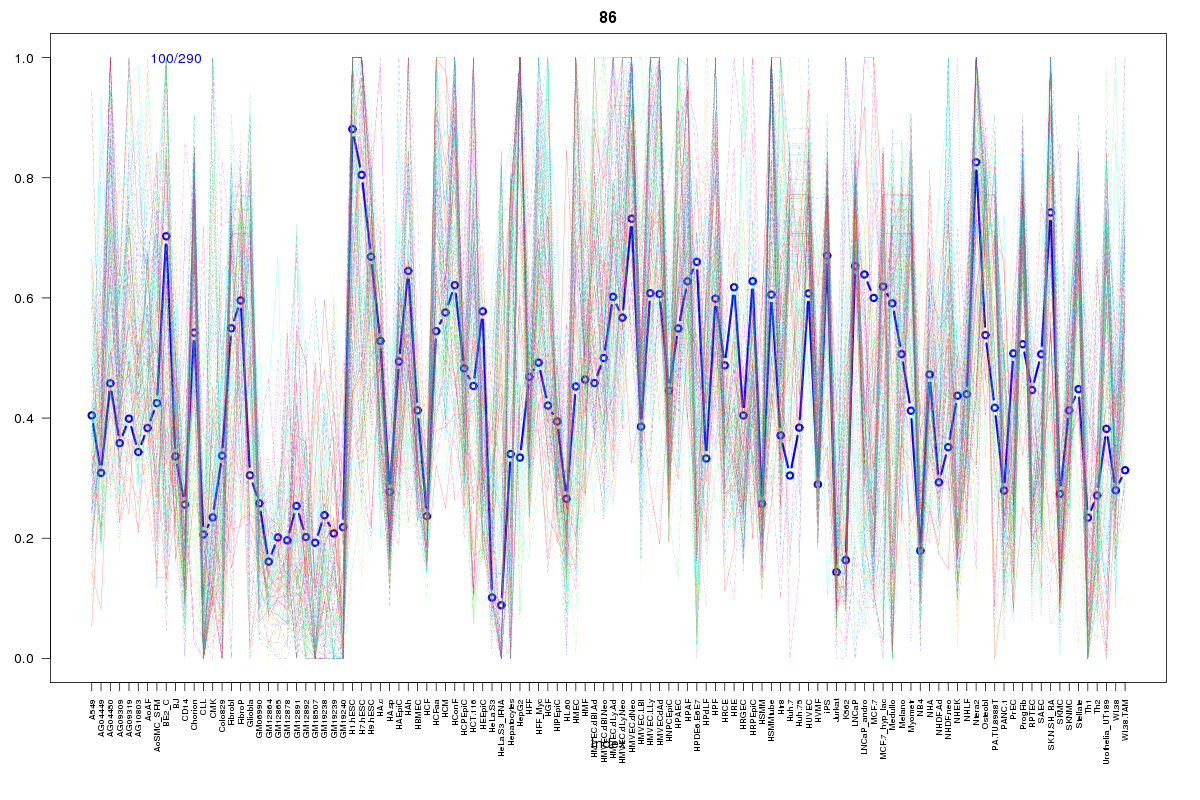 | 86 | 1 |
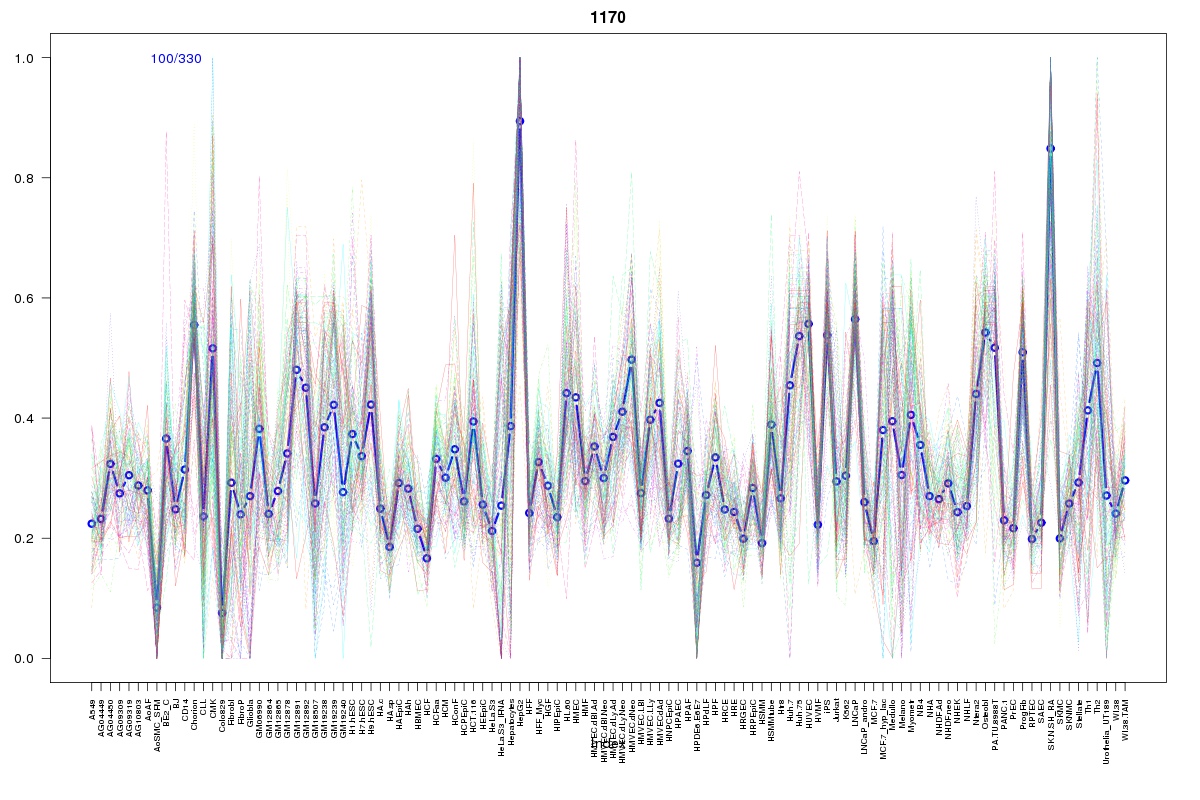 | 1170 | 1 |
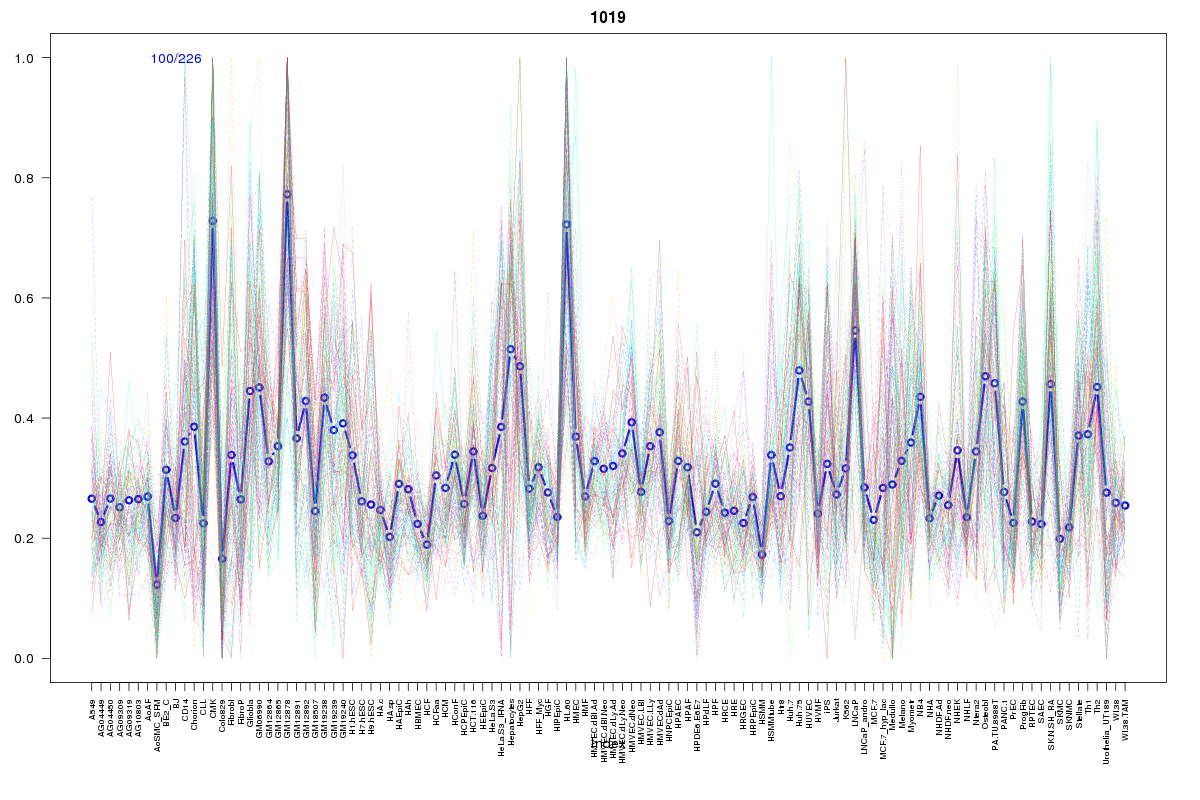 | 1019 | 1 |
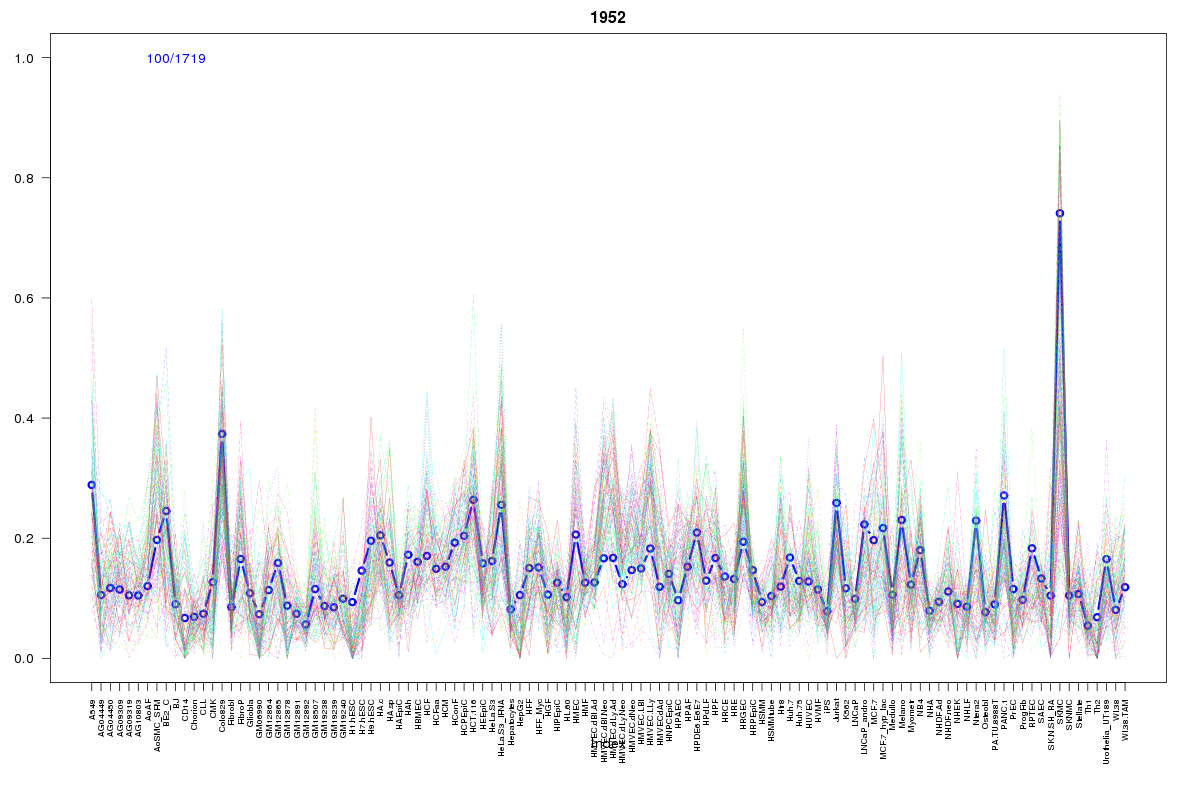 | 1952 | 1 |
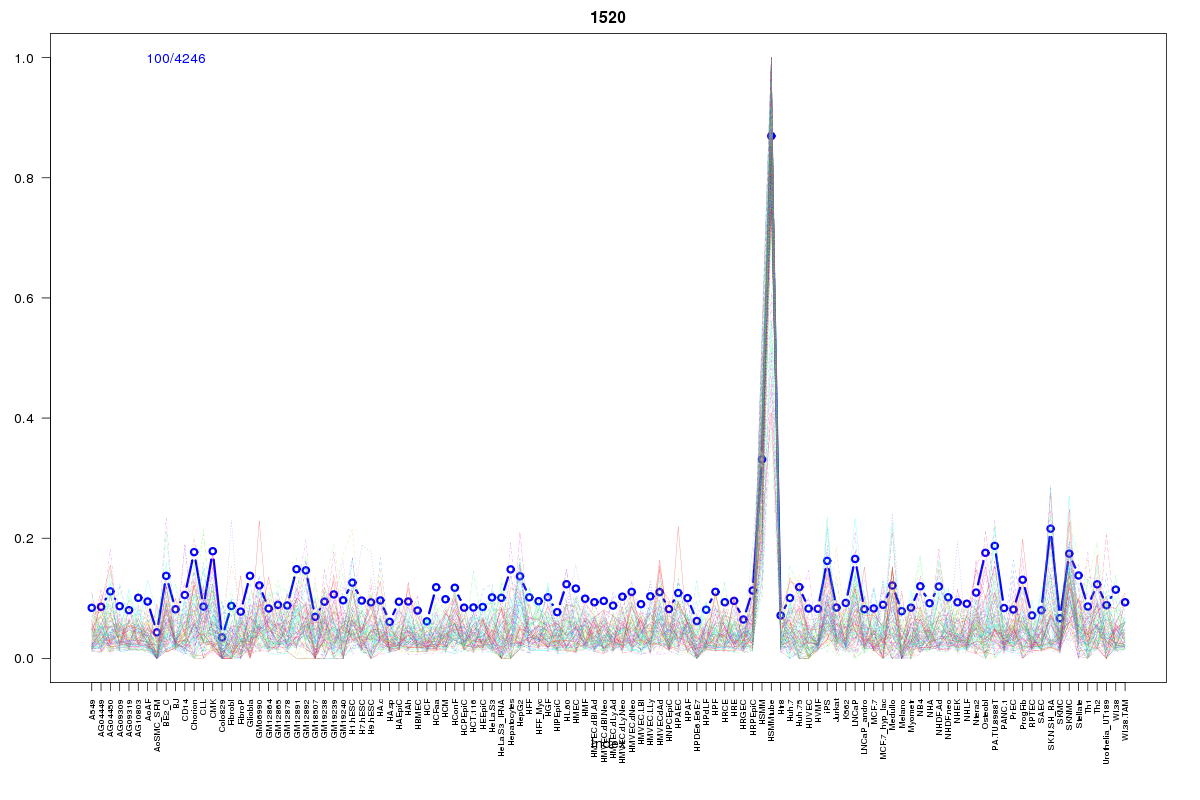 | 1520 | 1 |
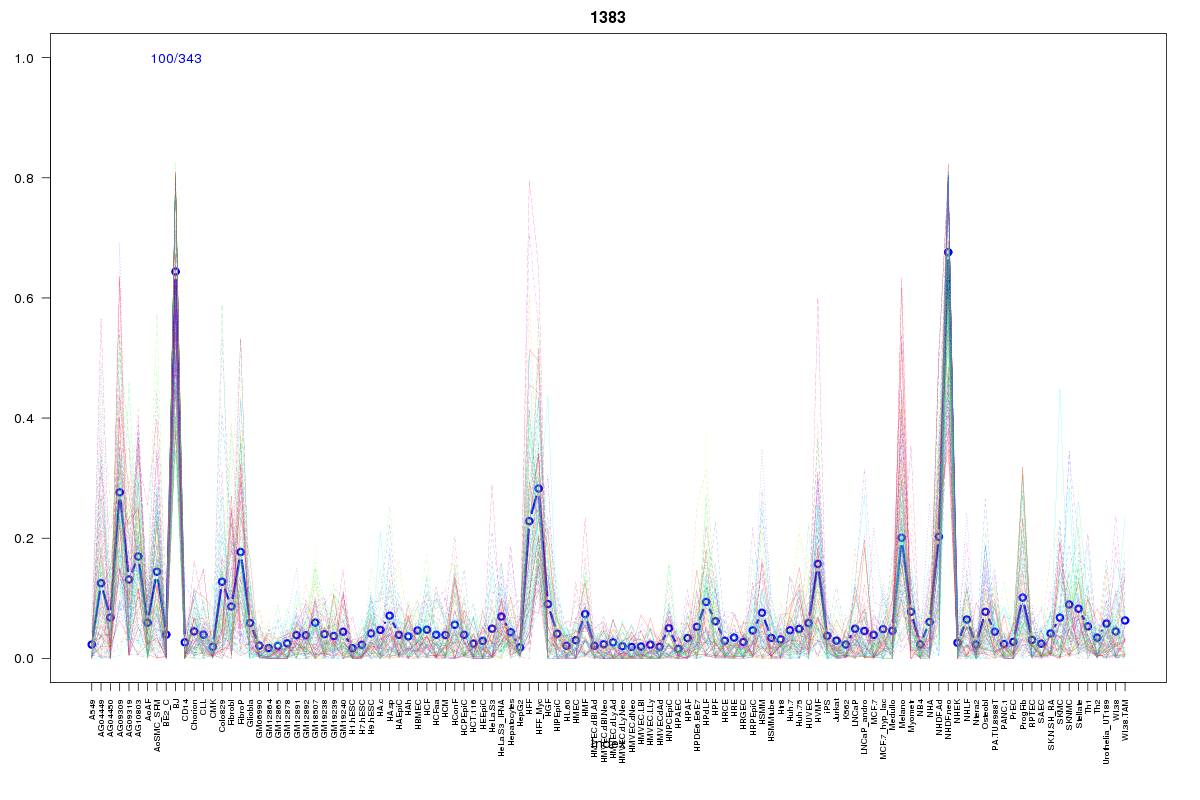 | 1383 | 1 |
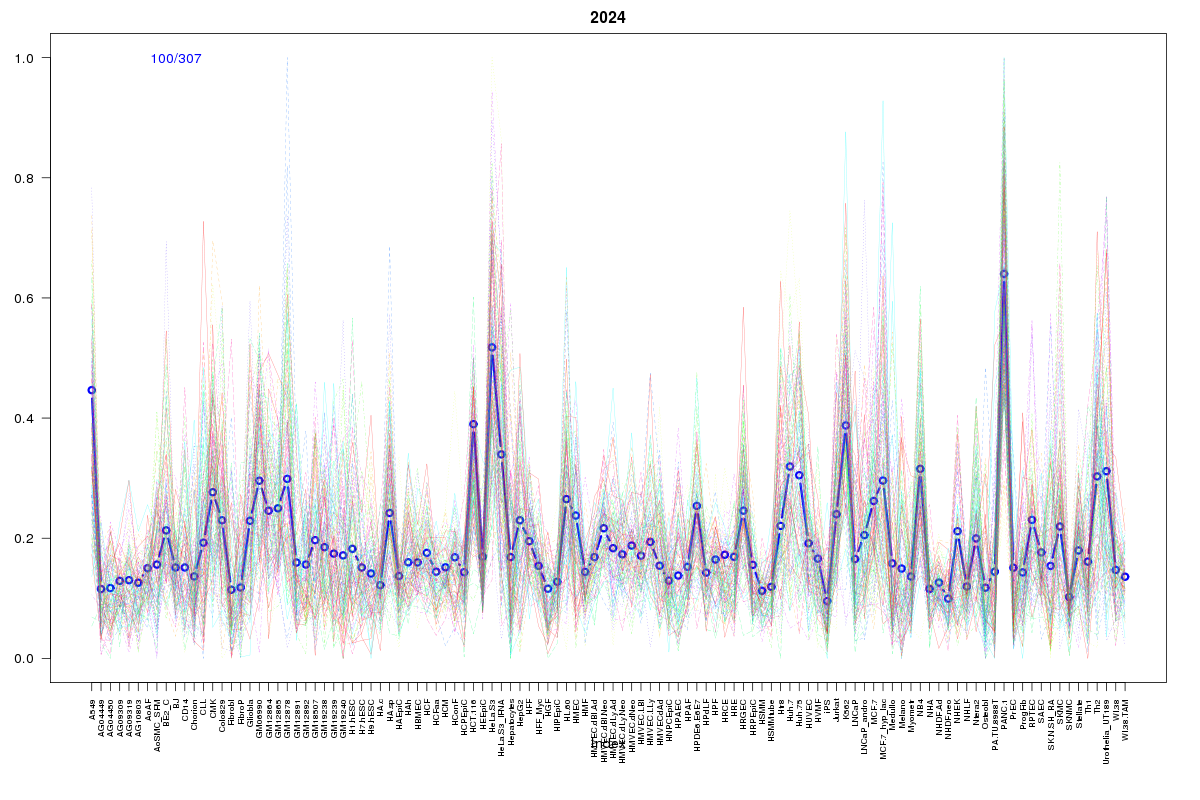 | 2024 | 1 |
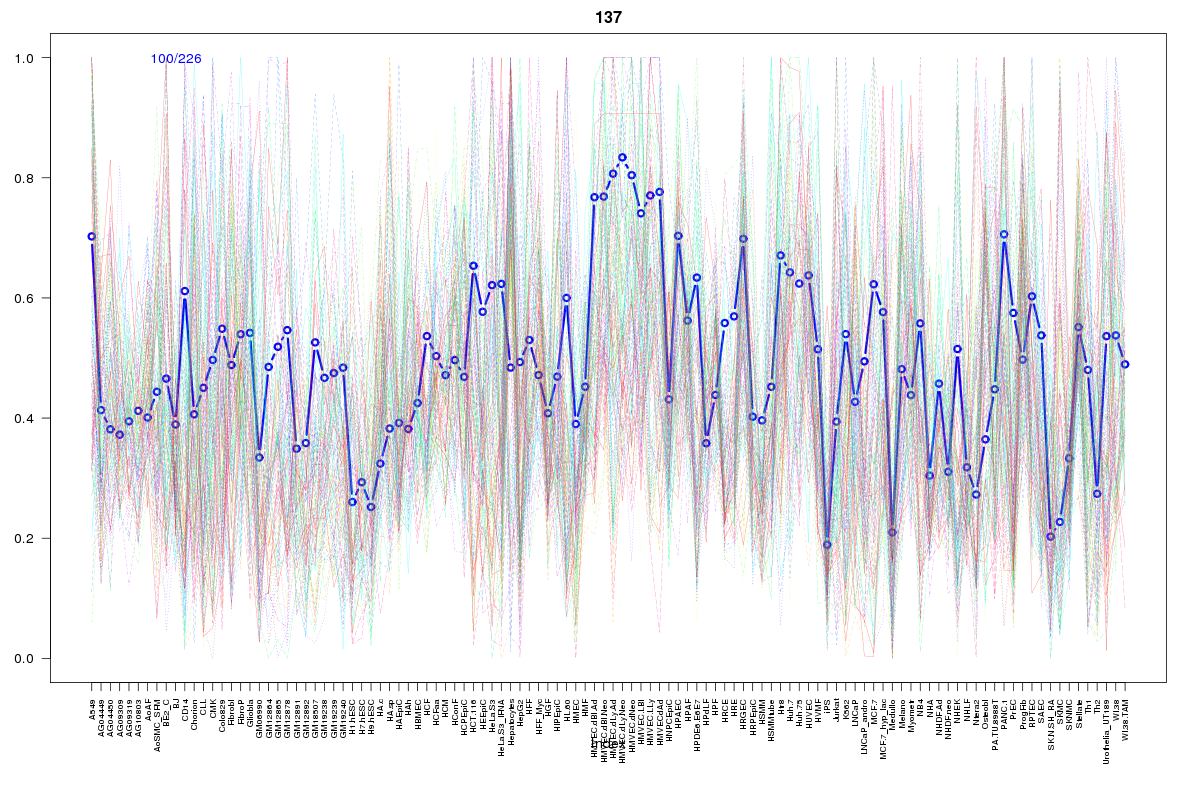 | 137 | 1 |
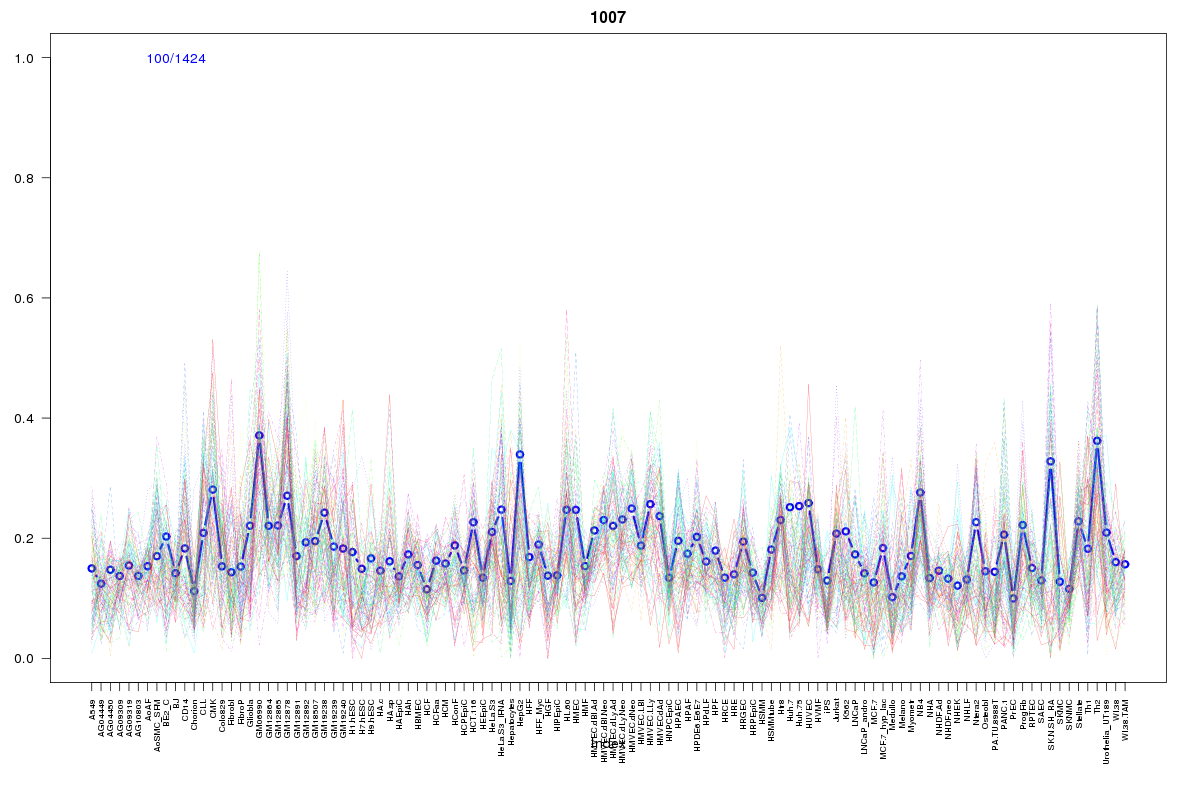 | 1007 | 1 |
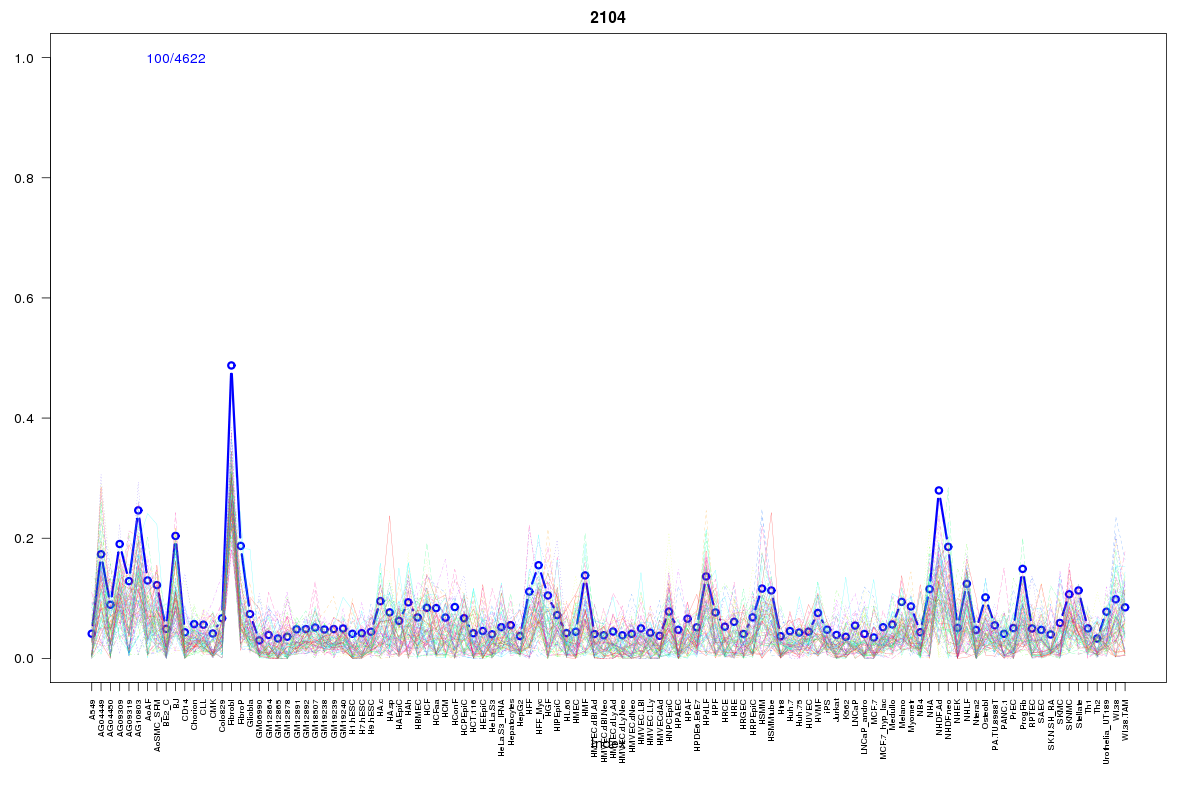 | 2104 | 1 |
 | 1319 | 1 |
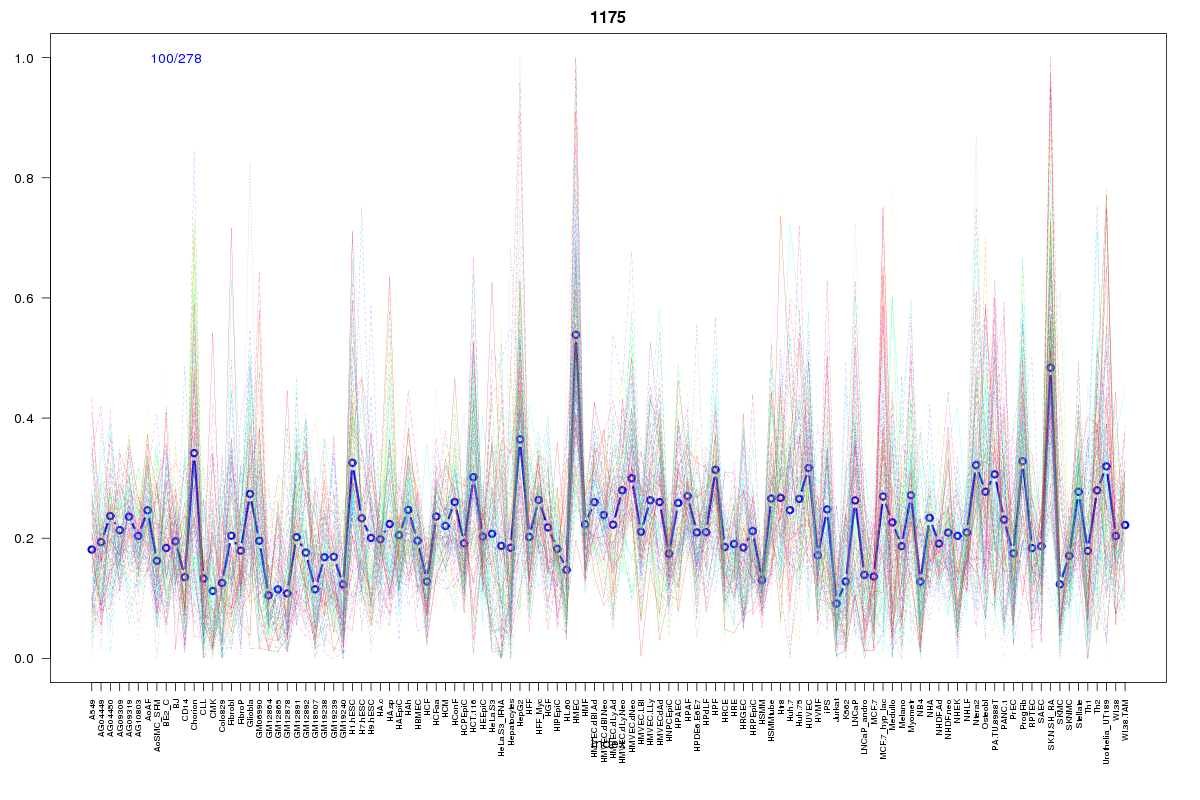 | 1175 | 1 |
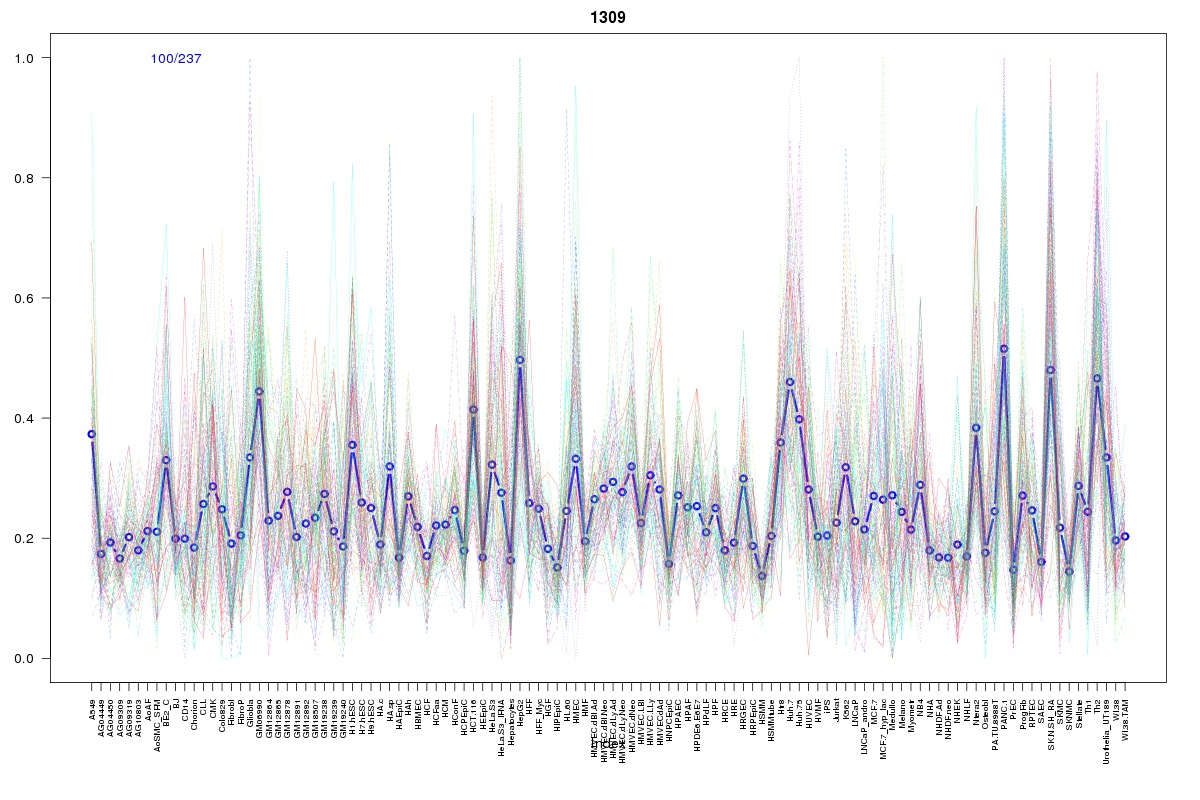 | 1309 | 1 |
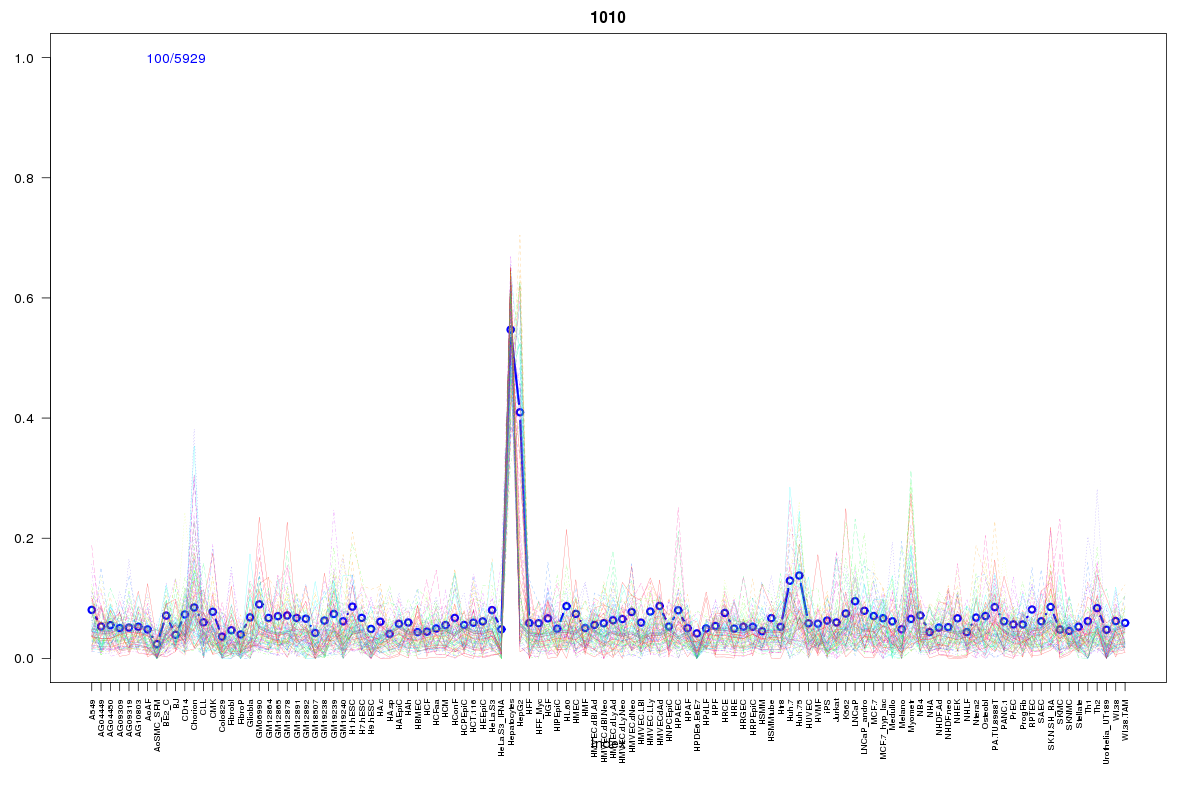 | 1010 | 1 |
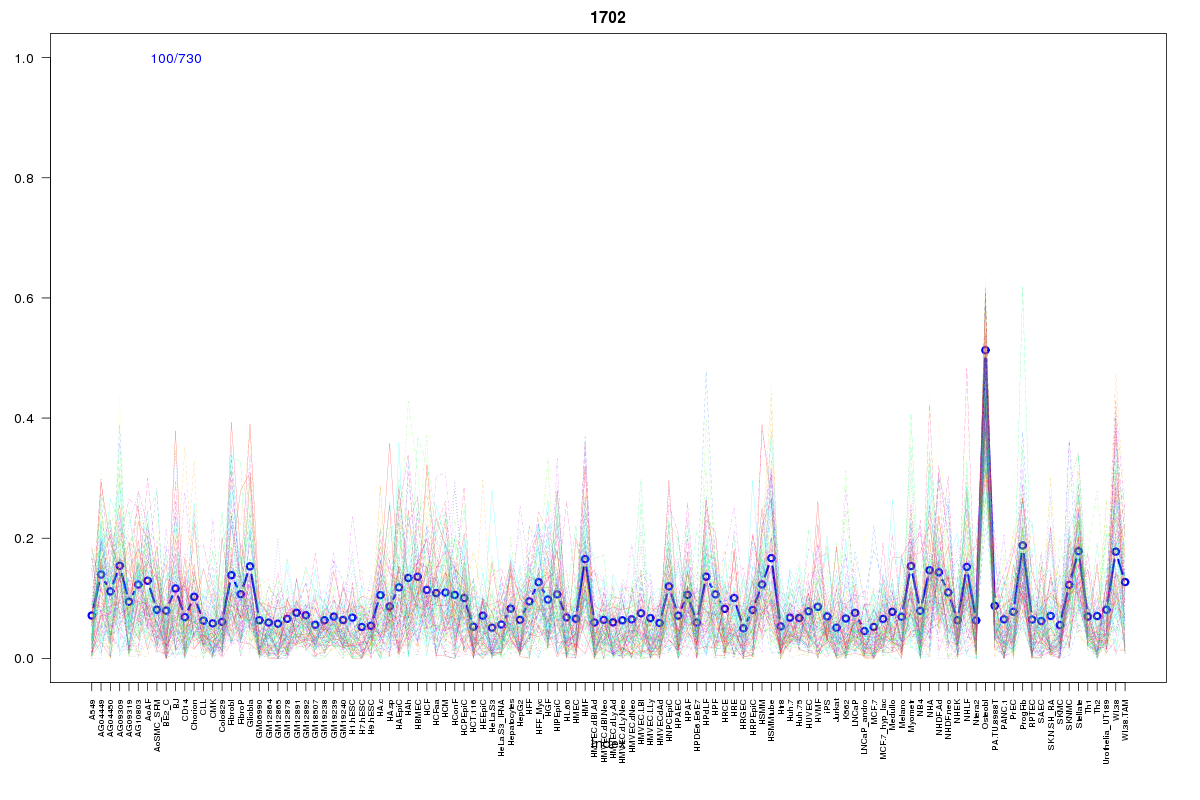 | 1702 | 1 |
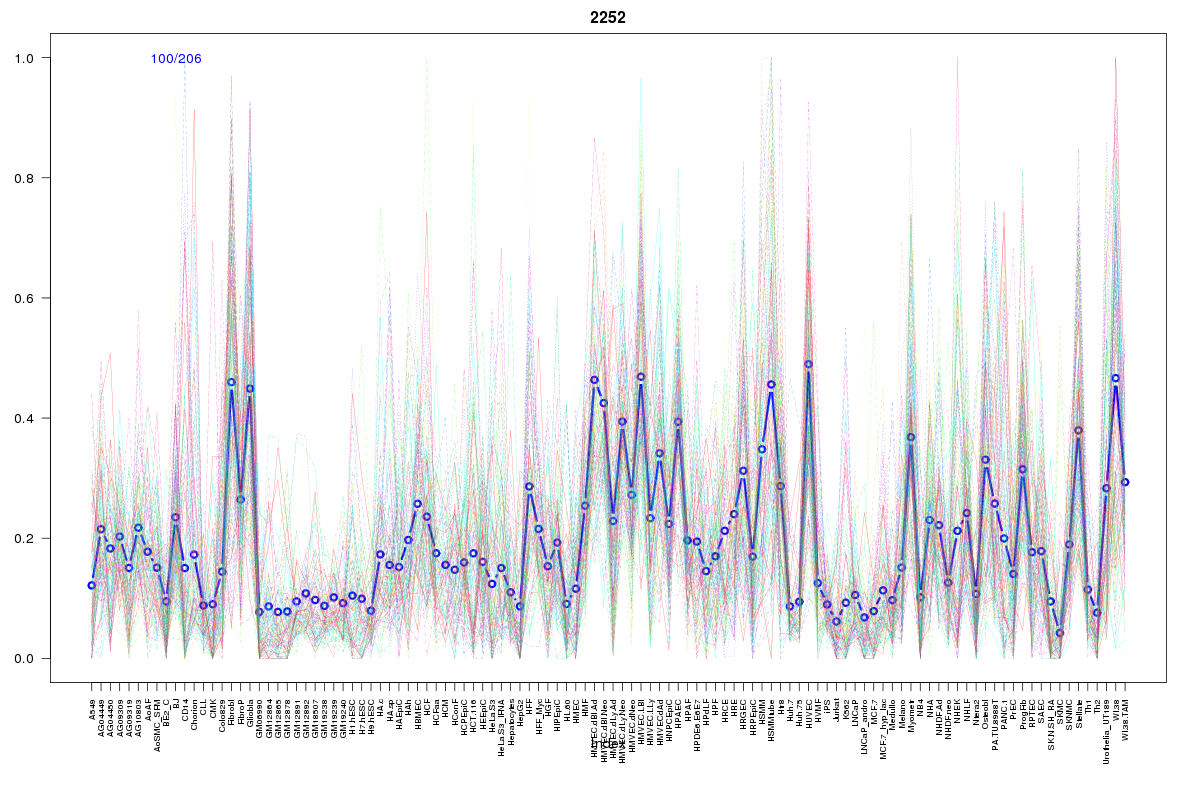 | 2252 | 1 |
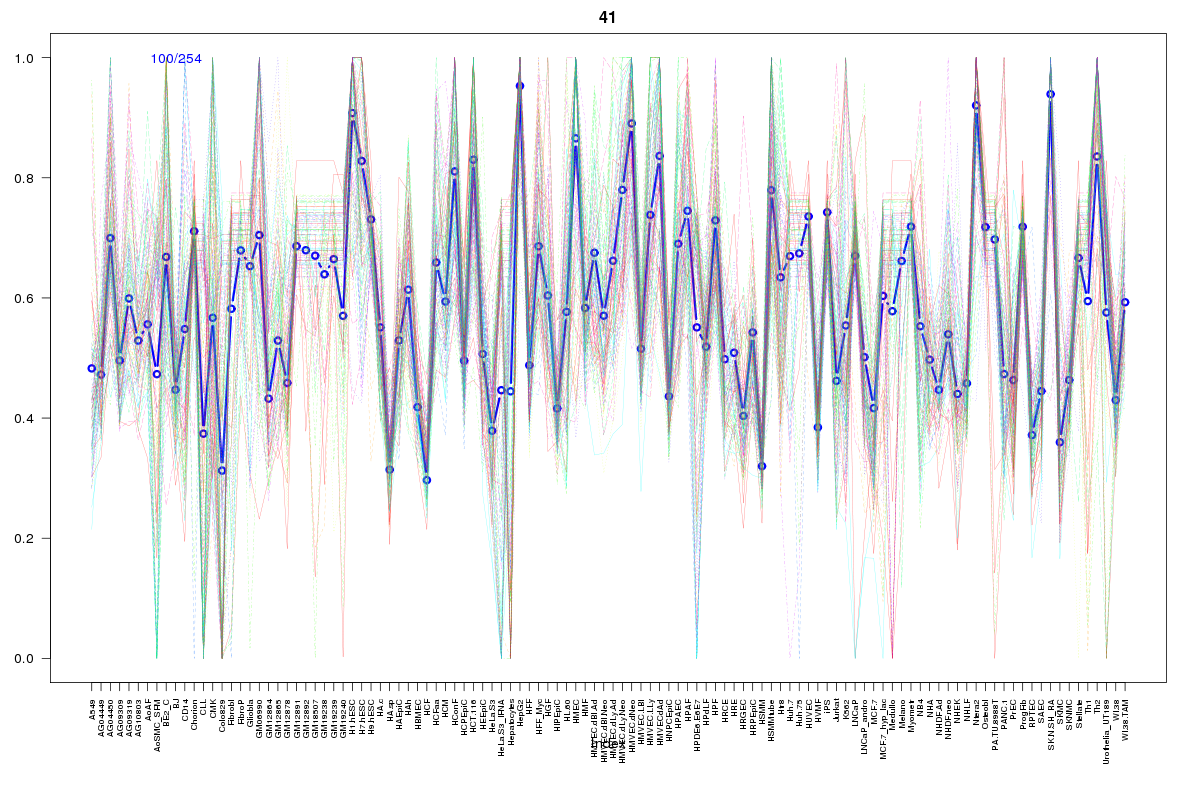 | 41 | 1 |
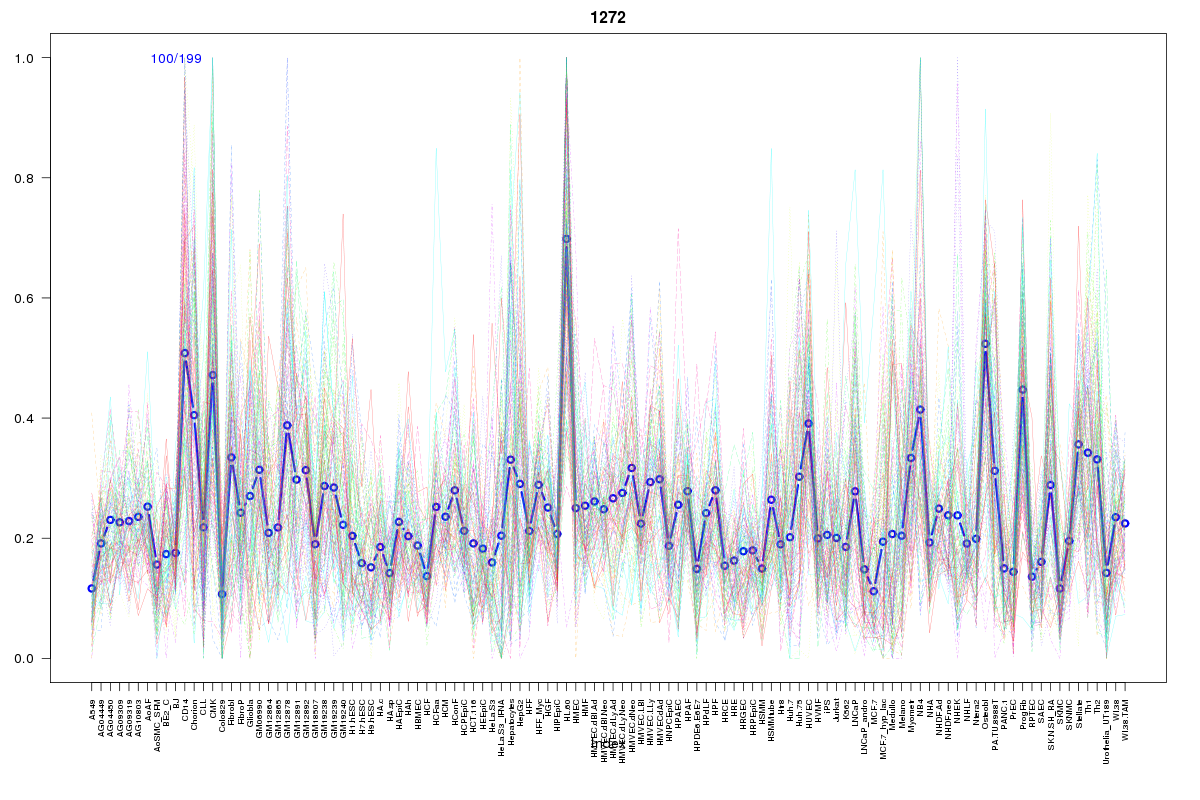 | 1272 | 1 |
 | 927 | 1 |
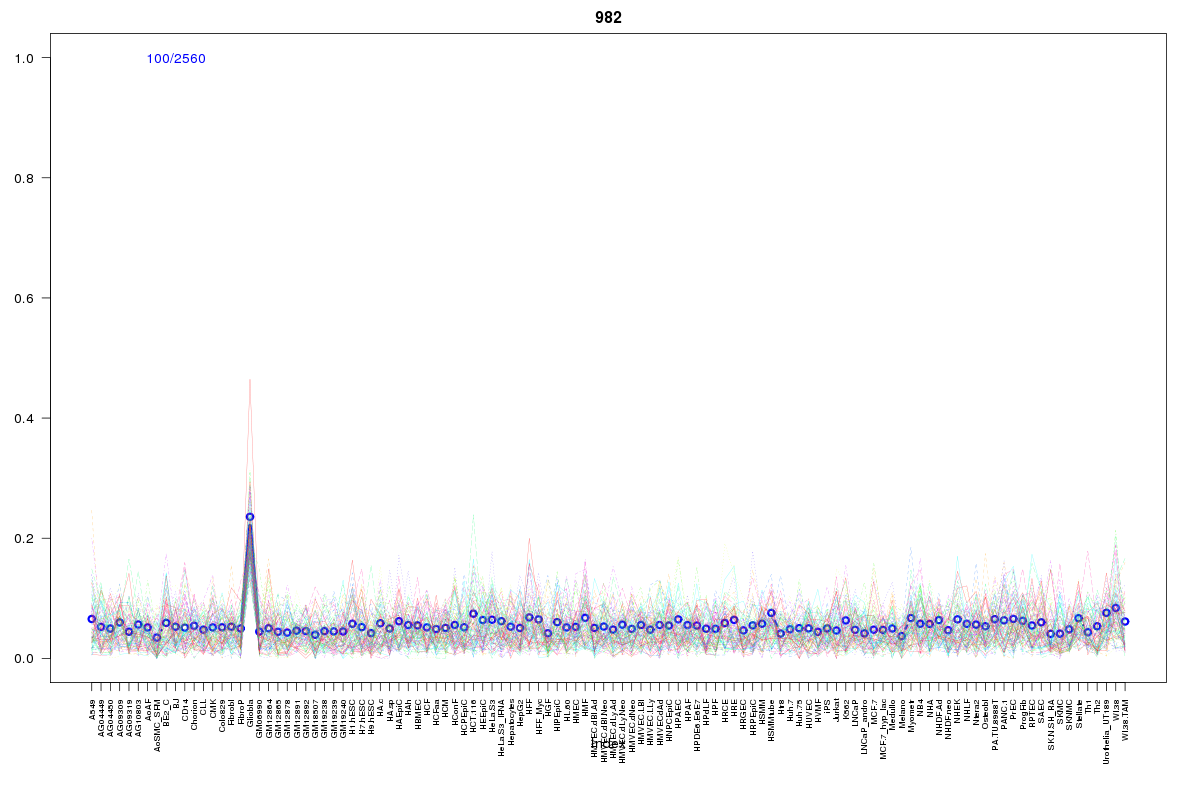 | 982 | 1 |
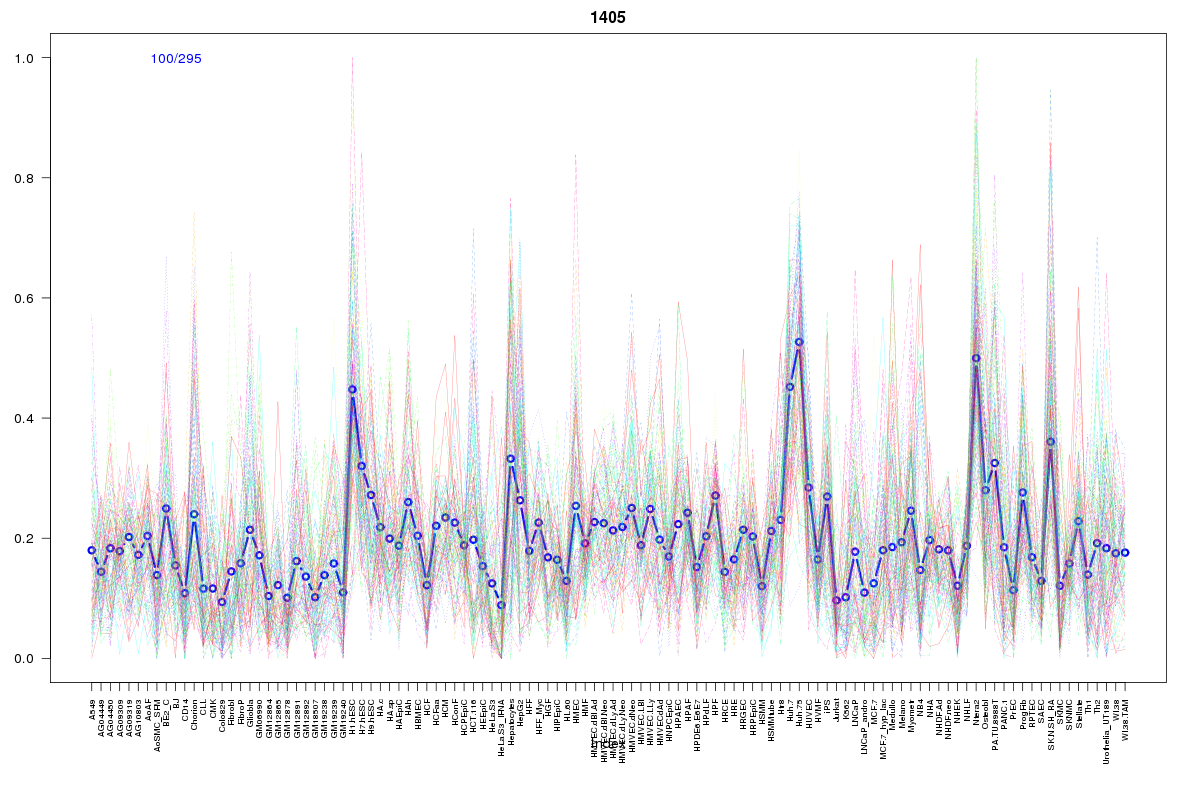 | 1405 | 1 |
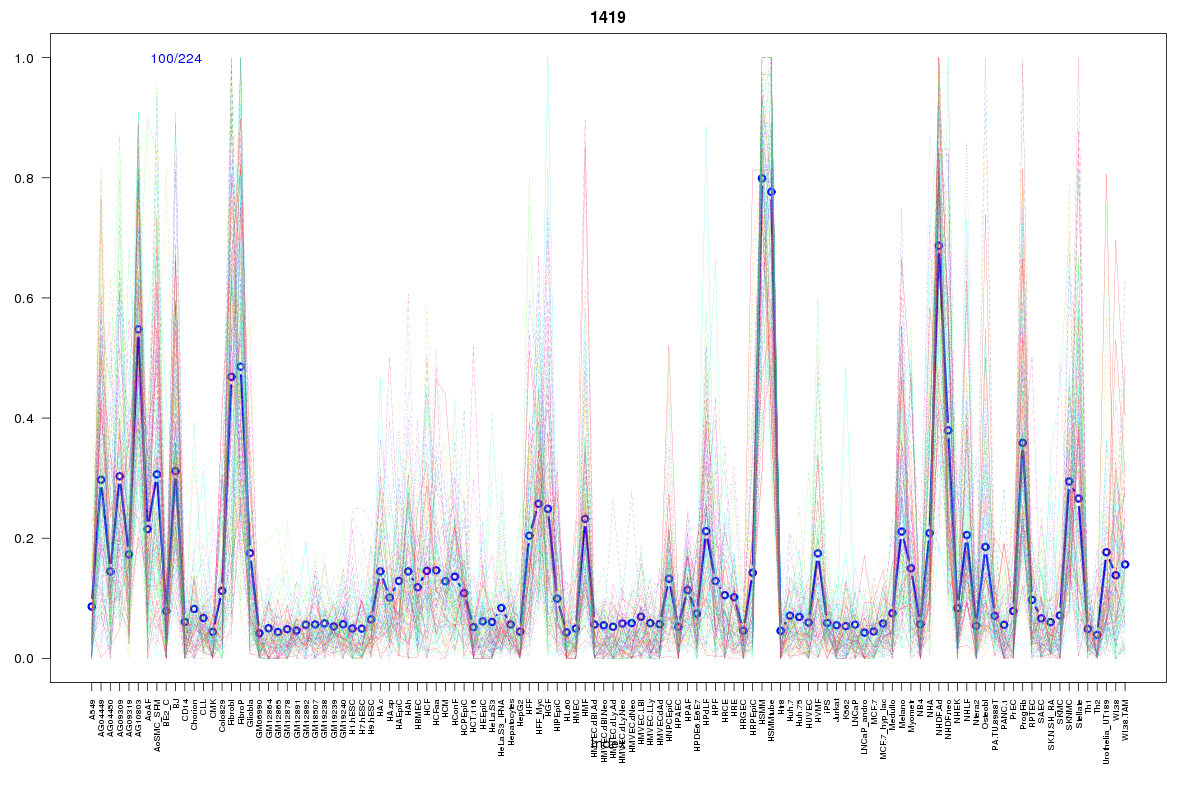 | 1419 | 1 |
 | 416 | 1 |
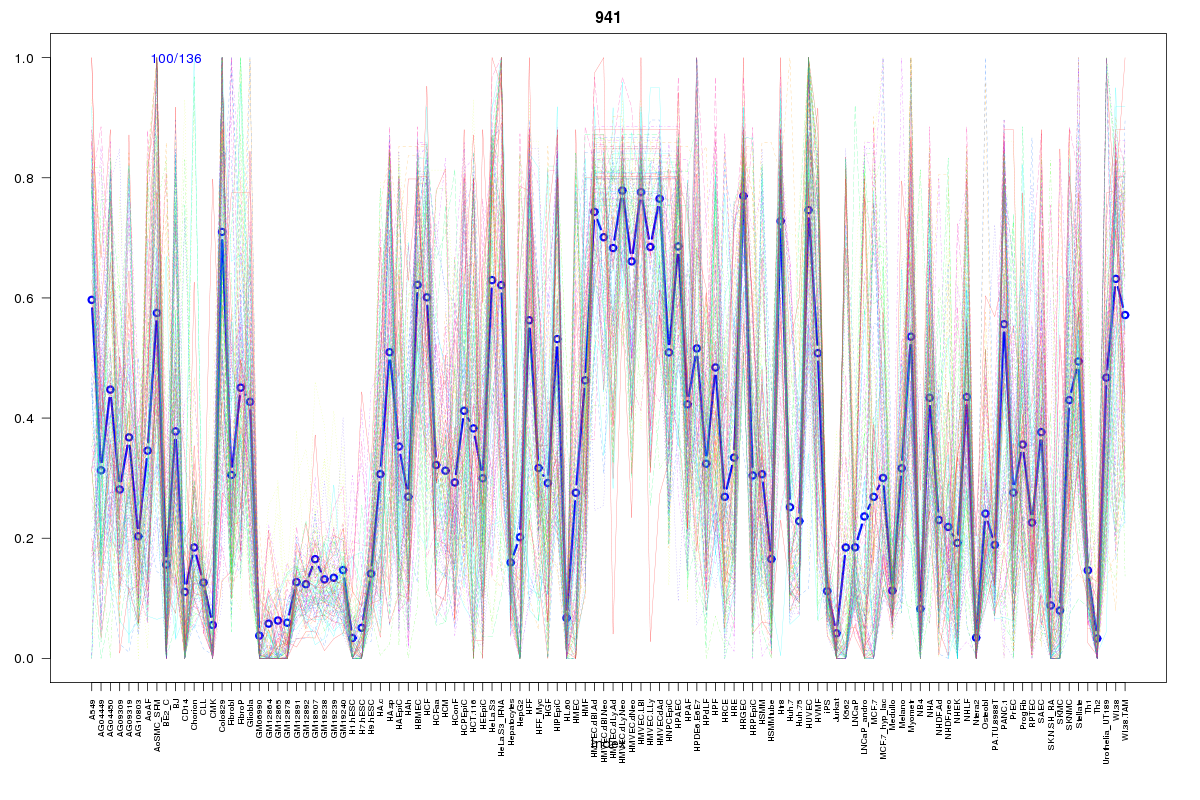 | 941 | 1 |
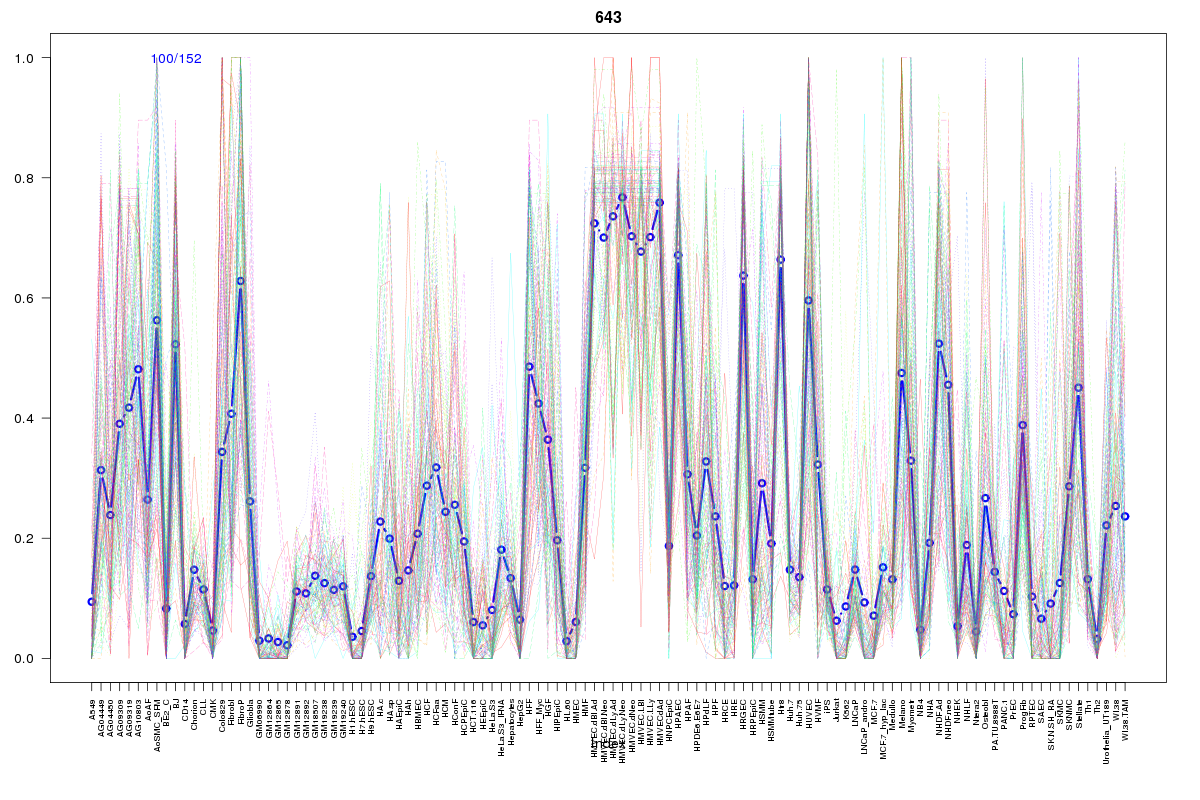 | 643 | 1 |
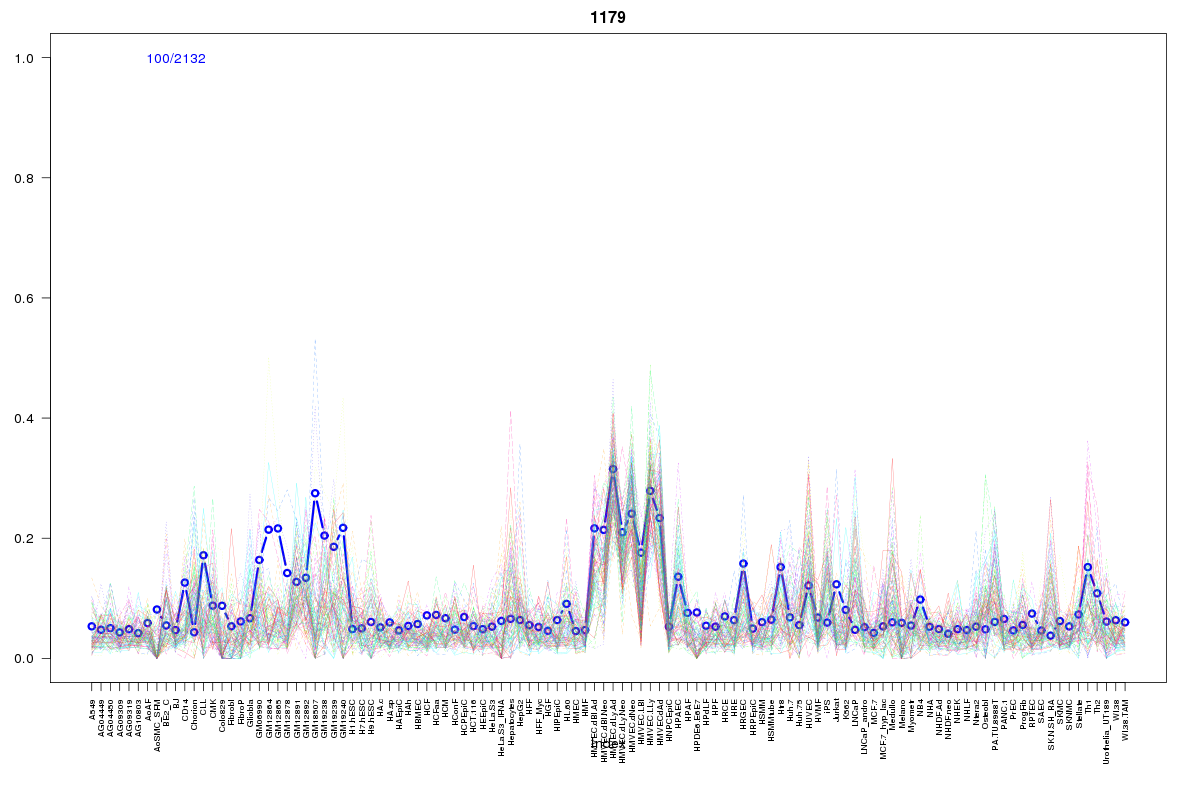 | 1179 | 1 |
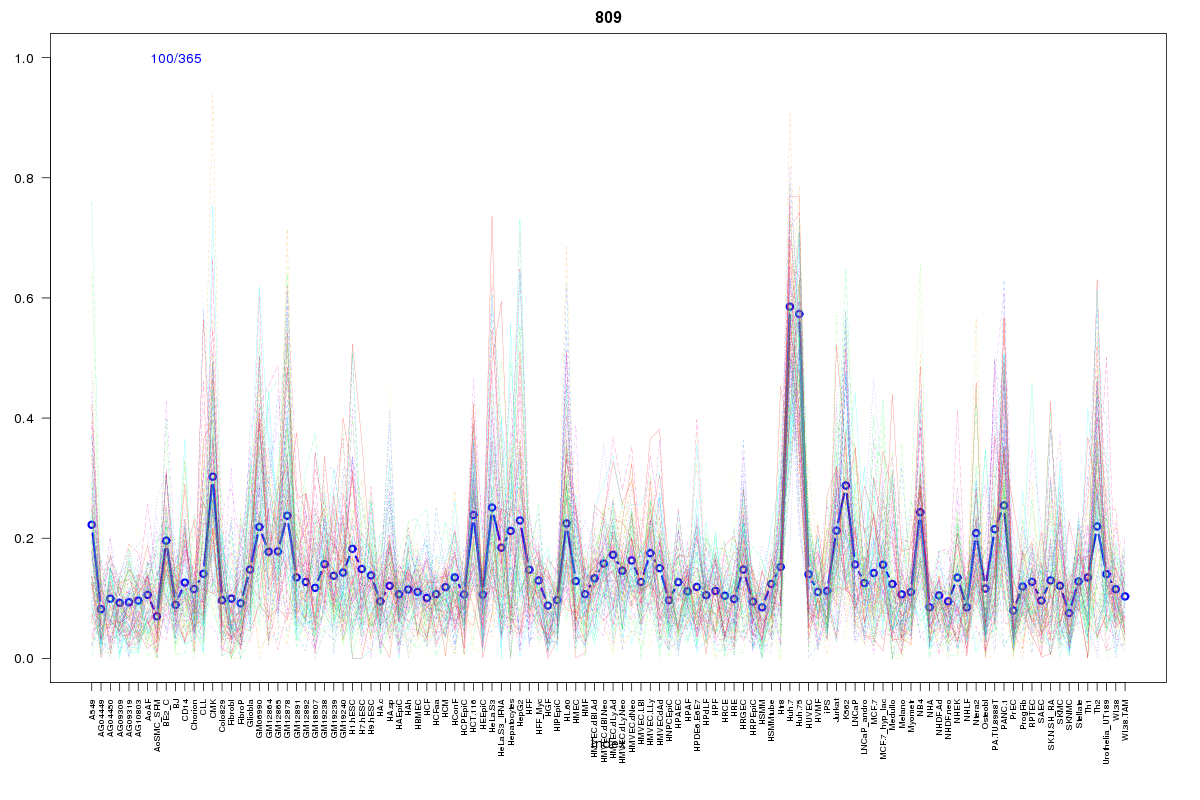 | 809 | 1 |
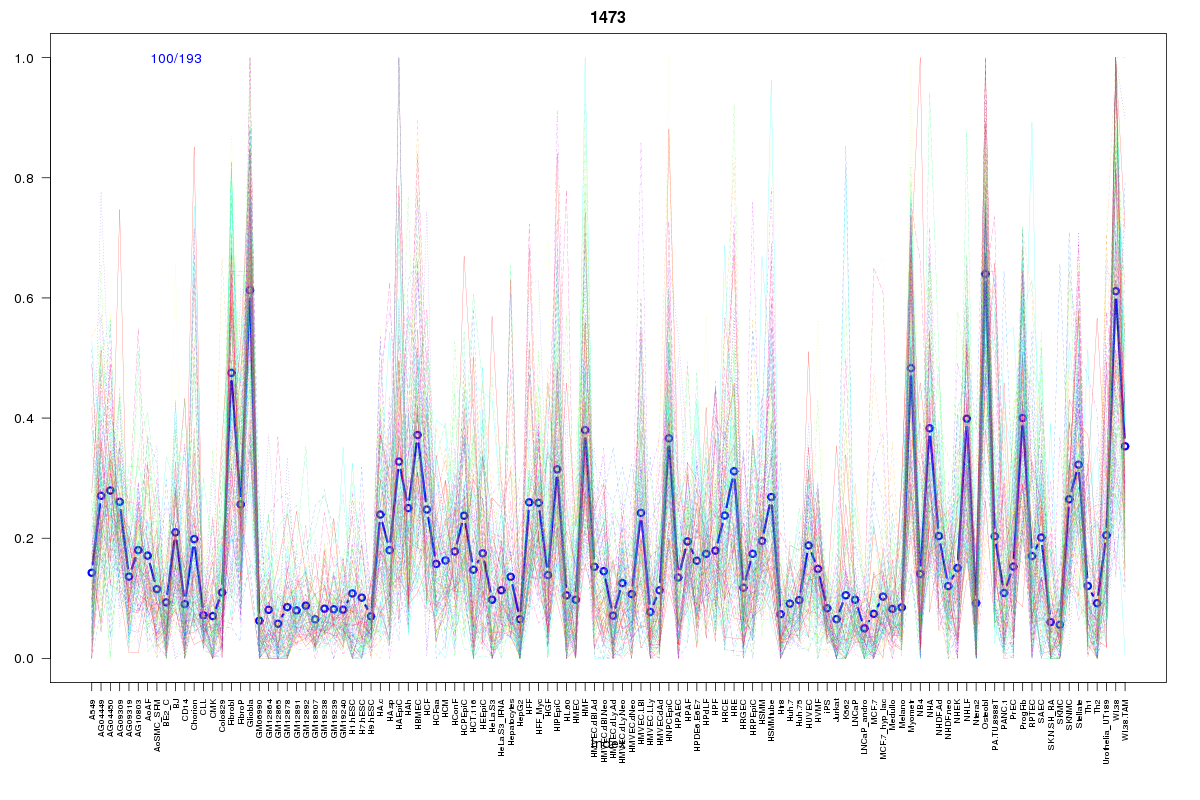 | 1473 | 1 |
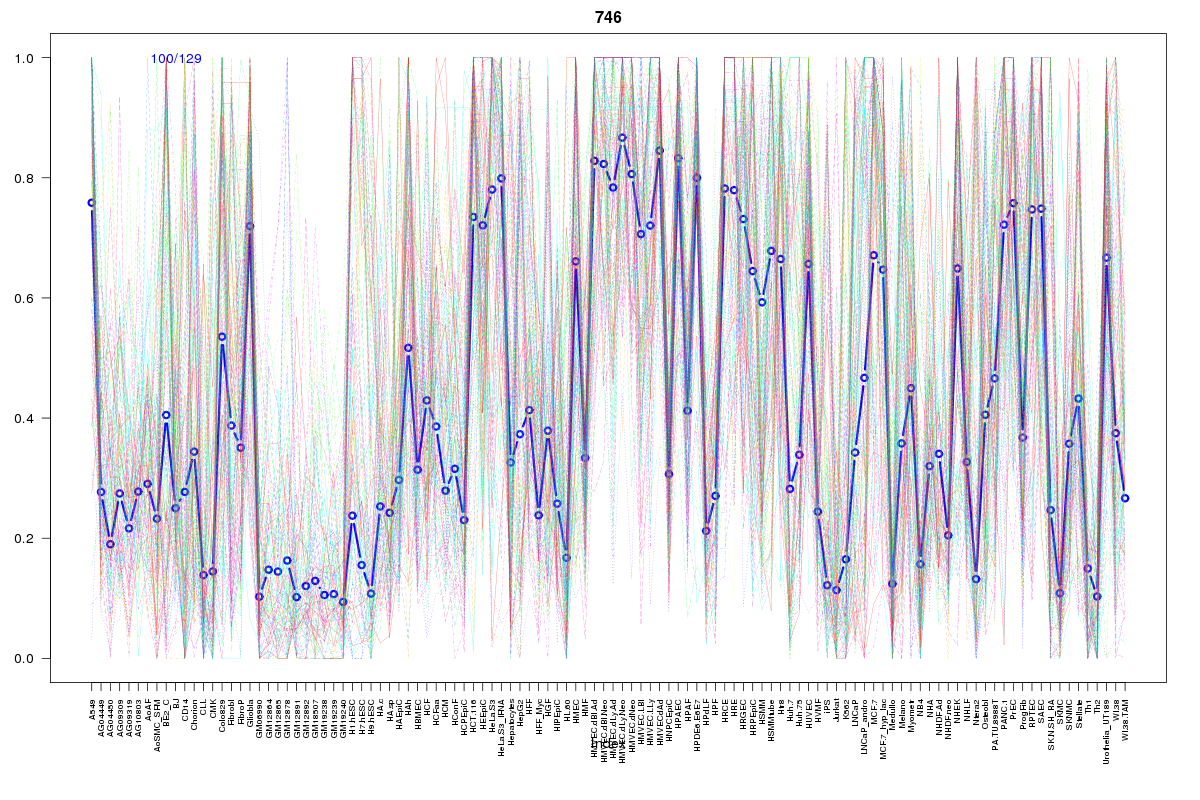 | 746 | 1 |
 | 979 | 1 |
 | 251 | 1 |
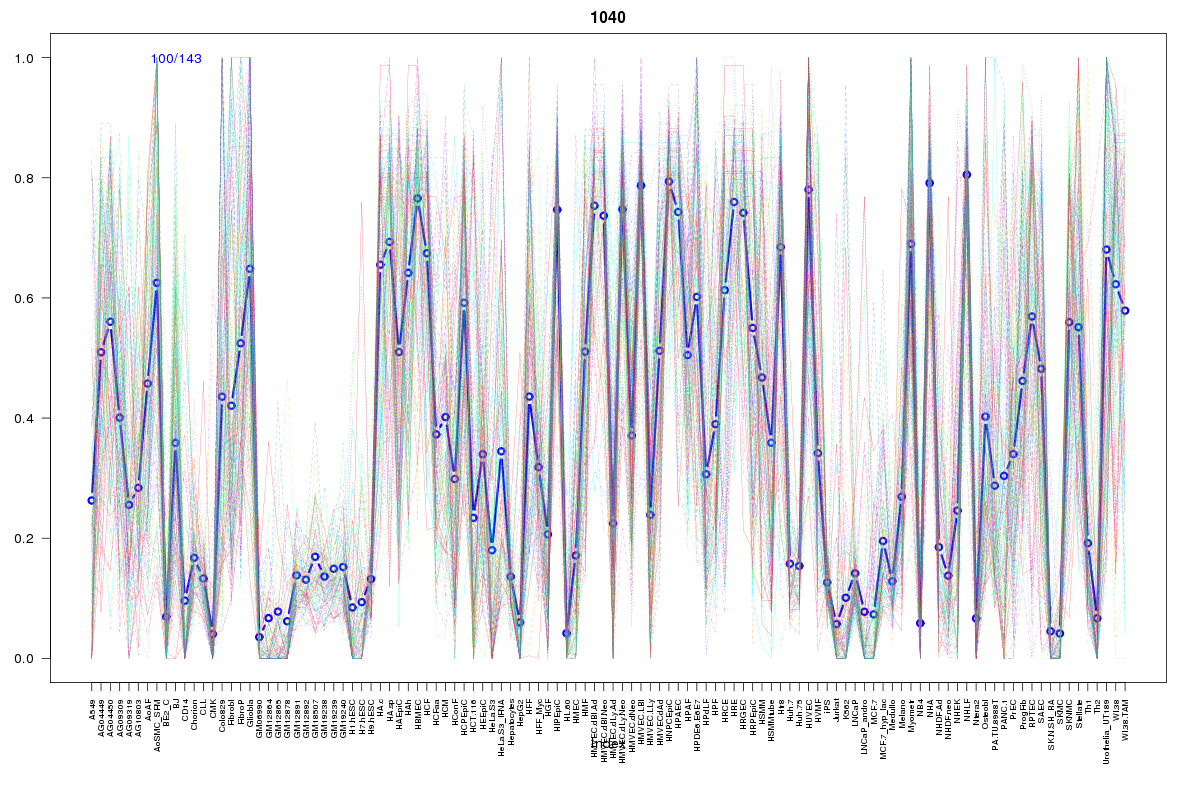 | 1040 | 1 |
 | 1078 | 1 |
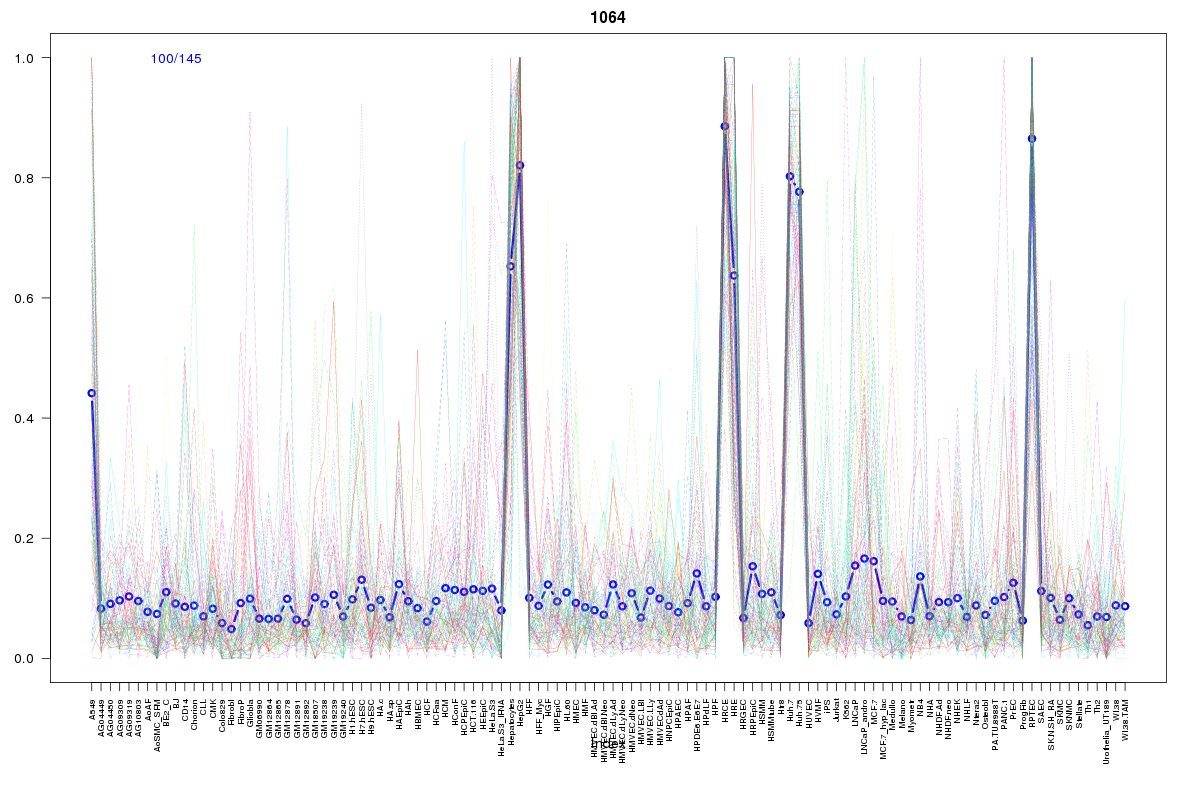 | 1064 | 1 |
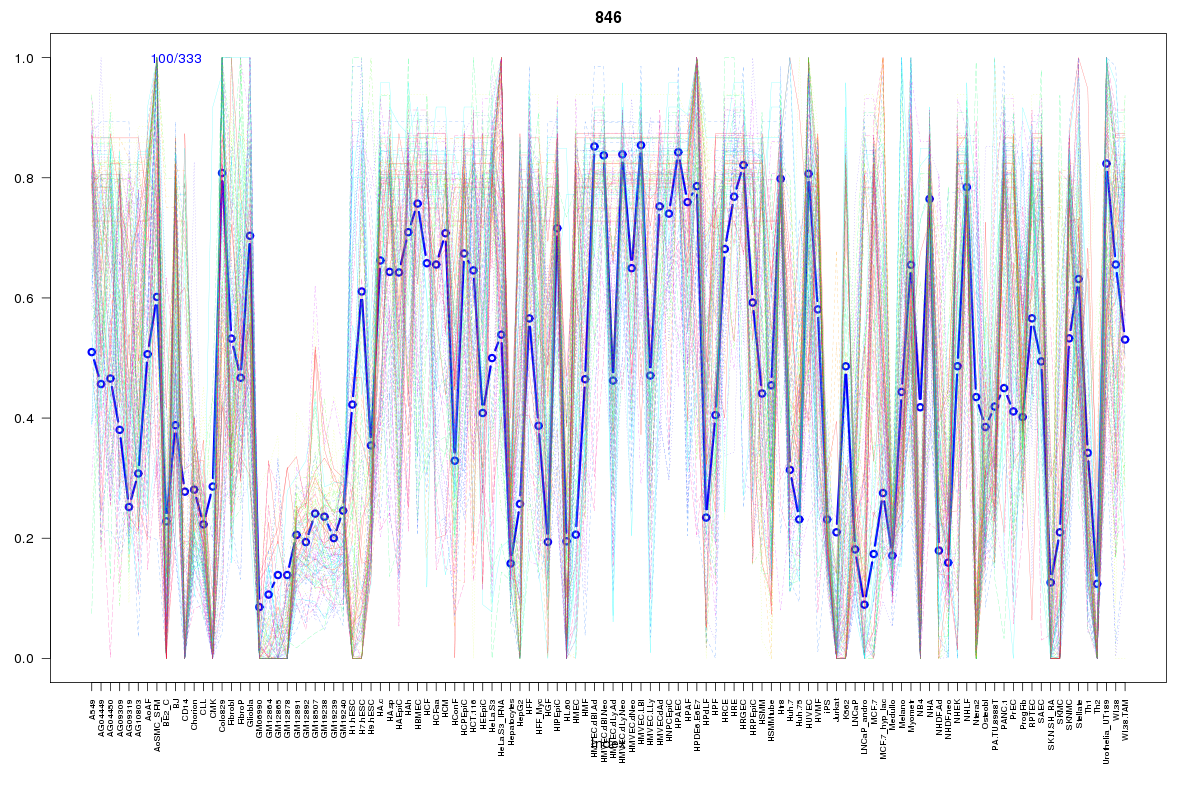 | 846 | 1 |
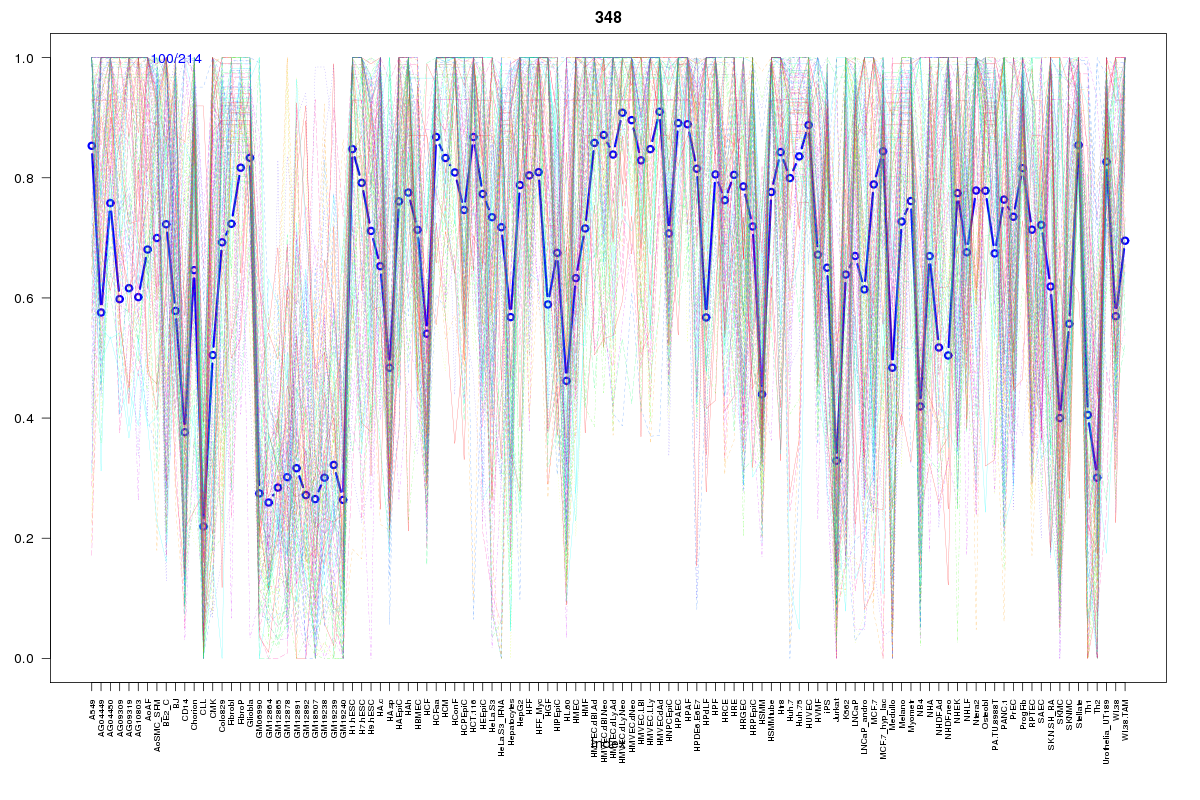 | 348 | 1 |
 | 881 | 1 |
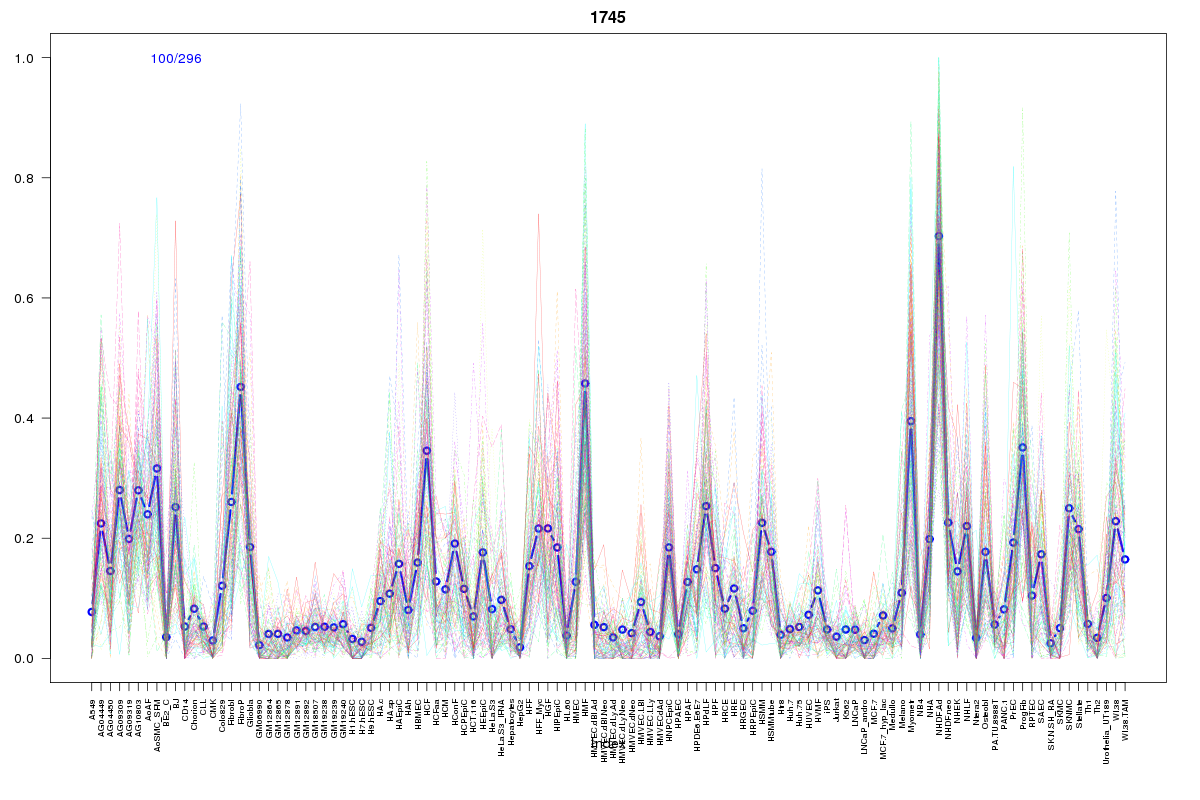 | 1745 | 1 |
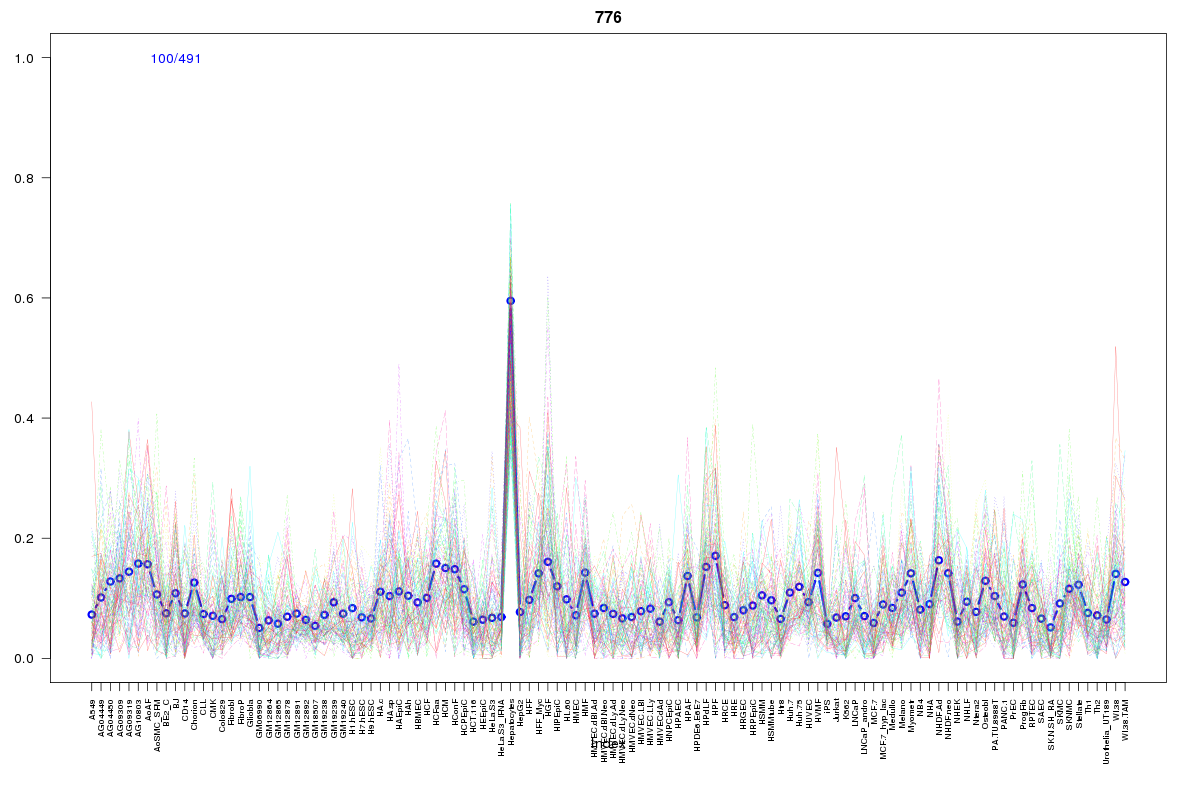 | 776 | 1 |
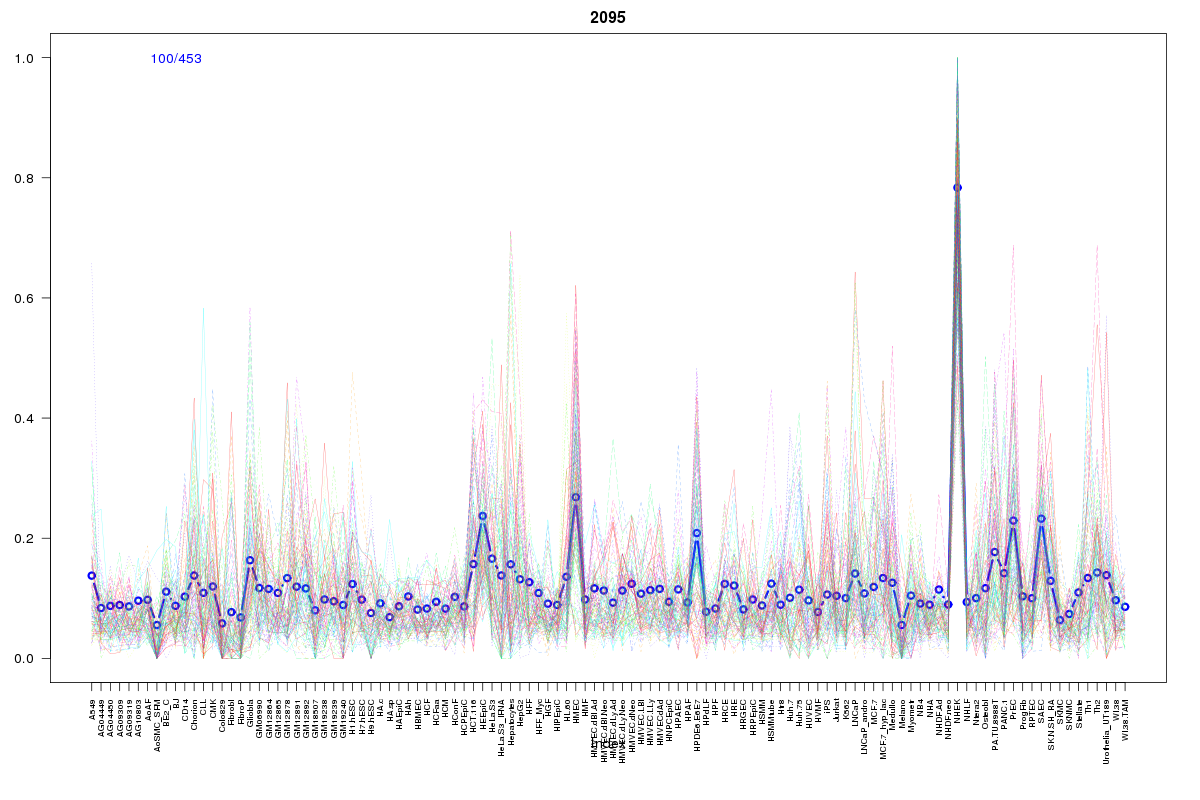 | 2095 | 1 |
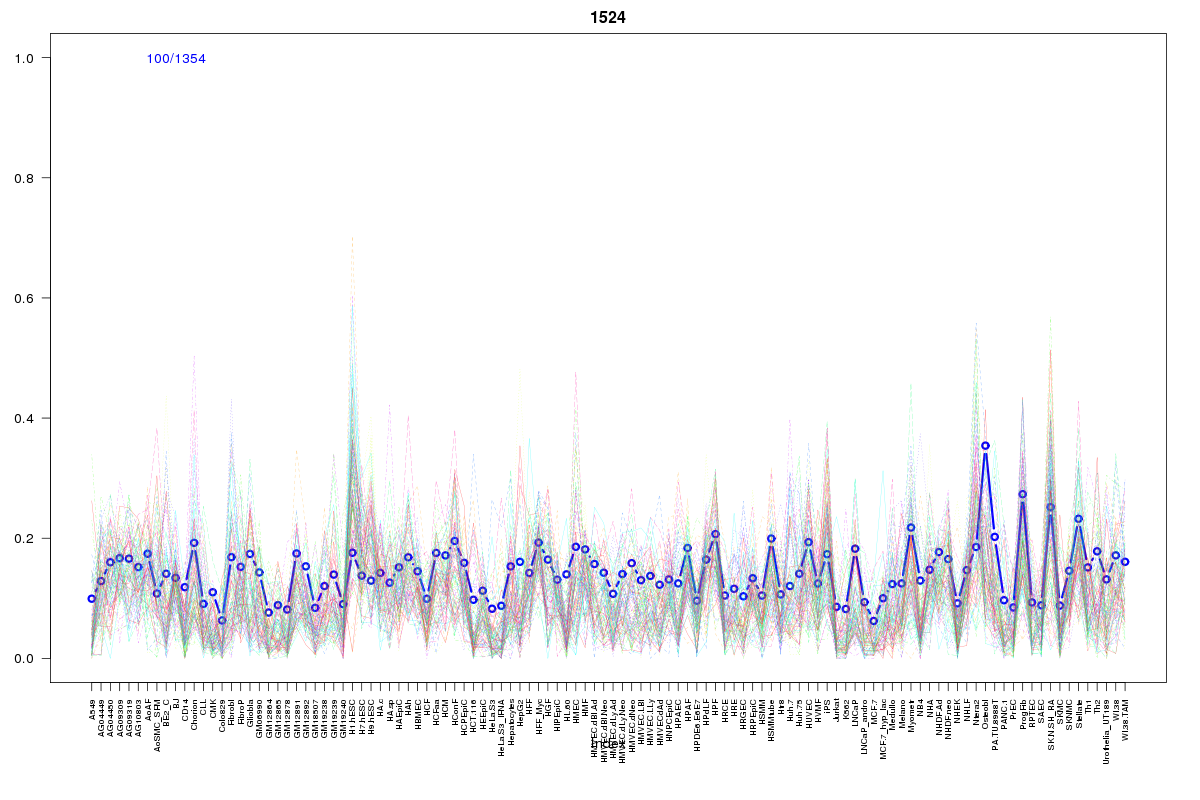 | 1524 | 1 |
 | 978 | 1 |
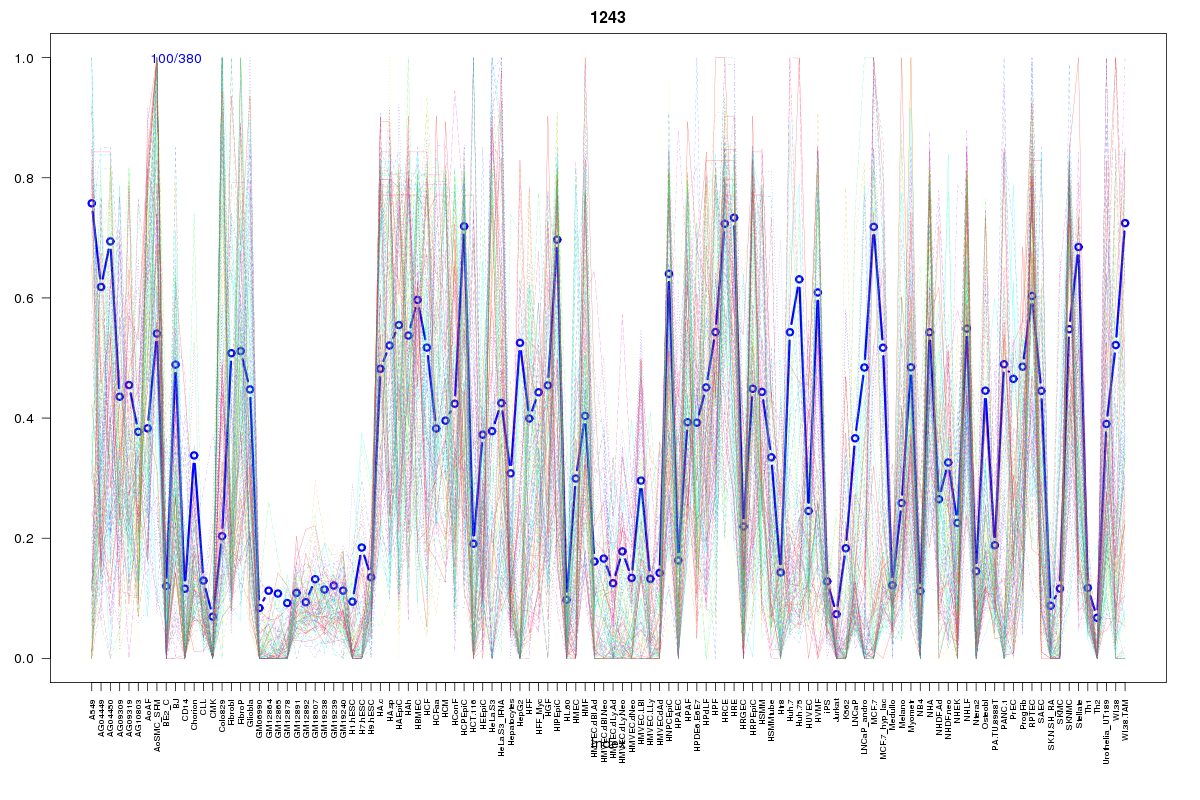 | 1243 | 1 |
 | 1075 | 1 |
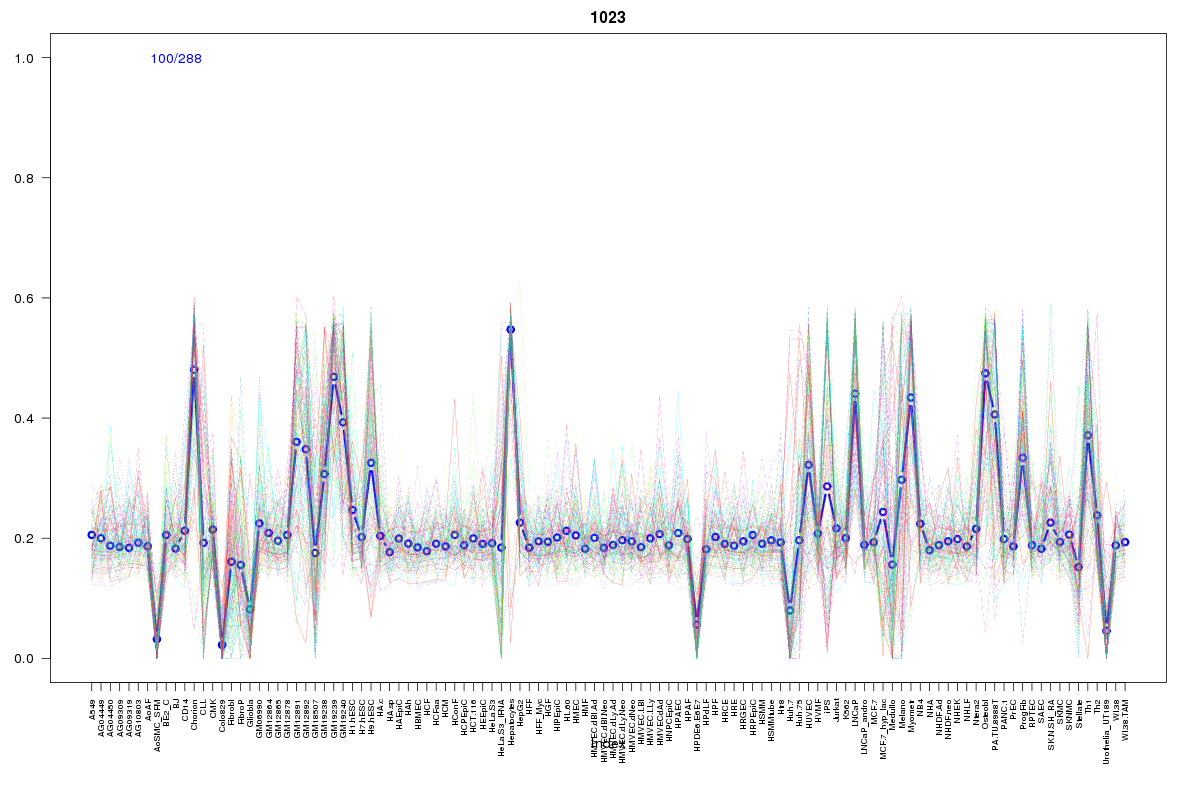 | 1023 | 1 |
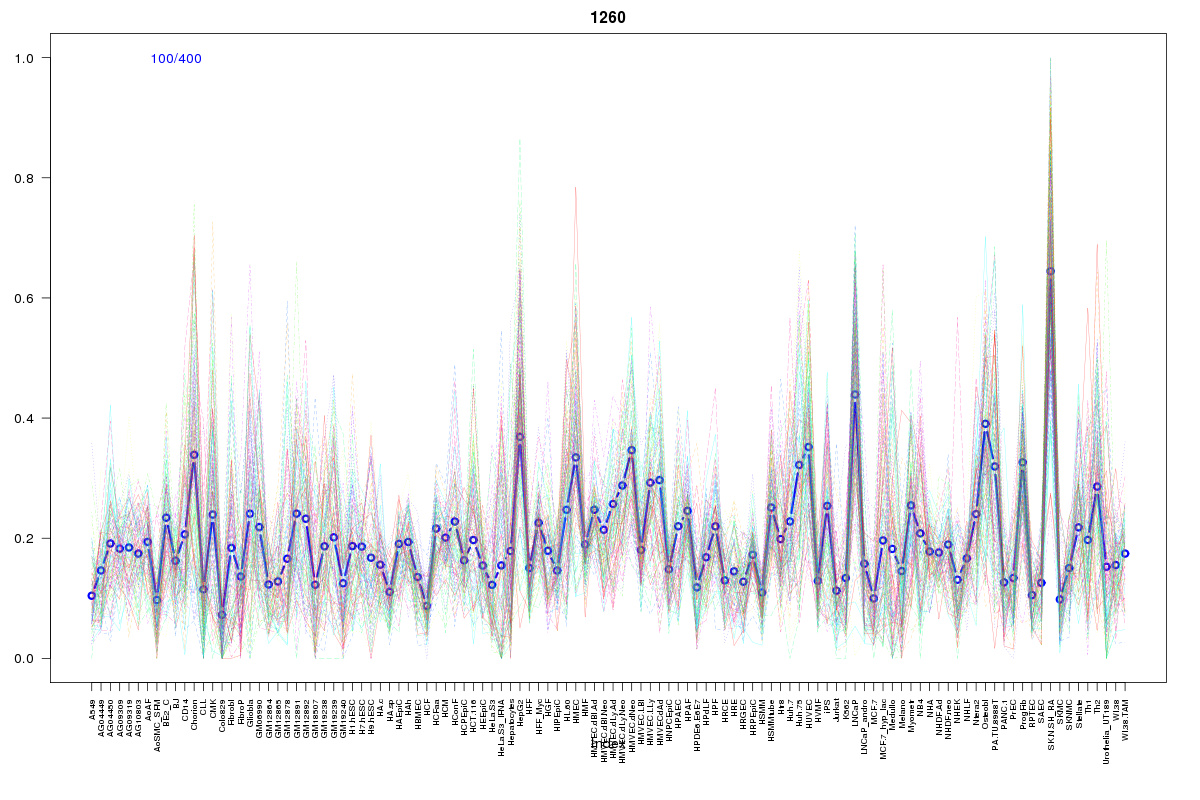 | 1260 | 1 |
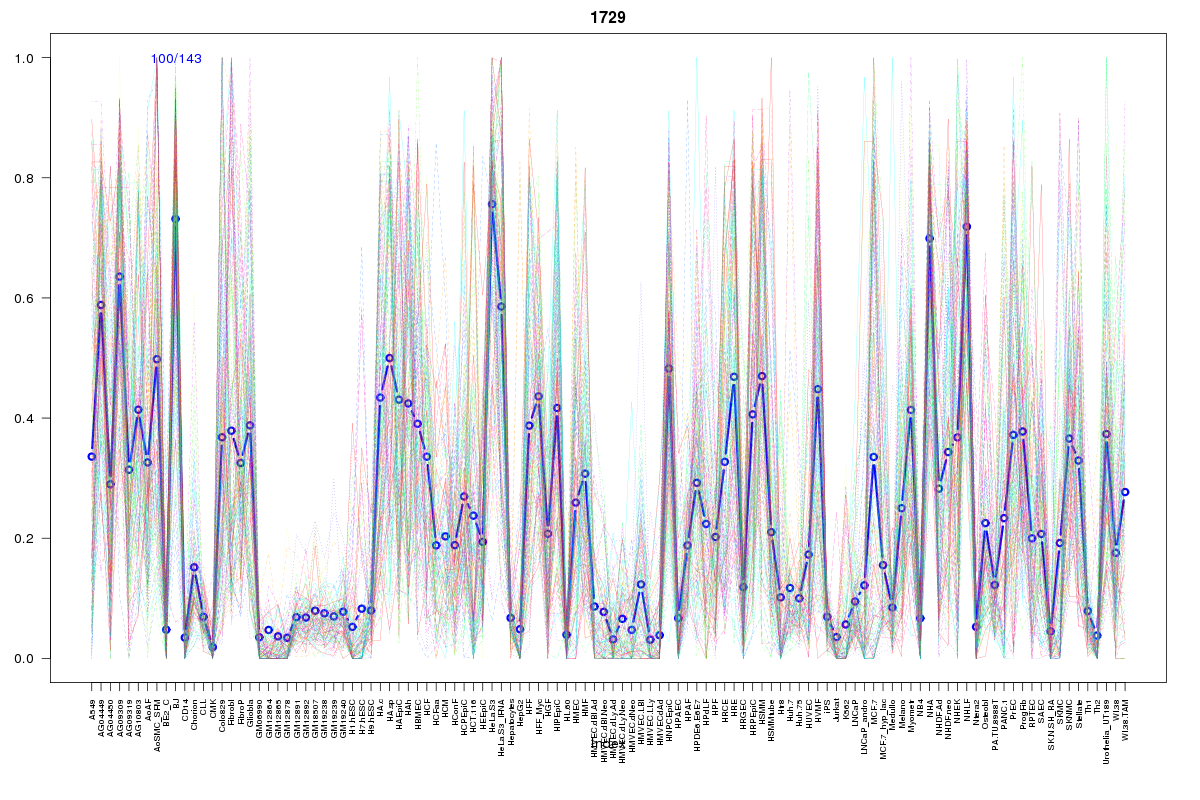 | 1729 | 1 |
 | 739 | 1 |
 | 2191 | 1 |
 | 2061 | 1 |
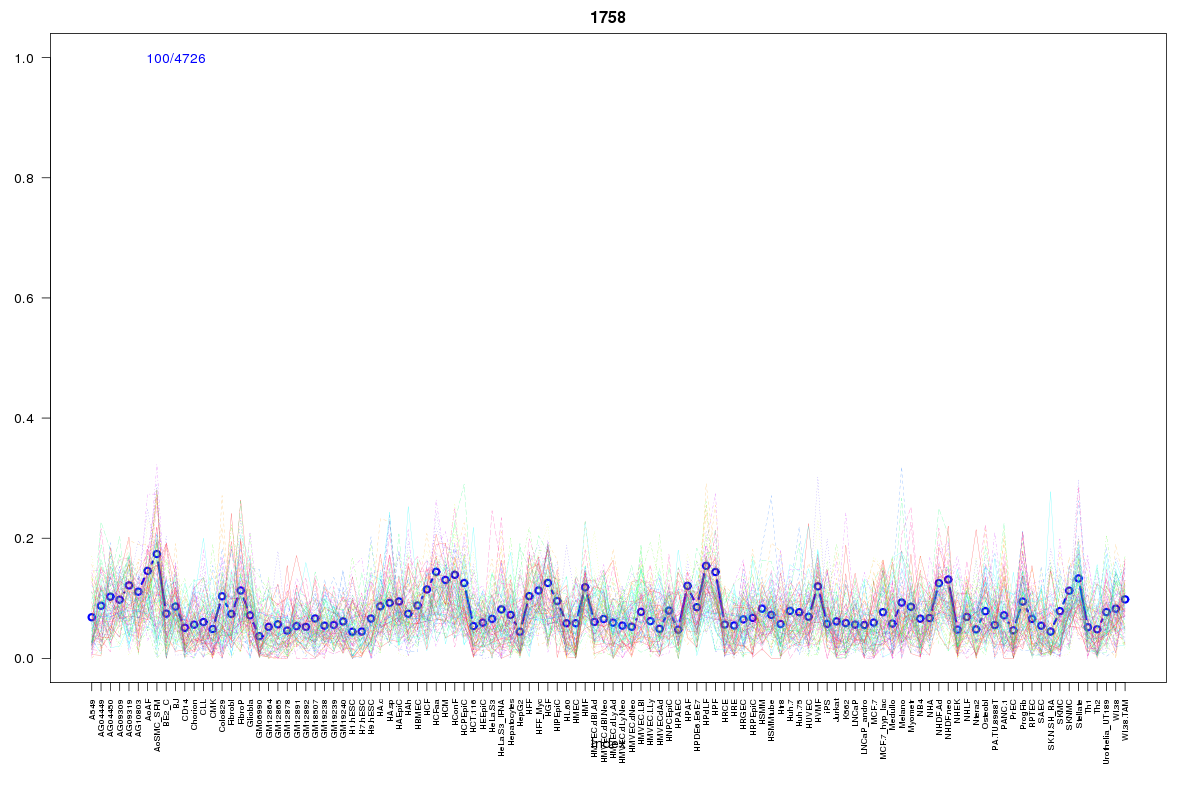 | 1758 | 1 |
 | 590 | 1 |
 | 1659 | 1 |
 | 1070 | 1 |
Resources
BED file downloads
Connects to 155 DHS sitesTop 10 Correlated DHS Sites
p-values indiciate significant higher or lower correlationExternal Databases
UCSCEnsembl (ENSG00000078399)