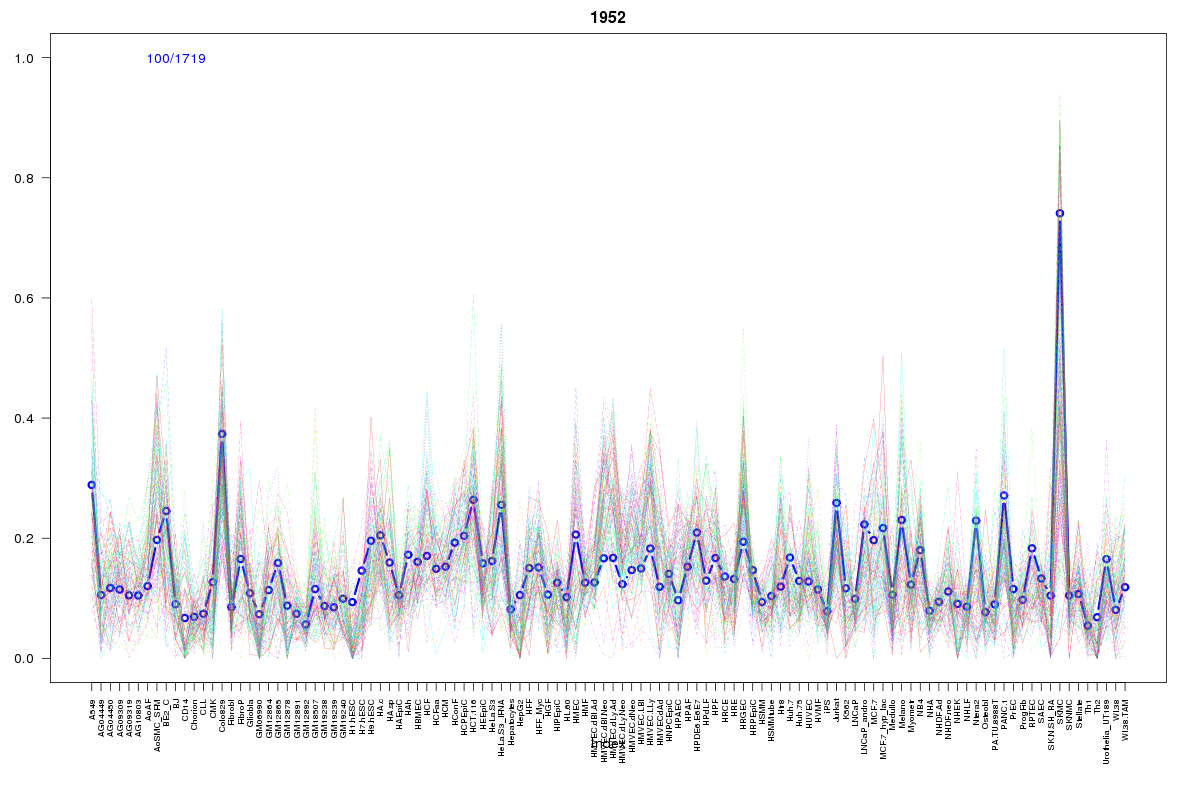
SOM cluster: 1952
Cluster Hypersensitivity Profile

Genomic Location Trend
These plots show the distribution of the DHS sites surrounding the Transcript Start Site of the nearest gene.
Stats
Number of sites: 1719Promoter: 0%
CpG-Island: 0%
Conserved: 77%
Enriched Motifs & Matches
Match Detail: [Jaspar]
|
| ||
|---|---|---|
| Sites: 76/100 | e-val: 0 | ||
| Factor | e-val(match) | DB |
| CTCF | 0.0000000000000014433 | JASPAR |
| INSM1 | 0.0014983 | JASPAR |
| TAL1::TCF3 | 0.0045608 | JASPAR |
| MYC::MAX | 0.0097828 | JASPAR |
| Zfp423 | 0.016888 | JASPAR |
|
| ||
| Sites: 88/100 | e-val: 0 | ||
| Factor | e-val(match) | DB |
| Foxd3 | 0.00041973 | JASPAR |
| MEF2A | 0.0025841 | JASPAR |
| Lhx3 | 0.0026381 | JASPAR |
| HNF1B | 0.0063012 | JASPAR |
| HNF1A | 0.0082225 | JASPAR |
|
| ||
| Sites: 38/100 | e-val: 0.000029 | ||
| Factor | e-val(match) | DB |
| FOXA1 | 0.000030162 | JASPAR |
| Foxa2 | 0.00016624 | JASPAR |
| IRF1 | 0.00028224 | JASPAR |
| ARID3A | 0.0011833 | JASPAR |
| HNF1A | 0.0018072 | JASPAR |
BED file downloads
Top 10 Example Regions
| Location | Gene Link | Dist. |
|---|---|---|
| chr9: 110243420-110243570 | KLF4 | 25.69 |
| chr3: 190962140-190962290 | CCDC50 | 34.69 |
| chr1: 152469880-152470030 | RP1-91G5.3 | 39.1 |
| chr1: 152469880-152470030 | LCE3E | 39.1 |
| chr1: 68936180-68936330 | RPE65 | 39.39 |
| chr1: 68936180-68936330 | TCEB1P18 | 39.39 |
| chr2: 150417880-150418030 | RNU6-601P | 41.85 |
| chr7: 140426240-140426390 | NDUFB2 | 42.16 |
| chr12: 44230500-44230650 | TMEM117 | 44.49 |
| chr9: 132196600-132196750 | LINC00963 | 45.66 |