SOM cluster: 2090
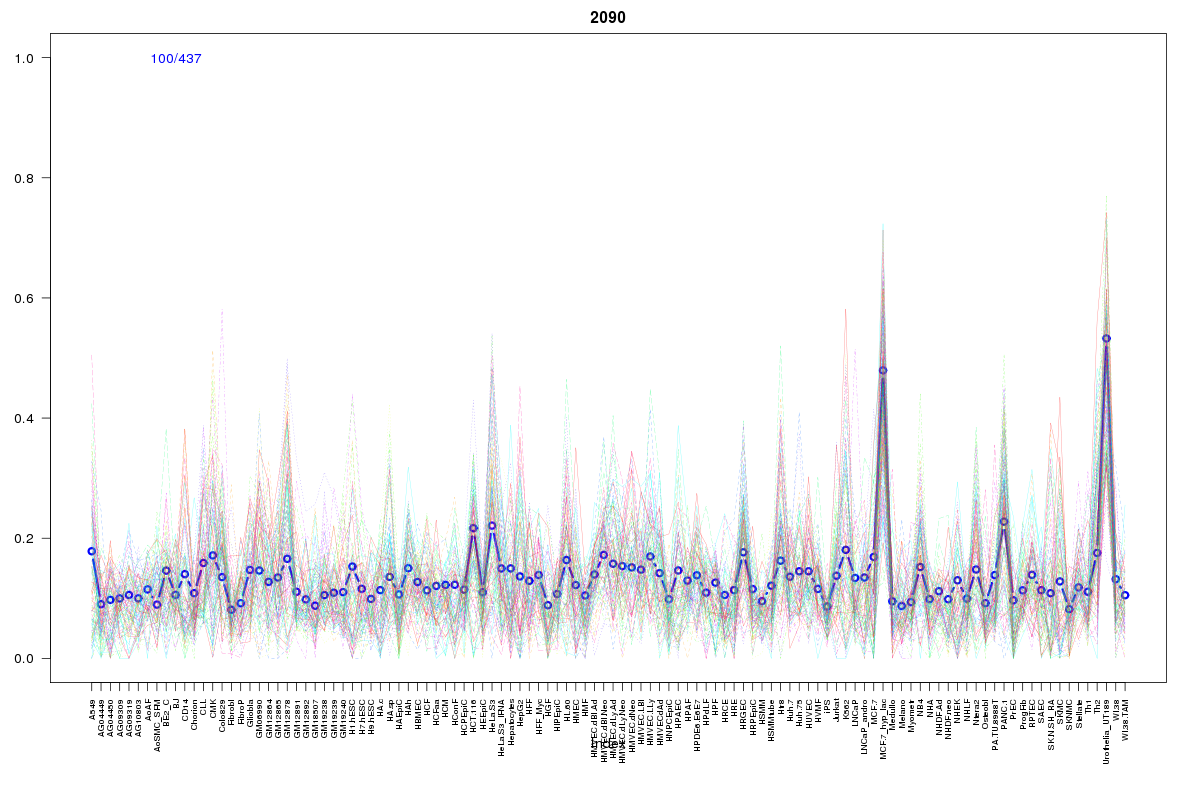
Cluster Hypersensitivity Profile

Genomic Location Trend
These plots show the distribution of the DHS sites surrounding the Transcript Start Site of the nearest gene.
Stats
Number of sites: 437Promoter: 32%
CpG-Island: 10%
Conserved: 30%
Enriched Motifs & Matches
Match Detail: [Jaspar]
|
| ||
|---|---|---|
| Sites: 69/100 | e-val: 1.1e-27 | ||
| Factor | e-val(match) | DB |
| ZNF354C | 0.006192 | JASPAR |
| NFIC | 0.0074661 | JASPAR |
| BRCA1 | 0.014771 | JASPAR |
| NFATC2 | 0.016869 | JASPAR |
| Myb | 0.023612 | JASPAR |
BED file downloads
Top 10 Example Regions
| Location | Gene Link | Dist. |
|---|---|---|
| chr7: 57312225-57312375 | MTND1P4 | 46.34 |
| chr1: 149224945-149225095 | RP11-403I13.9 | 50.21 |
| chr5: 112824460-112824610 | TSSK1B | 54.38 |
| chr17: 56025425-56025695 | VEZF1 | 55.72 |
| chr17: 56025425-56025695 | CUEDC1 | 55.72 |
| chr8: 144814885-144815035 | SCRIB | 56.76 |
| chr8: 144814885-144815035 | FAM83H | 56.76 |
| chr8: 144814885-144815035 | FAM83H-AS1 | 56.76 |
| chr20: 61558465-61558615 | DIDO1 | 57.09 |
| chr20: 61558465-61558615 | GID8 | 57.09 |