SOM cluster: 2104
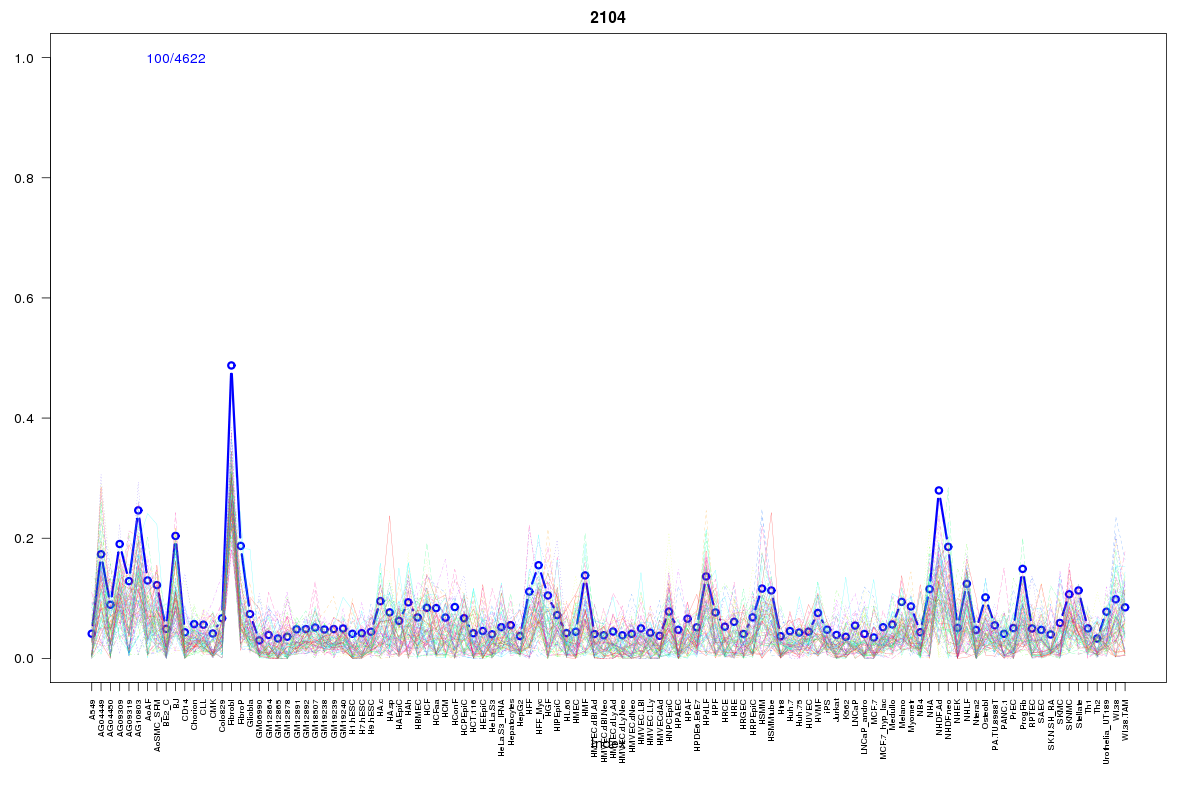
Cluster Hypersensitivity Profile

Genomic Location Trend
These plots show the distribution of the DHS sites surrounding the Transcript Start Site of the nearest gene.
Stats
Number of sites: 4622Promoter: 1%
CpG-Island: 0%
Conserved: 25%
Enriched Motifs & Matches
Match Detail: [Jaspar]
|
| ||
|---|---|---|
| Sites: 29/100 | e-val: 0.00042 | ||
| Factor | e-val(match) | DB |
| HNF1B | 0.000015562 | JASPAR |
| Foxq1 | 0.0010457 | JASPAR |
| Foxd3 | 0.0022722 | JASPAR |
| MEF2A | 0.0029571 | JASPAR |
| HNF1A | 0.0030015 | JASPAR |
BED file downloads
Top 10 Example Regions
| Location | Gene Link | Dist. |
|---|---|---|
| chr1: 150536420-150536570 | MCL1 | 13.02 |
| chr1: 150481225-150481375 | LINC00568 | 16.99 |
| chr12: 2248085-2248235 | CACNA1C | 35.01 |
| chrX: 150094740-150094890 | CD99L2 | 37.52 |
| chr9: 132919460-132919610 | NCS1 | 37.98 |
| chr1: 171633120-171633270 | PRRC2C | 39.66 |
| chr9: 103156705-103156855 | INVS | 39.73 |
| chr20: 31069065-31069215 | ASXL1 | 39.9 |
| chr9: 116362785-116362935 | RGS3 | 42.8 |
| chr17: 35836165-35836315 | TADA2A | 43.21 |