SOM cluster: 1745
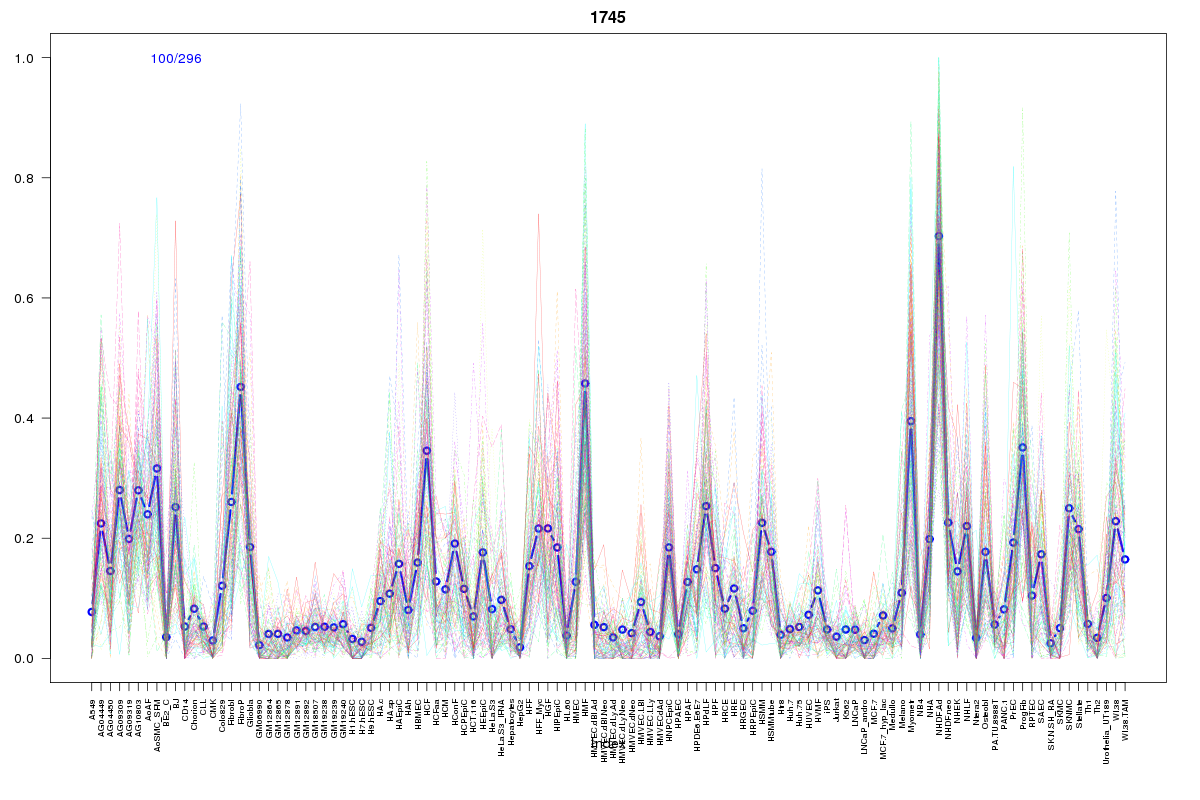
Cluster Hypersensitivity Profile

Genomic Location Trend
These plots show the distribution of the DHS sites surrounding the Transcript Start Site of the nearest gene.
Stats
Number of sites: 296Promoter: 2%
CpG-Island: 0%
Conserved: 31%
Enriched Motifs & Matches
Match Detail: [Jaspar]
|
| ||
|---|---|---|
| Sites: 38/100 | e-val: 0.0000000000000034 | ||
| Factor | e-val(match) | DB |
| AP1 | 0.000000022537 | JASPAR |
| NFE2L2 | 0.0000016613 | JASPAR |
| NFE2L1::MafG | 0.00031441 | JASPAR |
| PPARG | 0.0040981 | JASPAR |
| RXRA::VDR | 0.024444 | JASPAR |
BED file downloads
Top 10 Example Regions
| Location | Gene Link | Dist. |
|---|---|---|
| chr8: 123161820-123161970 | RP11-398G24.2 | 42.91 |
| chr1: 243424800-243424950 | CEP170 | 49.57 |
| chr1: 243424800-243424950 | SDCCAG8 | 49.57 |
| chr2: 163115340-163115490 | FAP | 55.01 |
| chr2: 163115340-163115490 | GCA | 55.01 |
| chr9: 116477420-116477570 | RP11-168K11.3 | 55.36 |
| chrX: 118508860-118509010 | SLC25A43 | 56.44 |
| chrX: 48573580-48573730 | HDAC6 | 57.62 |
| chr2: 161166220-161166370 | RBMS1 | 59.37 |
| chr7: 107087080-107087230 | COG5 | 59.66 |