SOM cluster: 41
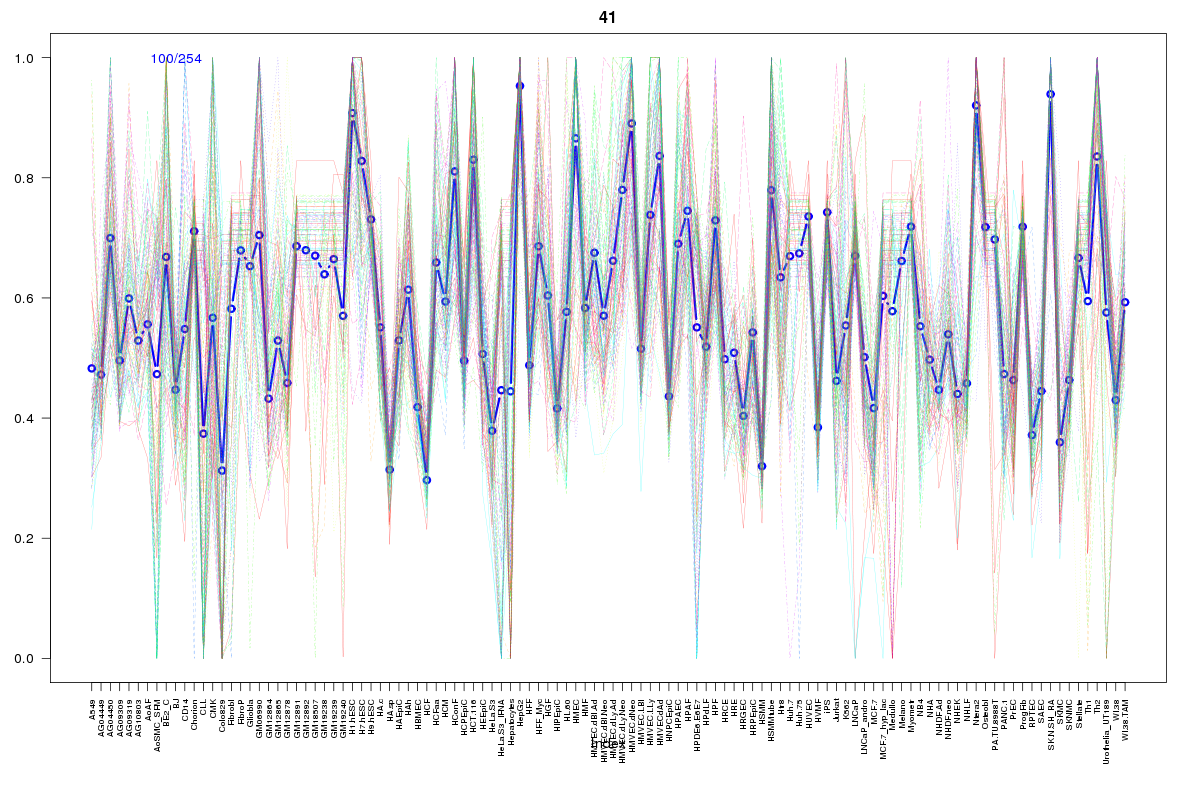
Cluster Hypersensitivity Profile

Genomic Location Trend
These plots show the distribution of the DHS sites surrounding the Transcript Start Site of the nearest gene.
Stats
Number of sites: 254Promoter: 62%
CpG-Island: 83%
Conserved: 81%
Enriched Motifs & Matches
Match Detail: [Jaspar]
|
| ||
|---|---|---|
| Sites: 95/100 | e-val: 0 | ||
| Factor | e-val(match) | DB |
| SP1 | 0.000020352 | JASPAR |
| TFAP2A | 0.00024017 | JASPAR |
| PLAG1 | 0.011005 | JASPAR |
| NHLH1 | 0.023324 | JASPAR |
| Klf4 | 0.030074 | JASPAR |
|
| ||
| Sites: 74/100 | e-val: 1.3e-37 | ||
| Factor | e-val(match) | DB |
| TFAP2A | 0.00066809 | JASPAR |
| CTCF | 0.002446 | JASPAR |
| SP1 | 0.0024837 | JASPAR |
| Egr1 | 0.0073419 | JASPAR |
| NHLH1 | 0.024075 | JASPAR |
|
| ||
| Sites: 67/100 | e-val: 1.8e-17 | ||
| Factor | e-val(match) | DB |
| PLAG1 | 0.0000037389 | JASPAR |
| SP1 | 0.0000087994 | JASPAR |
| TFAP2A | 0.000057849 | JASPAR |
| Klf4 | 0.010075 | JASPAR |
| Egr1 | 0.034968 | JASPAR |
BED file downloads
Top 10 Example Regions
| Location | Gene Link | Dist. |
|---|---|---|
| chr1: 954940-955090 | SAMD11 | 46.68 |
| chr3: 169386980-169387130 | ACTRT3 | 49.49 |
| chr9: 22008680-22008830 | CDKN2B-AS1 | 52.86 |
| chr9: 22008680-22008830 | C9orf53 | 52.86 |
| chr5: 16936500-16936650 | MYO10 | 56.27 |
| chr4: 47838720-47838870 | CORIN | 57.51 |
| chr1: 54955100-54955250 | RP4-705F19.1 | 58.01 |
| chr8: 22446640-22446790 | PPP3CC | 58.24 |
| chr8: 22446640-22446790 | BIN3 | 58.24 |
| chr1: 856540-856690 | RP11-54O7.11 | 58.54 |