SOM cluster: 1023
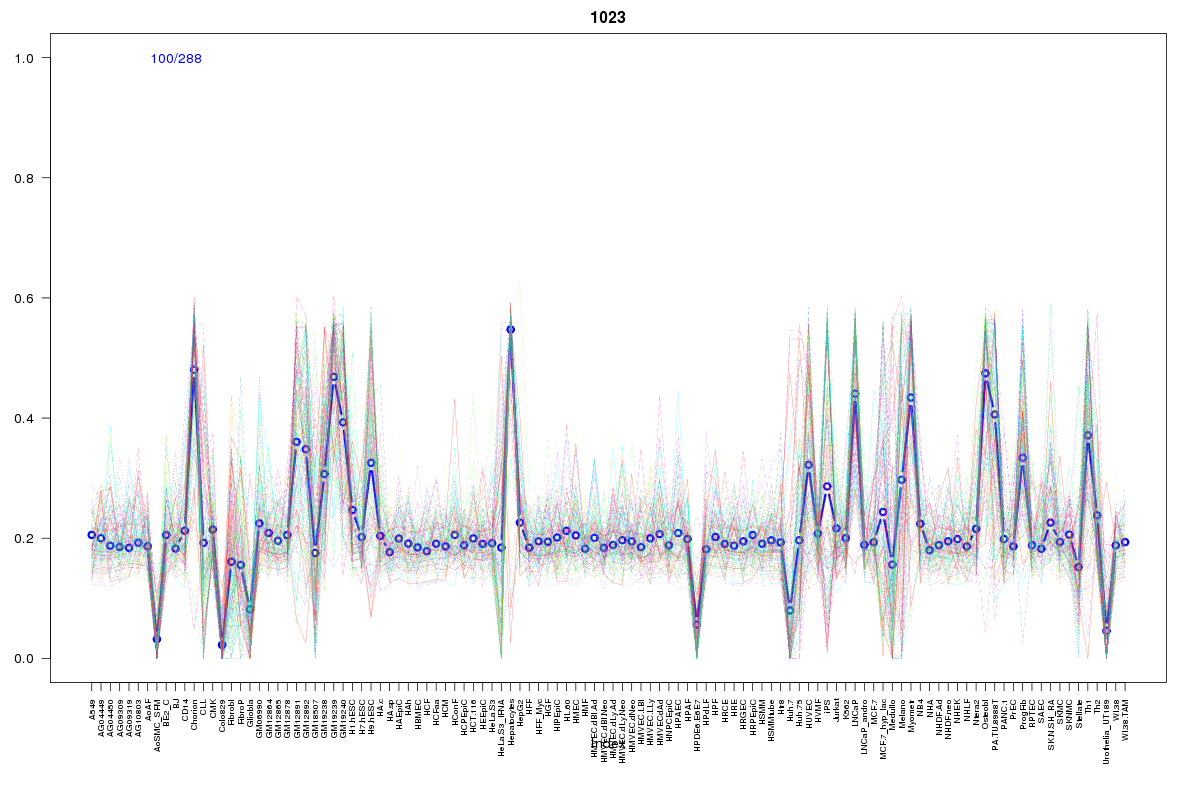
Cluster Hypersensitivity Profile

Genomic Location Trend
These plots show the distribution of the DHS sites surrounding the Transcript Start Site of the nearest gene.
Stats
Number of sites: 288Promoter: 6%
CpG-Island: 16%
Conserved: 26%
Enriched Motifs & Matches
No motifs found.BED file downloads
Top 10 Example Regions
| Location | Gene Link | Dist. |
|---|---|---|
| chrX: 152487085-152487235 | MAGEA1 | 43.34 |
| chr7: 48084565-48084715 | SUN3 | 46.5 |
| chr7: 48084565-48084715 | C7orf57 | 46.5 |
| chr19: 22990425-22990575 | CTC-451A6.4 | 59.91 |
| chr19: 22990425-22990575 | ZNF99 | 59.91 |
| chr10: 106406525-106406675 | SORCS3-AS1 | 61.23 |
| chr1: 1154405-1154775 | MIR200A | 65.53 |
| chr1: 1154405-1154775 | RP11-465B22.5 | 65.53 |
| chr16: 89641665-89641815 | DPEP1 | 68.94 |
| chr7: 70316465-70316615 | AUTS2 | 72.46 |