SOM cluster: 348
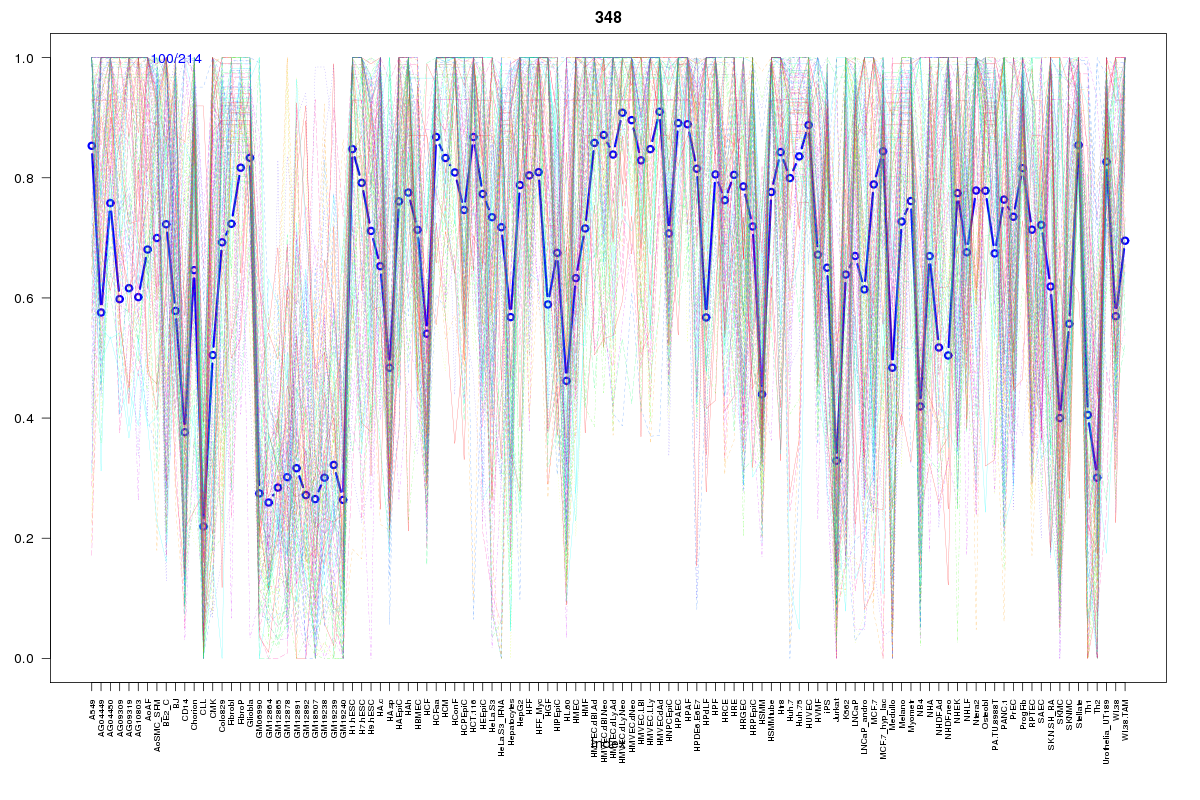
Cluster Hypersensitivity Profile

Genomic Location Trend
These plots show the distribution of the DHS sites surrounding the Transcript Start Site of the nearest gene.
Stats
Number of sites: 214Promoter: 53%
CpG-Island: 56%
Conserved: 87%
Enriched Motifs & Matches
Match Detail: [Jaspar]
|
| ||
|---|---|---|
| Sites: 92/100 | e-val: 0 | ||
| Factor | e-val(match) | DB |
| SP1 | 0.0000000013461 | JASPAR |
| TFAP2A | 0.00022042 | JASPAR |
| Egr1 | 0.00072791 | JASPAR |
| Klf4 | 0.0029253 | JASPAR |
| PLAG1 | 0.0031602 | JASPAR |
|
| ||
| Sites: 42/100 | e-val: 0.000028 | ||
| Factor | e-val(match) | DB |
| SP1 | 0.0017248 | JASPAR |
| PLAG1 | 0.008382 | JASPAR |
| EWSR1-FLI1 | 0.010229 | JASPAR |
| Zfp423 | 0.021684 | JASPAR |
| Zfx | 0.027133 | JASPAR |
BED file downloads
Top 10 Example Regions
| Location | Gene Link | Dist. |
|---|---|---|
| chr2: 28613100-28613250 | FOSL2 | 39.04 |
| chr3: 61547100-61547250 | PTPRG | 45.72 |
| chr9: 131495660-131495810 | VTI1BP4 | 48.6 |
| chr9: 131495660-131495810 | PKN3 | 48.6 |
| chr19: 52192240-52192390 | SIGLEC14 | 49.09 |
| chr19: 52192240-52192390 | SIGLEC5 | 49.09 |
| chr19: 52192240-52192390 | FPR2 | 49.09 |
| chr19: 52192240-52192390 | MIRLET7E | 49.09 |
| chr1: 204042160-204042310 | SOX13 | 49.3 |
| chr1: 204042160-204042310 | ETNK2 | 49.3 |