SOM cluster: 1872
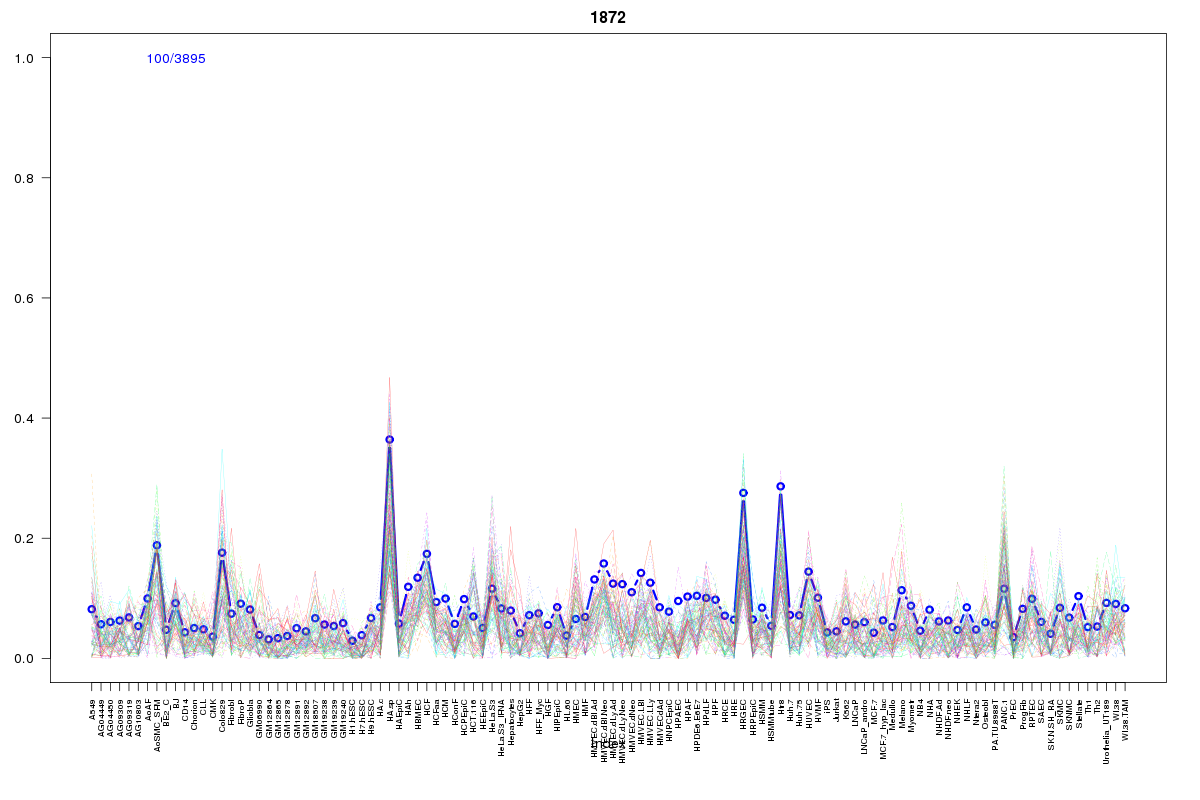
Cluster Hypersensitivity Profile

Genomic Location Trend
These plots show the distribution of the DHS sites surrounding the Transcript Start Site of the nearest gene.
Stats
Number of sites: 3895Promoter: 5%
CpG-Island: 0%
Conserved: 25%
Enriched Motifs & Matches
Match Detail: [Jaspar]
|
| ||
|---|---|---|
| Sites: 94/100 | e-val: 0 | ||
| Factor | e-val(match) | DB |
| Lhx3 | 0.00065419 | JASPAR |
| FOXI1 | 0.0011099 | JASPAR |
| Foxd3 | 0.0016385 | JASPAR |
| MEF2A | 0.0026637 | JASPAR |
| FOXA1 | 0.0031115 | JASPAR |
|
| ||
| Sites: 54/100 | e-val: 0.0000011 | ||
| Factor | e-val(match) | DB |
| MEF2A | 0.000031865 | JASPAR |
| Foxq1 | 0.0032101 | JASPAR |
| Pax4 | 0.0032411 | JASPAR |
| Foxd3 | 0.003565 | JASPAR |
| Pdx1 | 0.0049609 | JASPAR |
|
| ||
| Sites: 23/100 | e-val: 0.17 | ||
| Factor | e-val(match) | DB |
| NKX3-1 | 0.0014652 | JASPAR |
| FOXD1 | 0.0062172 | JASPAR |
| NR3C1 | 0.0071778 | JASPAR |
| FOXO3 | 0.0087824 | JASPAR |
| Foxa2 | 0.01061 | JASPAR |
BED file downloads
Top 10 Example Regions
| Location | Gene Link | Dist. |
|---|---|---|
| chr1: 147012460-147012610 | BCL9 | 12.95 |
| chr15: 96892620-96892770 | NR2F2-AS1 | 35.16 |
| chr12: 86229580-86229730 | RASSF9 | 35.44 |
| chr4: 186990360-186990510 | TLR3 | 35.92 |
| chr8: 40029380-40029530 | RP11-359E19.2 | 36.85 |
| chr8: 40029380-40029530 | RP11-470M17.2 | 36.85 |
| chr3: 161134105-161134255 | EEF1GP4 | 38.84 |
| chr3: 161134105-161134255 | PSMC1P7 | 38.84 |
| chr1: 198124280-198124430 | RP11-401A10.2 | 43.21 |
| chr8: 6405620-6405770 | ANGPT2 | 43.46 |