SOM cluster: 695
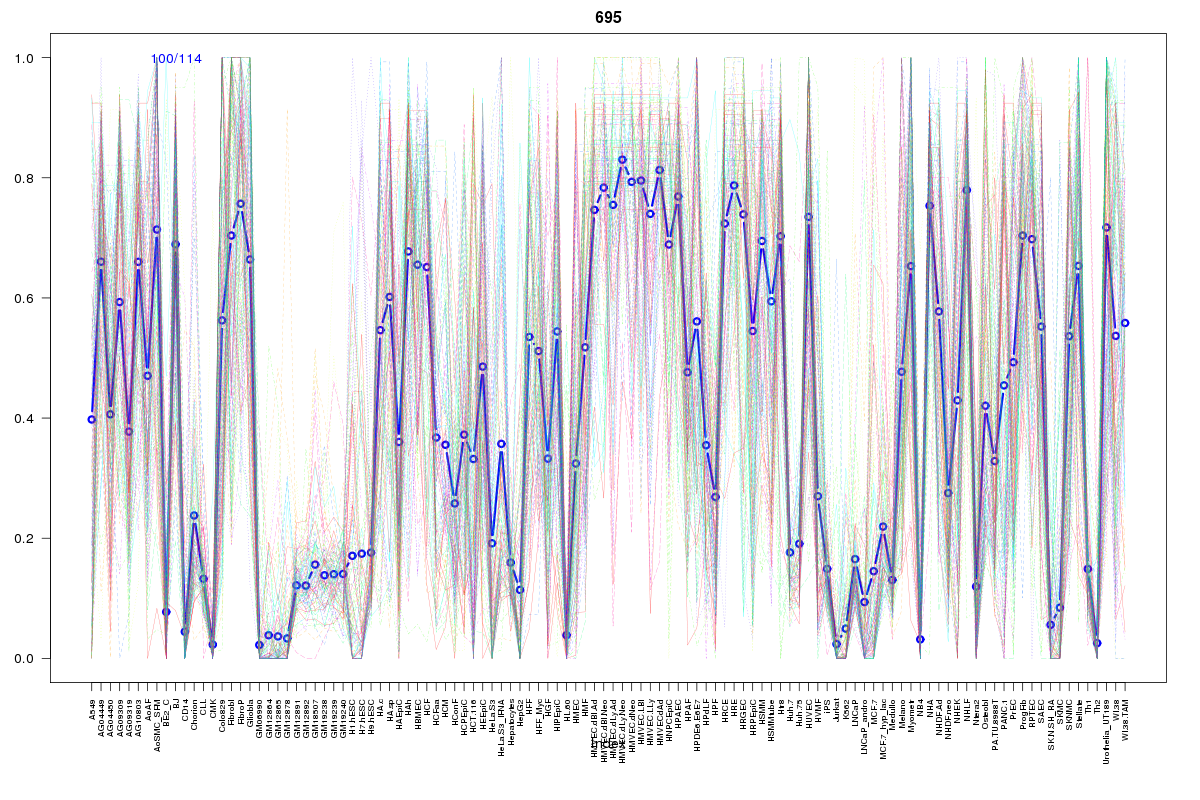
Cluster Hypersensitivity Profile

Genomic Location Trend
These plots show the distribution of the DHS sites surrounding the Transcript Start Site of the nearest gene.
Stats
Number of sites: 114Promoter: 4%
CpG-Island: 1%
Conserved: 52%
Enriched Motifs & Matches
Match Detail: [Jaspar]
|
| ||
|---|---|---|
| Sites: 52/100 | e-val: 3.5e-24 | ||
| Factor | e-val(match) | DB |
| AP1 | 0.0000000015413 | JASPAR |
| NFE2L2 | 0.0000000037726 | JASPAR |
| NFE2L1::MafG | 0.00072487 | JASPAR |
| PBX1 | 0.0056782 | JASPAR |
| Pax2 | 0.018137 | JASPAR |
|
| ||
| Sites: 20/100 | e-val: 0.84 | ||
| Factor | e-val(match) | DB |
| FEV | 0.000002101 | JASPAR |
| NR3C1 | 0.0015906 | JASPAR |
| SPI1 | 0.0023588 | JASPAR |
| ELF5 | 0.0029326 | JASPAR |
| NR4A2 | 0.0039854 | JASPAR |
BED file downloads
Top 10 Example Regions
| Location | Gene Link | Dist. |
|---|---|---|
| chr10: 11077380-11077530 | RP11-397O4.1 | 38.51 |
| chr13: 99630680-99630830 | DOCK9 | 38.97 |
| chr9: 72513760-72513910 | C9orf135 | 39.29 |
| chr9: 72513760-72513910 | C9orf135-AS1 | 39.29 |
| chr8: 130697845-130697995 | RP11-419K12.1 | 45.32 |
| chr8: 130697845-130697995 | CCDC26 | 45.32 |
| chr17: 71288420-71288570 | COG1 | 46.49 |
| chr17: 71288420-71288570 | CPSF4L | 46.49 |
| chr17: 71288420-71288570 | SDK2 | 46.49 |
| chr5: 111084080-111084230 | RN7SKP57 | 56.66 |