SOM cluster: 1647
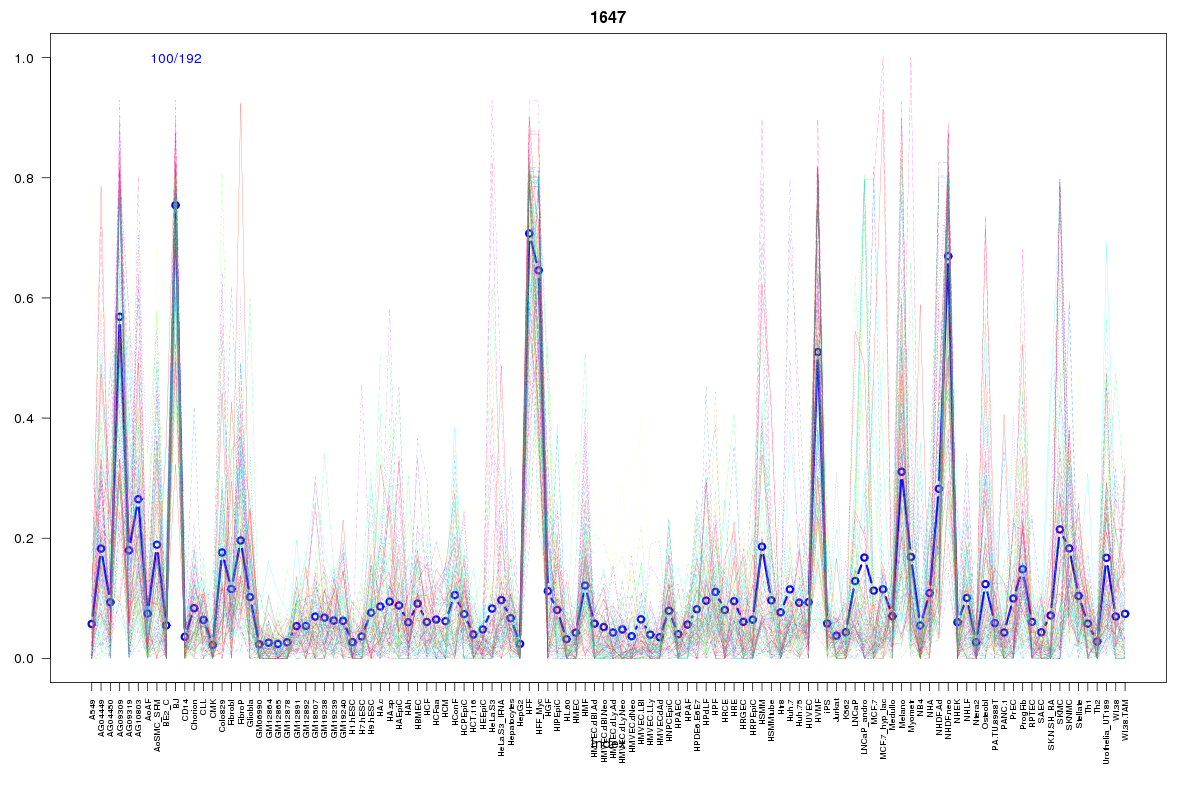
Cluster Hypersensitivity Profile

Genomic Location Trend
These plots show the distribution of the DHS sites surrounding the Transcript Start Site of the nearest gene.
Stats
Number of sites: 192Promoter: 1%
CpG-Island: 0%
Conserved: 56%
Enriched Motifs & Matches
Match Detail: [Jaspar]
|
| ||
|---|---|---|
| Sites: 47/100 | e-val: 0.0000012 | ||
| Factor | e-val(match) | DB |
| Foxq1 | 0.000015819 | JASPAR |
| Foxd3 | 0.00014406 | JASPAR |
| HNF1B | 0.00026472 | JASPAR |
| HNF1A | 0.00080567 | JASPAR |
| MEF2A | 0.0010281 | JASPAR |
BED file downloads
Top 10 Example Regions
| Location | Gene Link | Dist. |
|---|---|---|
| chr2: 100672980-100673130 | AFF3 | 41.32 |
| chr1: 171264560-171264710 | FMO4 | 52.02 |
| chr10: 101039365-101039515 | CNNM1 | 56.75 |
| chr20: 13323205-13323355 | RP5-1077I2.3 | 75.04 |
| chr20: 13323205-13323355 | ISM1 | 75.04 |
| chr3: 155031120-155031270 | RP11-451G4.3 | 75.94 |
| chr16: 71071980-71072130 | HYDIN | 75.95 |
| chr21: 45614140-45614290 | TRAPPC10 | 76.84 |
| chr3: 77461200-77461350 | ROBO2 | 79.09 |
| chr17: 14132320-14132470 | COX10 | 83.02 |