SOM cluster: 590
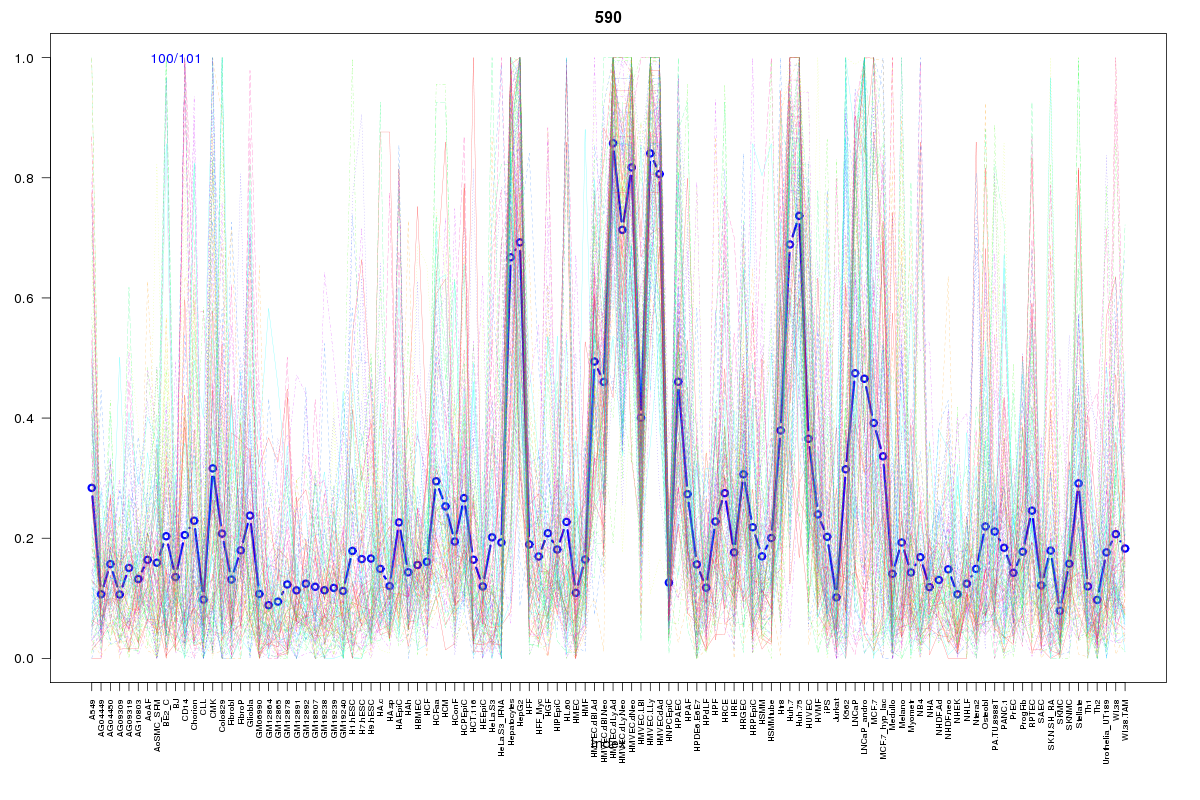
Cluster Hypersensitivity Profile

Genomic Location Trend
These plots show the distribution of the DHS sites surrounding the Transcript Start Site of the nearest gene.
Stats
Number of sites: 101Promoter: 9%
CpG-Island: 9%
Conserved: 49%
Enriched Motifs & Matches
Match Detail: [Jaspar]
|
| ||
|---|---|---|
| Sites: 21/100 | e-val: 0.0000000029 | ||
| Factor | e-val(match) | DB |
| TP53 | 0.00017981 | JASPAR |
| REST | 0.0097672 | JASPAR |
| SP1 | 0.016544 | JASPAR |
| NFIC | 0.073066 | JASPAR |
| Hand1::Tcfe2a | 0.081451 | JASPAR |
|
| ||
| Sites: 31/100 | e-val: 0.00000011 | ||
| Factor | e-val(match) | DB |
| Pax4 | 0.0000000081479 | JASPAR |
| SP1 | 0.000000086347 | JASPAR |
| PLAG1 | 0.000038298 | JASPAR |
| RREB1 | 0.000064686 | JASPAR |
| MZF1_1-4 | 0.0034509 | JASPAR |
BED file downloads
Top 10 Example Regions
| Location | Gene Link | Dist. |
|---|---|---|
| chr19: 35485940-35486090 | GRAMD1A | 49.46 |
| chr19: 35485940-35486090 | SCN1B | 49.46 |
| chr19: 35485940-35486090 | ZNF792 | 49.46 |
| chr19: 35532080-35532230 | HPN | 52.31 |
| chr2: 86525880-86526030 | REEP1 | 60.67 |
| chr1: 207985420-207985570 | CD46 | 61.33 |
| chr1: 207985420-207985570 | CD34 | 61.33 |
| chr1: 207985420-207985570 | C1orf132 | 61.33 |
| chr17: 58468340-58468490 | USP32 | 61.92 |
| chr15: 96882665-96882815 | RP11-522B15.3 | 62.58 |