SOM cluster: 1901
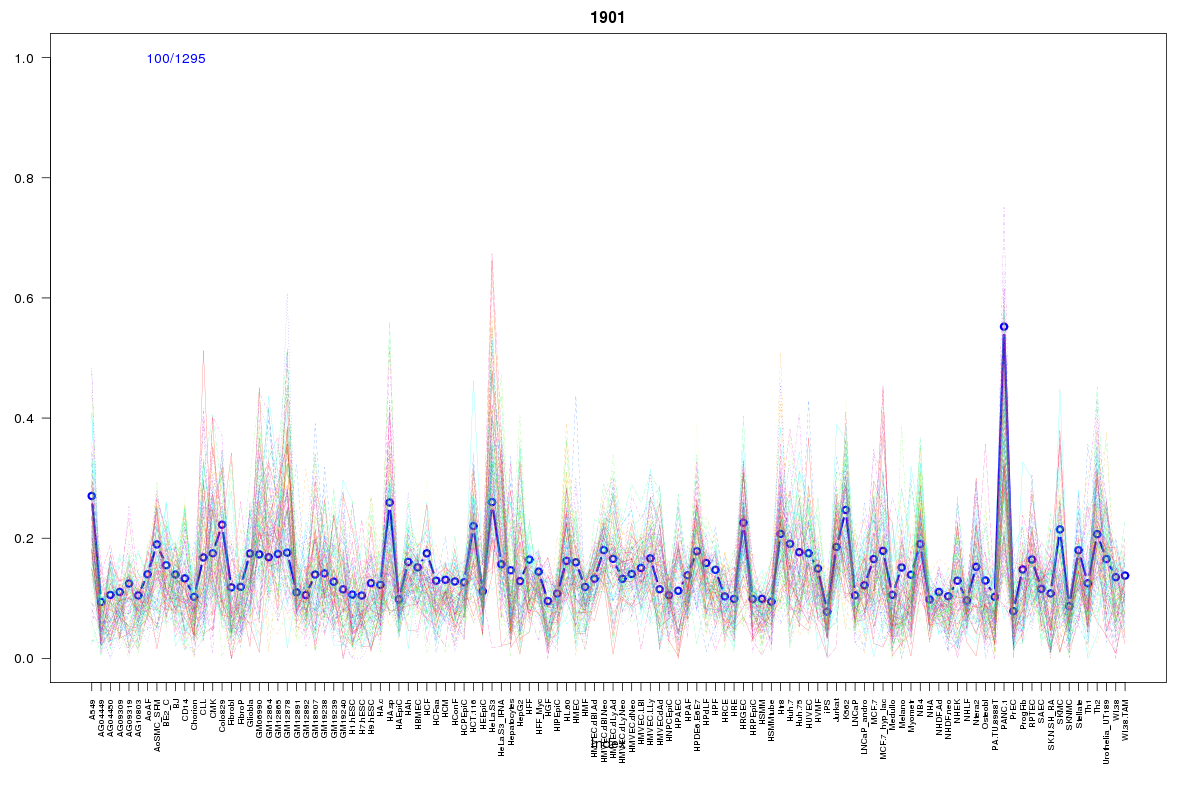
Cluster Hypersensitivity Profile

Genomic Location Trend
These plots show the distribution of the DHS sites surrounding the Transcript Start Site of the nearest gene.
Stats
Number of sites: 1295Promoter: 46%
CpG-Island: 6%
Conserved: 28%
Enriched Motifs & Matches
Match Detail: [Jaspar]
|
| ||
|---|---|---|
| Sites: 19/100 | e-val: 1 | ||
| Factor | e-val(match) | DB |
| EWSR1-FLI1 | 0.0000055744 | JASPAR |
| NFATC2 | 0.000015619 | JASPAR |
| FEV | 0.00035863 | JASPAR |
| SPI1 | 0.0026955 | JASPAR |
| ELF5 | 0.0062993 | JASPAR |
BED file downloads
Top 10 Example Regions
| Location | Gene Link | Dist. |
|---|---|---|
| chr1: 145574865-145575015 | LIX1L | 16.51 |
| chr1: 145574865-145575015 | RBM8A | 16.51 |
| chr1: 145574865-145575015 | ITGA10 | 16.51 |
| chr1: 151019845-151019995 | C1orf56 | 22.26 |
| chr1: 151019845-151019995 | PRUNE | 22.26 |
| chr1: 202777780-202777930 | RABIF | 29.25 |
| chr1: 202777780-202777930 | SLC25A39P1 | 29.25 |
| chr7: 107203820-107203970 | COG5 | 37.73 |
| chr7: 107203820-107203970 | BANF1P5 | 37.73 |
| chr7: 107203820-107203970 | SLC26A4 | 37.73 |