SOM cluster: 86
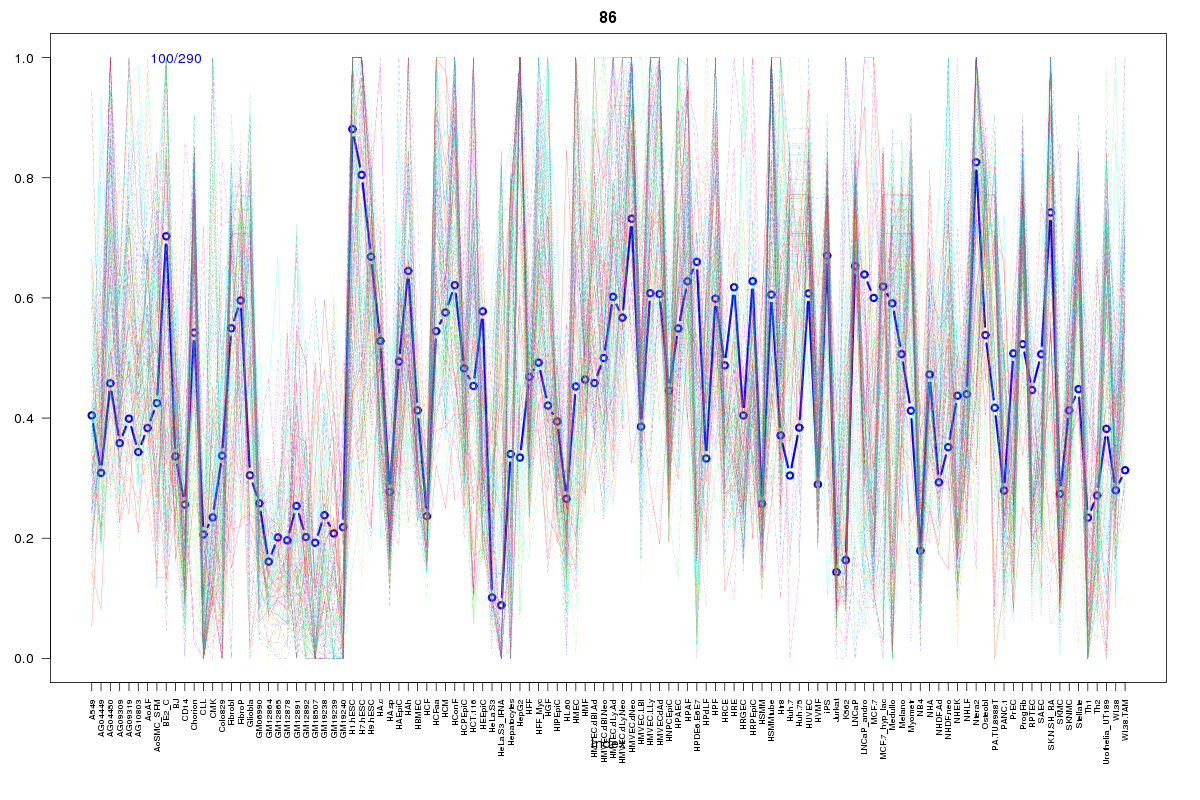
Cluster Hypersensitivity Profile

Genomic Location Trend
These plots show the distribution of the DHS sites surrounding the Transcript Start Site of the nearest gene.
Stats
Number of sites: 290Promoter: 51%
CpG-Island: 71%
Conserved: 82%
Enriched Motifs & Matches
Match Detail: [Jaspar]
|
| ||
|---|---|---|
| Sites: 77/100 | e-val: 0 | ||
| Factor | e-val(match) | DB |
| SP1 | 0.000039055 | JASPAR |
| PLAG1 | 0.00028739 | JASPAR |
| TFAP2A | 0.00041017 | JASPAR |
| Egr1 | 0.03065 | JASPAR |
| Klf4 | 0.058049 | JASPAR |
|
| ||
| Sites: 83/100 | e-val: 1.9e-19 | ||
| Factor | e-val(match) | DB |
| SP1 | 0.00008704 | JASPAR |
| MZF1_1-4 | 0.0090412 | JASPAR |
| EWSR1-FLI1 | 0.010991 | JASPAR |
| Zfx | 0.021752 | JASPAR |
| TFAP2A | 0.023352 | JASPAR |
BED file downloads
Top 10 Example Regions
| Location | Gene Link | Dist. |
|---|---|---|
| chr4: 144257340-144257490 | GAB1 | 47.93 |
| chr2: 8819140-8819290 | ID2 | 53.27 |
| chr4: 99578800-99578950 | BTF3P13 | 53.73 |
| chr4: 99578800-99578950 | TSPAN5 | 53.73 |
| chrX: 117861485-117861635 | IL13RA1 | 54.72 |
| chr1: 99127140-99127290 | SNX7 | 55.08 |
| chr1: 110473820-110473970 | CSF1 | 57.57 |
| chr9: 131320900-131321050 | VTI1BP4 | 58.52 |
| chr20: 50179240-50179390 | ATP9A | 59.03 |
| chr6: 39902160-39902310 | MOCS1 | 59.59 |