SOM cluster: 1078
Cluster Hypersensitivity Profile

Genomic Location Trend
These plots show the distribution of the DHS sites surrounding the Transcript Start Site of the nearest gene.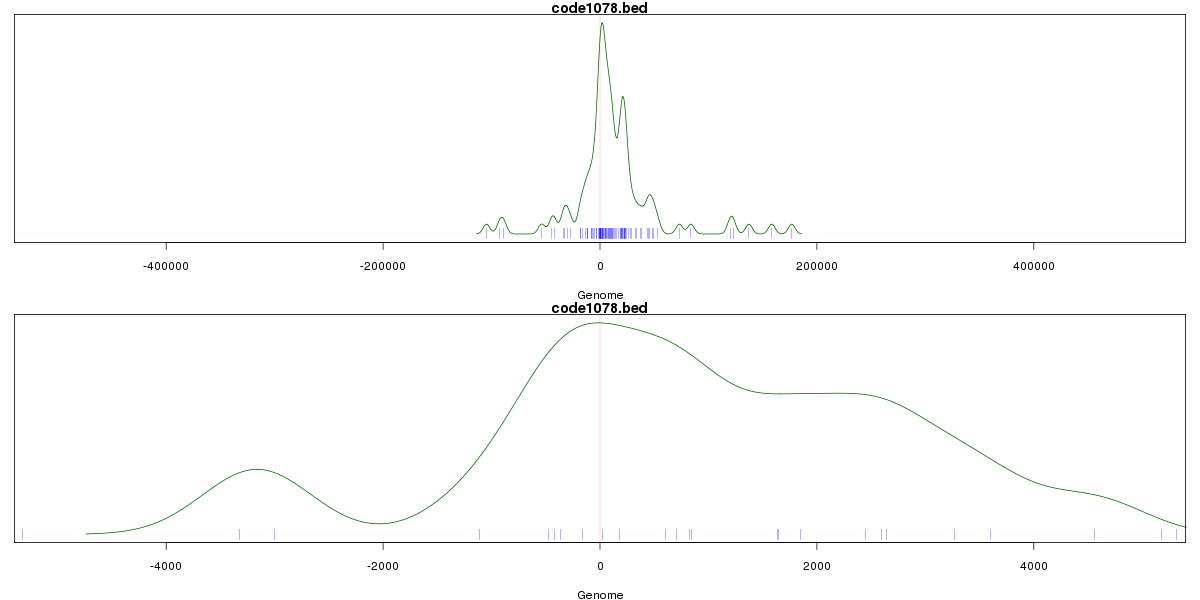
Stats
Number of sites: 13903Promoter: 6%
CpG-Island: 24%
Conserved: 51%
Enriched Motifs & Matches
Match Detail: [Jaspar]
|
| ||
|---|---|---|
| Sites: 99/100 | e-val: 0 | ||
| Factor | e-val(match) | DB |
| SP1 | 0.000013863 | JASPAR |
| EWSR1-FLI1 | 0.00028086 | JASPAR |
| PLAG1 | 0.001309 | JASPAR |
| Pax4 | 0.0026453 | JASPAR |
| RXR::RAR_DR5 | 0.0042615 | JASPAR |
|
| ||
| Sites: 88/100 | e-val: 3.3e-25 | ||
| Factor | e-val(match) | DB |
| NHLH1 | 0.0058246 | JASPAR |
| CTCF | 0.0069796 | JASPAR |
| PLAG1 | 0.012374 | JASPAR |
| Zfp423 | 0.01593 | JASPAR |
| znf143 | 0.021079 | JASPAR |
|
| ||
| Sites: 44/100 | e-val: 0.00000022 | ||
| Factor | e-val(match) | DB |
| TFAP2A | 0.0000025561 | JASPAR |
| PLAG1 | 0.000014882 | JASPAR |
| SP1 | 0.000048897 | JASPAR |
| Pax4 | 0.014397 | JASPAR |
| INSM1 | 0.022927 | JASPAR |
|
| ||
| Sites: 44/100 | e-val: 0.00047 | ||
| Factor | e-val(match) | DB |
| Myf | 0.0048885 | JASPAR |
| Zfx | 0.006783 | JASPAR |
| SPI1 | 0.027539 | JASPAR |
| MIZF | 0.042261 | JASPAR |
| NHLH1 | 0.044847 | JASPAR |
BED file downloads
Top 10 Example Regions
| Location | Gene Link | Dist. |
|---|---|---|
| chr1: 145473500-145473650 | RBM8A | 13 |
| chr1: 149673685-149673835 | HIST2H2BF | 20.32 |
| chr1: 149673685-149673835 | RP11-196G18.3 | 20.32 |
| chr1: 149673685-149673835 | RP11-196G18.21 | 20.32 |
| chr5: 3595120-3595270 | IRX1 | 27.31 |
| chr5: 3595120-3595270 | CTD-2012M11.3 | 27.31 |
| chr6: 39196485-39196635 | KCNK5 | 32.12 |
| chr9: 139505645-139505795 | EGFL7 | 32.78 |
| chr12: 6933345-6933495 | ENO2 | 33.63 |
| chr12: 6933345-6933495 | RPL13P5 | 33.63 |