Gene: PITRM1
chr10: 3179919-3191591Expression Profile
(log scale)
Graphical Connections
Distribution of linked clusters:
You may find it interesting if many of the connected DHS sites belong to the same cluster.| Cluster Profile | Cluster ID | Number of DHS sites in this cluster |
|---|---|---|
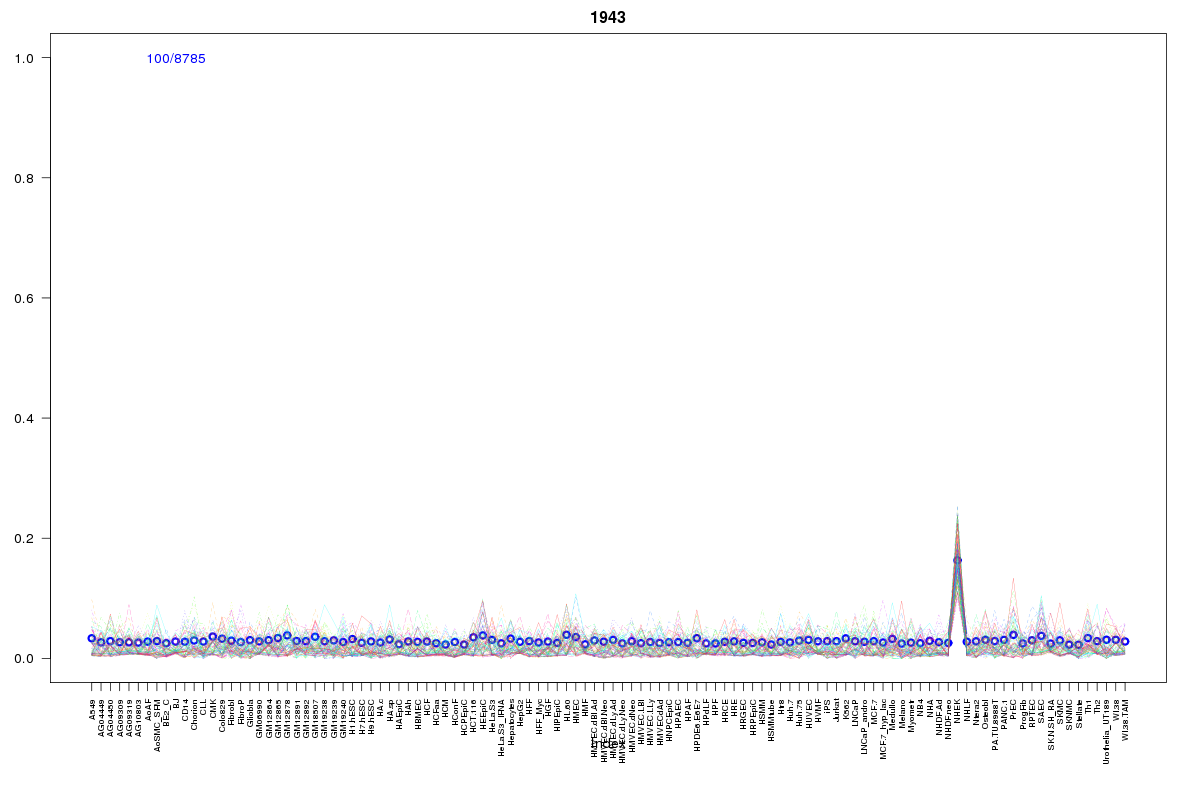 | 1943 | 5 |
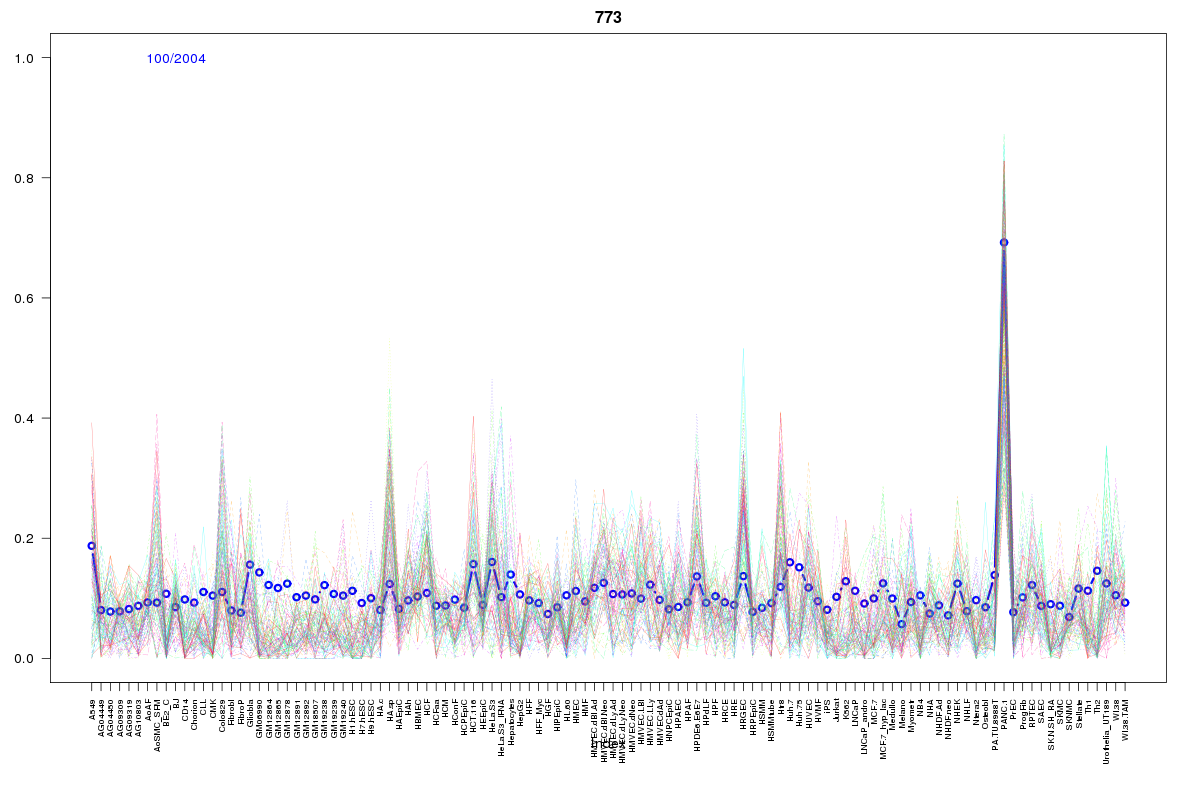 | 773 | 3 |
 | 1078 | 2 |
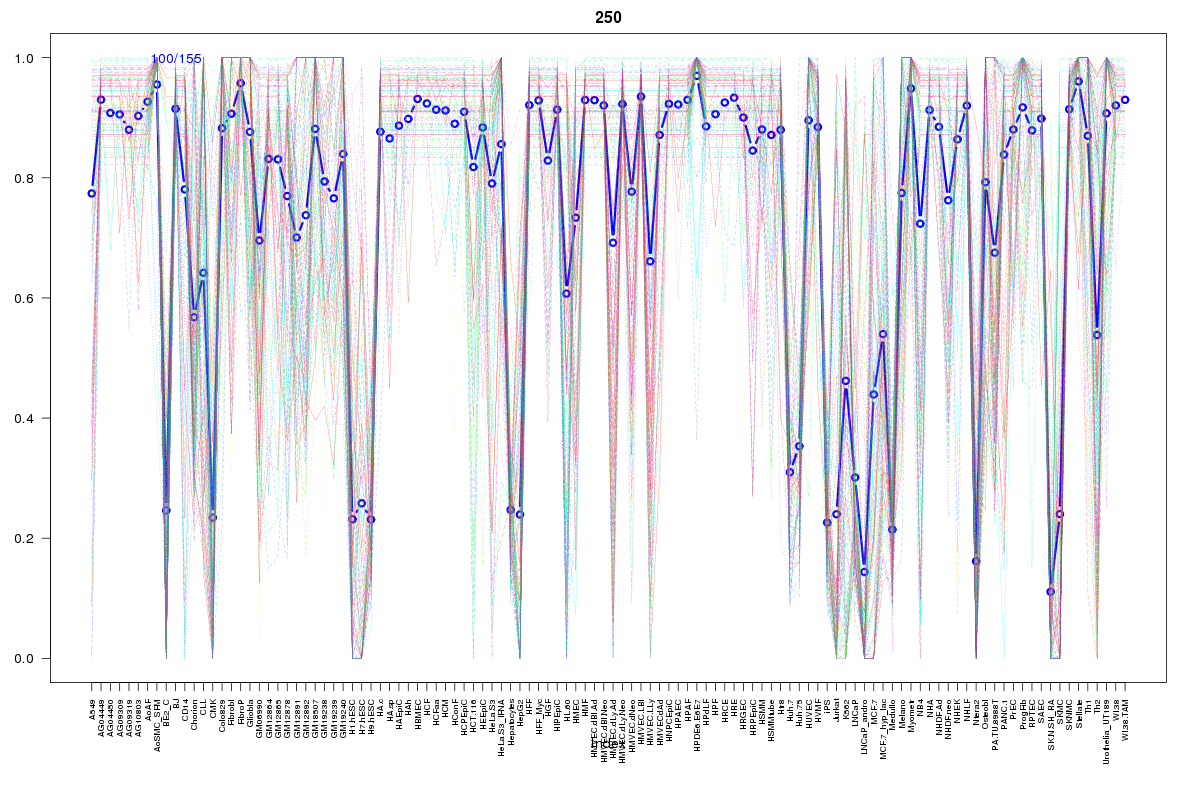 | 250 | 1 |
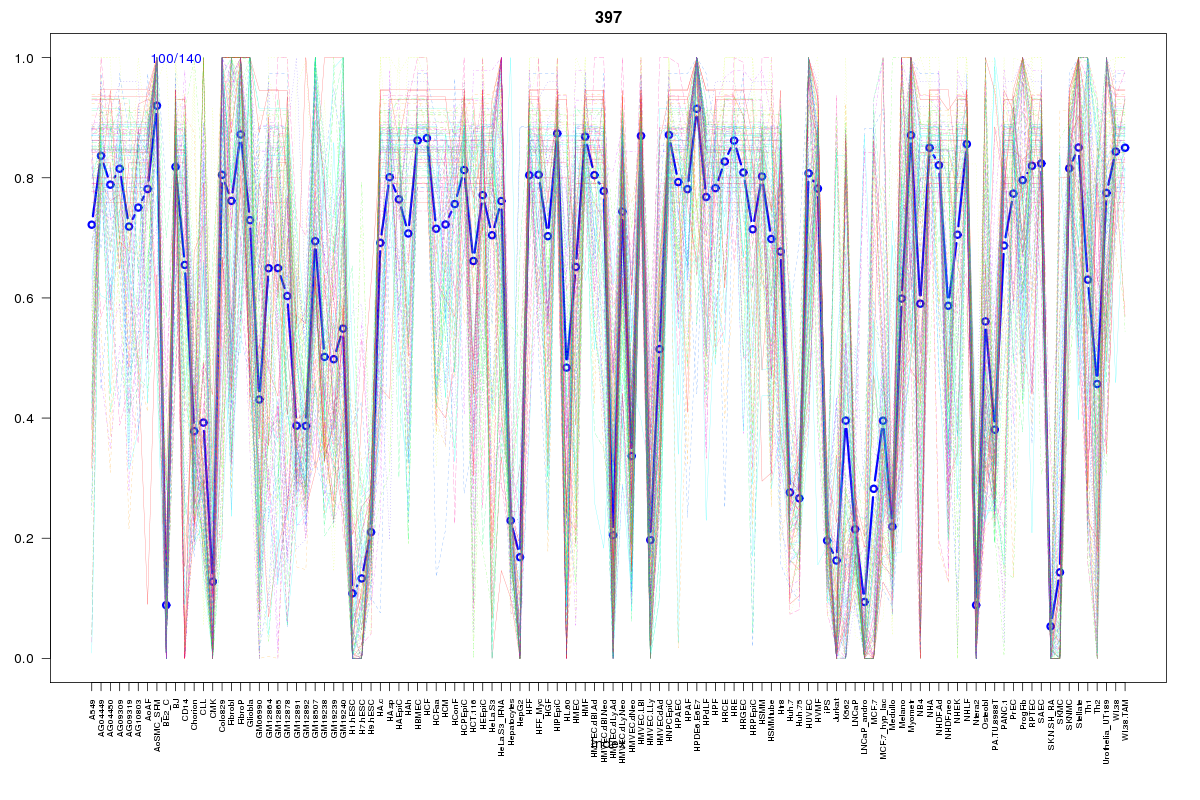 | 397 | 1 |
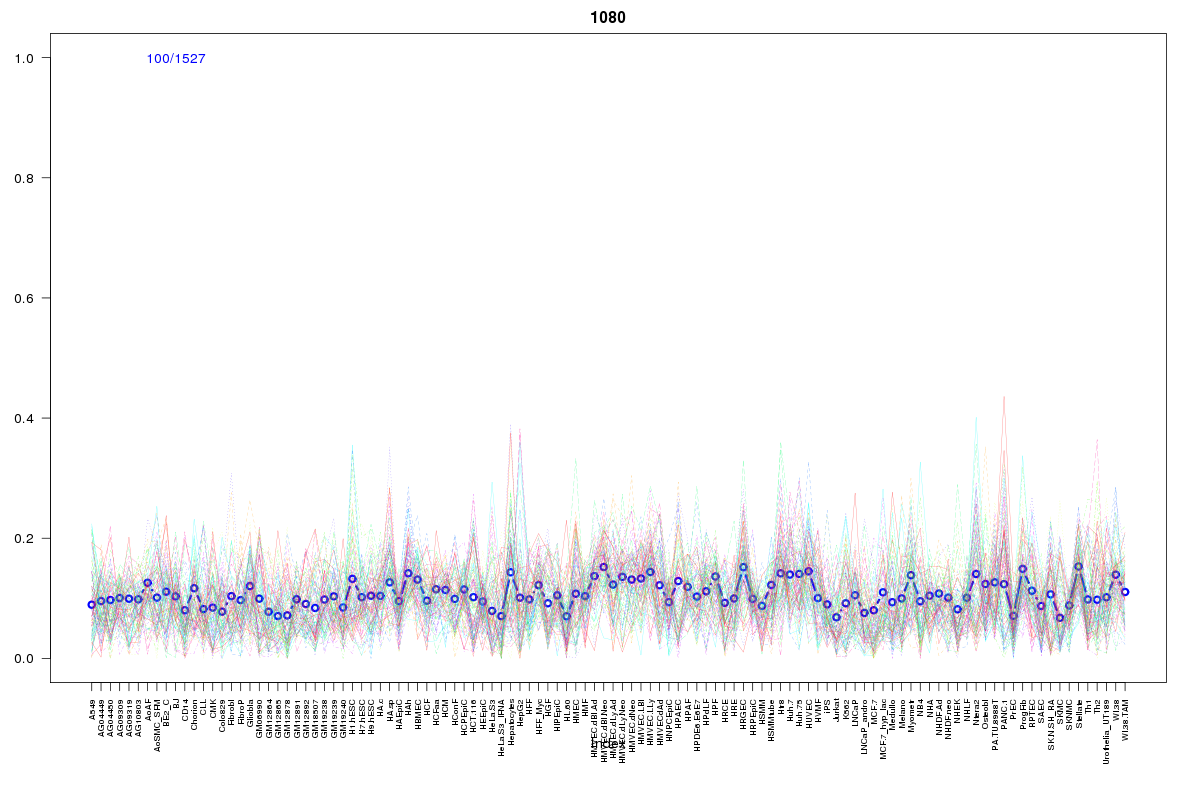 | 1080 | 1 |
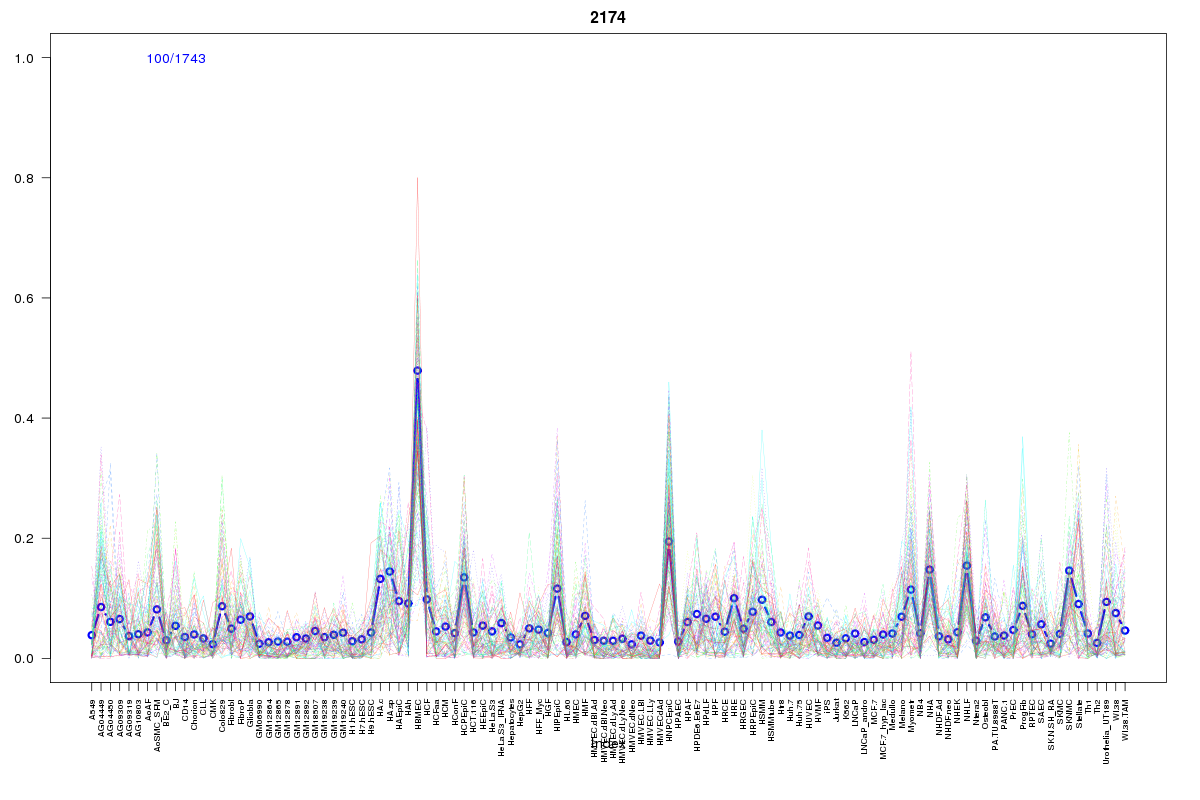 | 2174 | 1 |
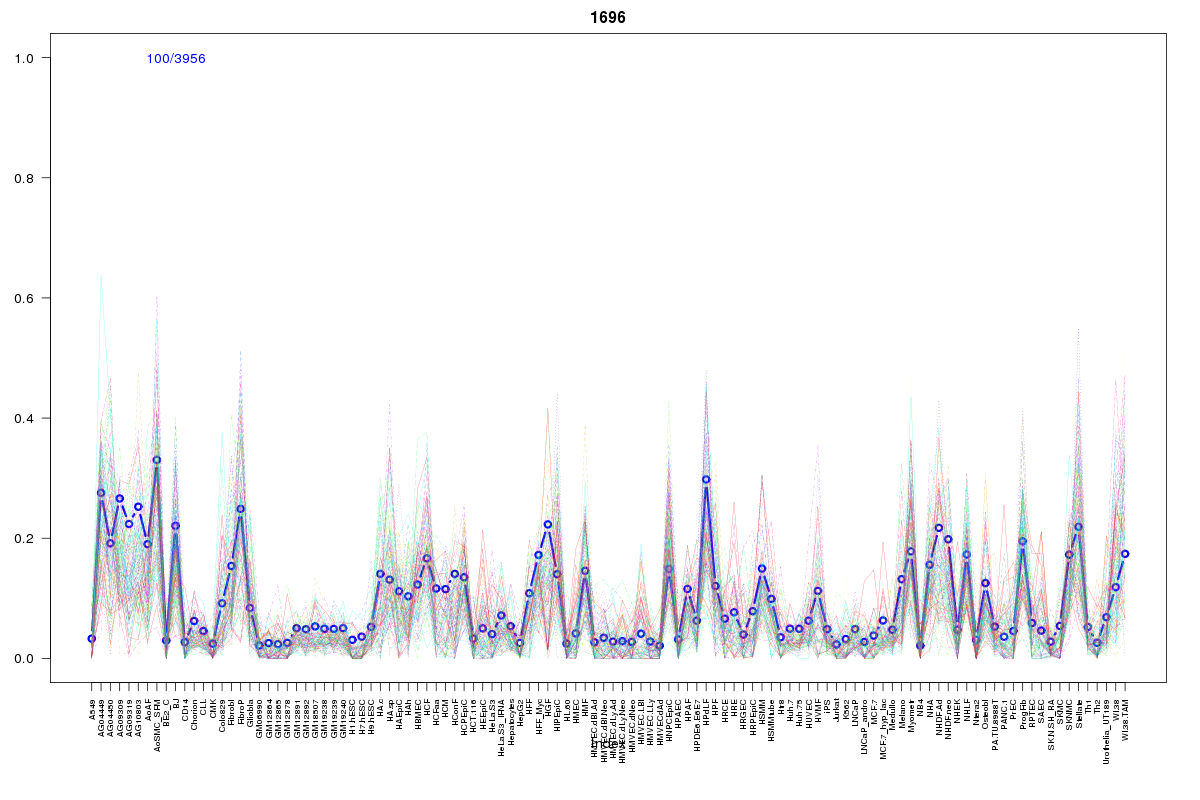 | 1696 | 1 |
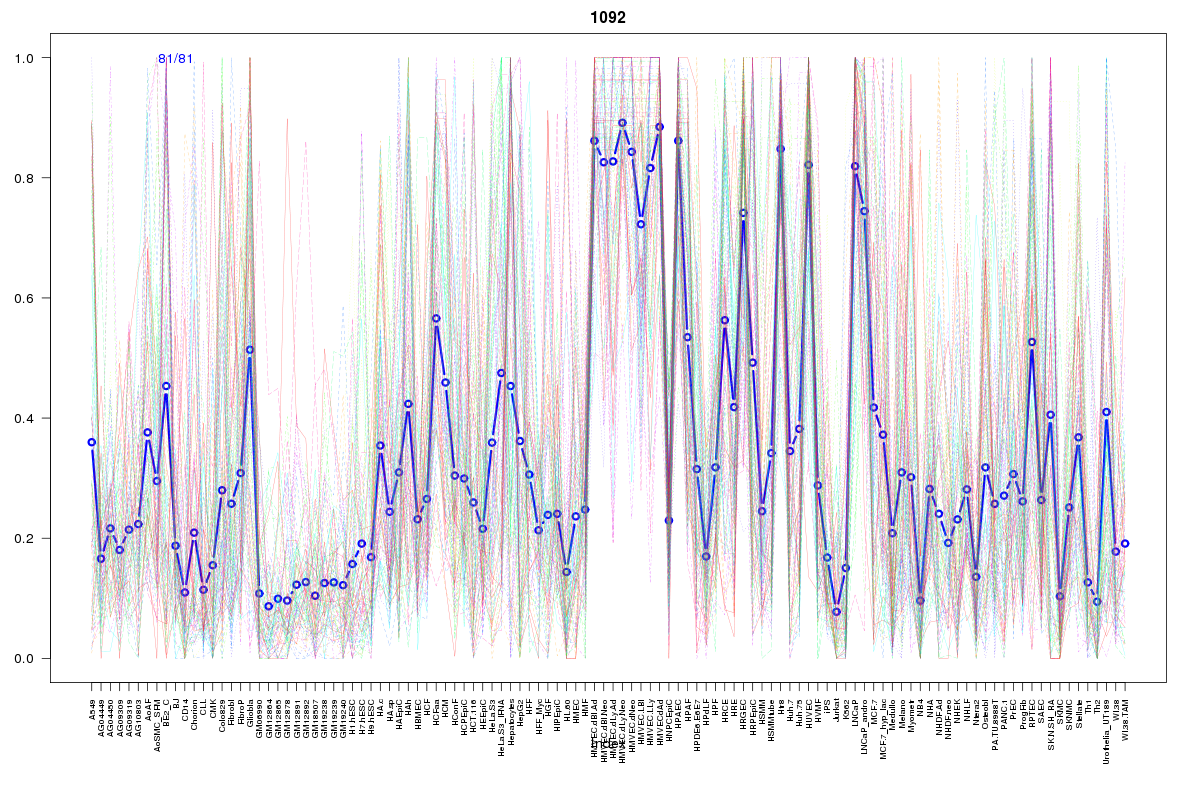 | 1092 | 1 |
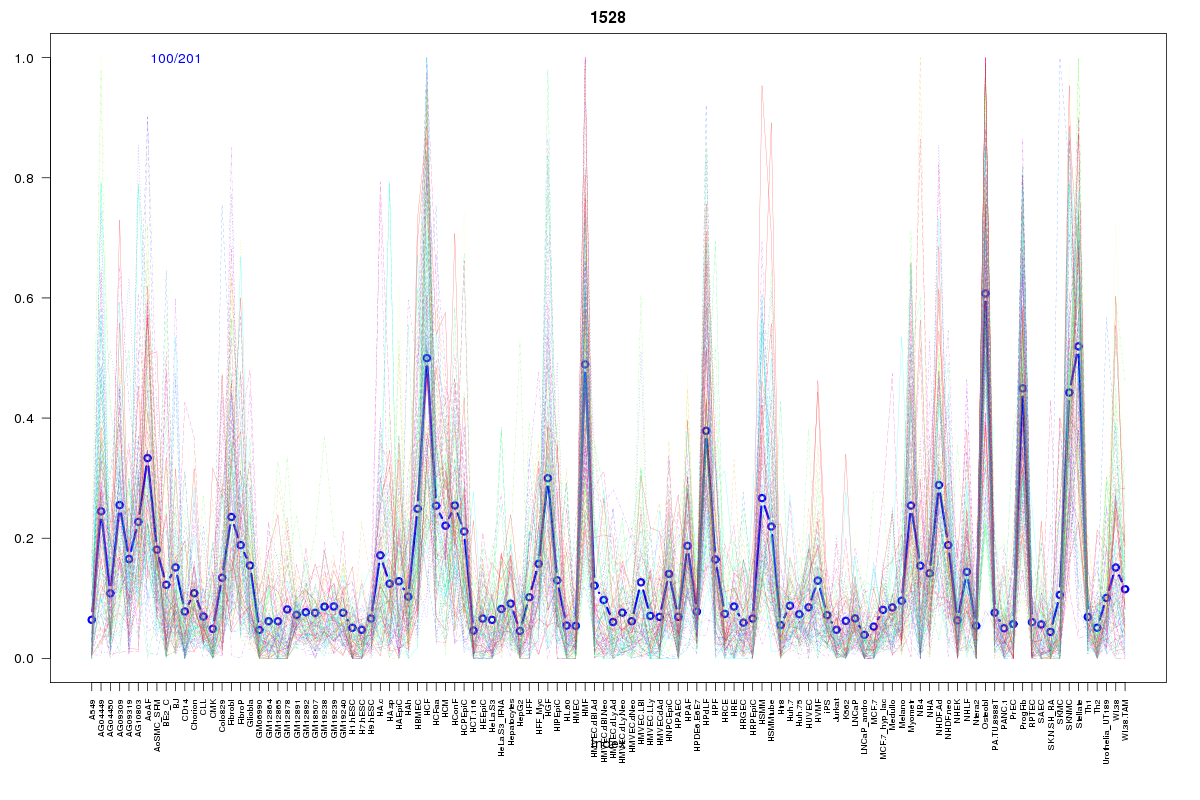 | 1528 | 1 |
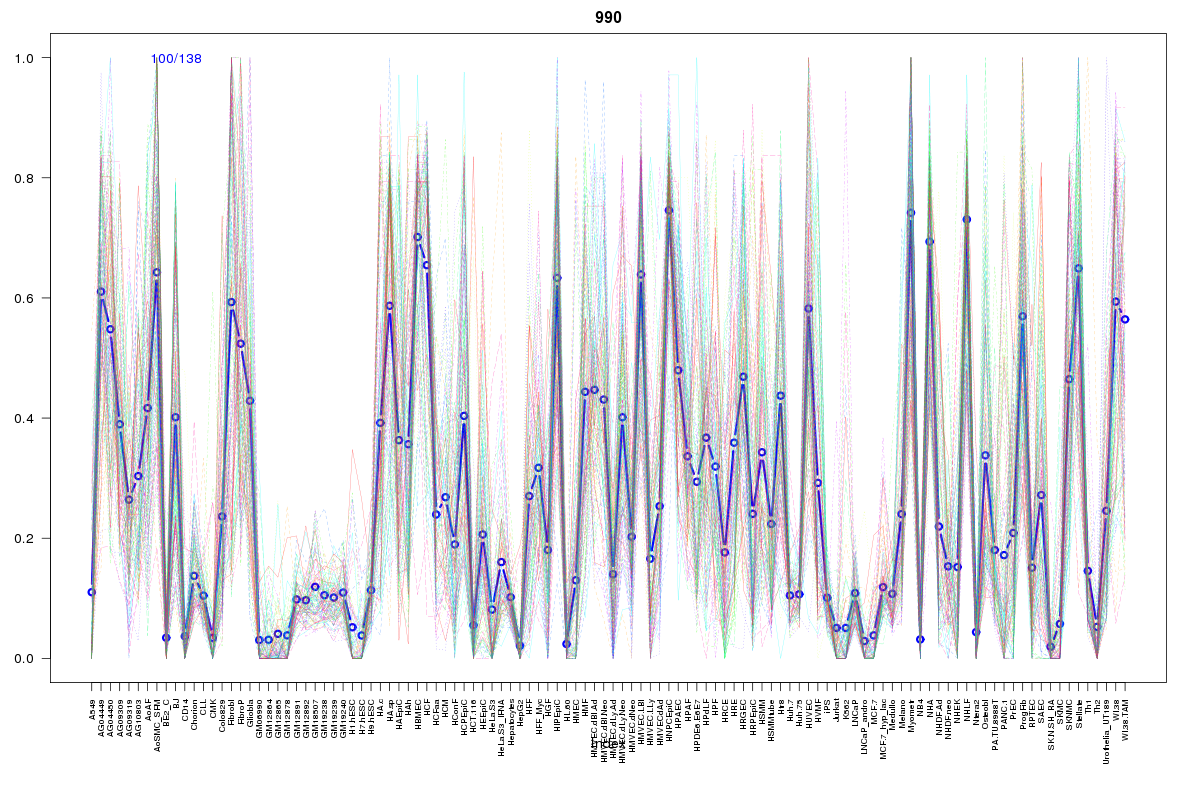 | 990 | 1 |
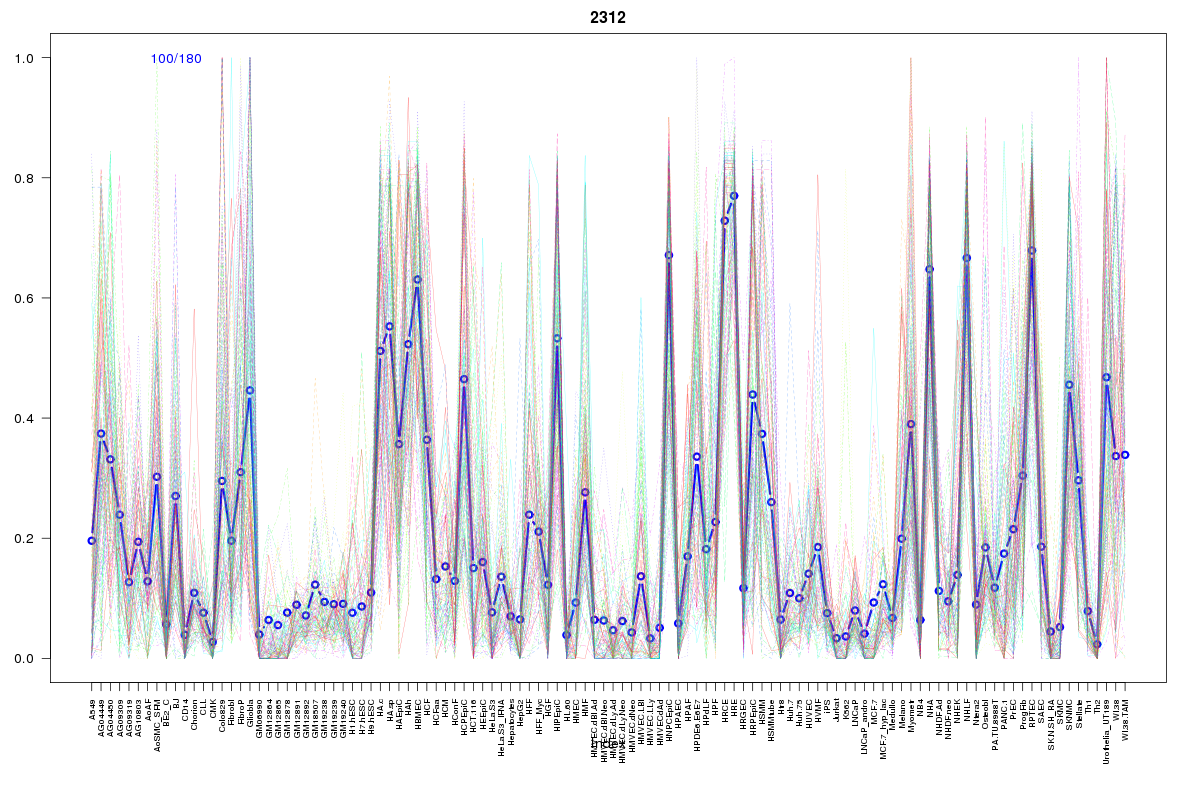 | 2312 | 1 |
 | 1329 | 1 |
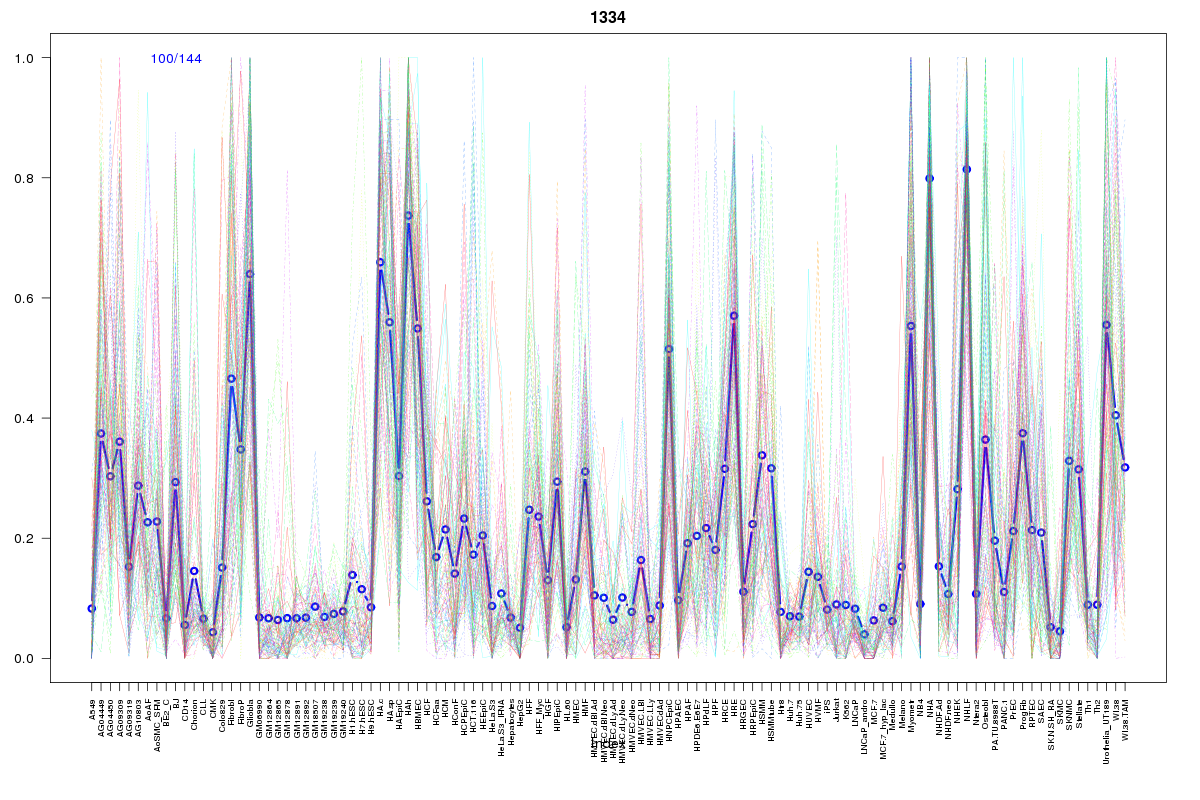 | 1334 | 1 |
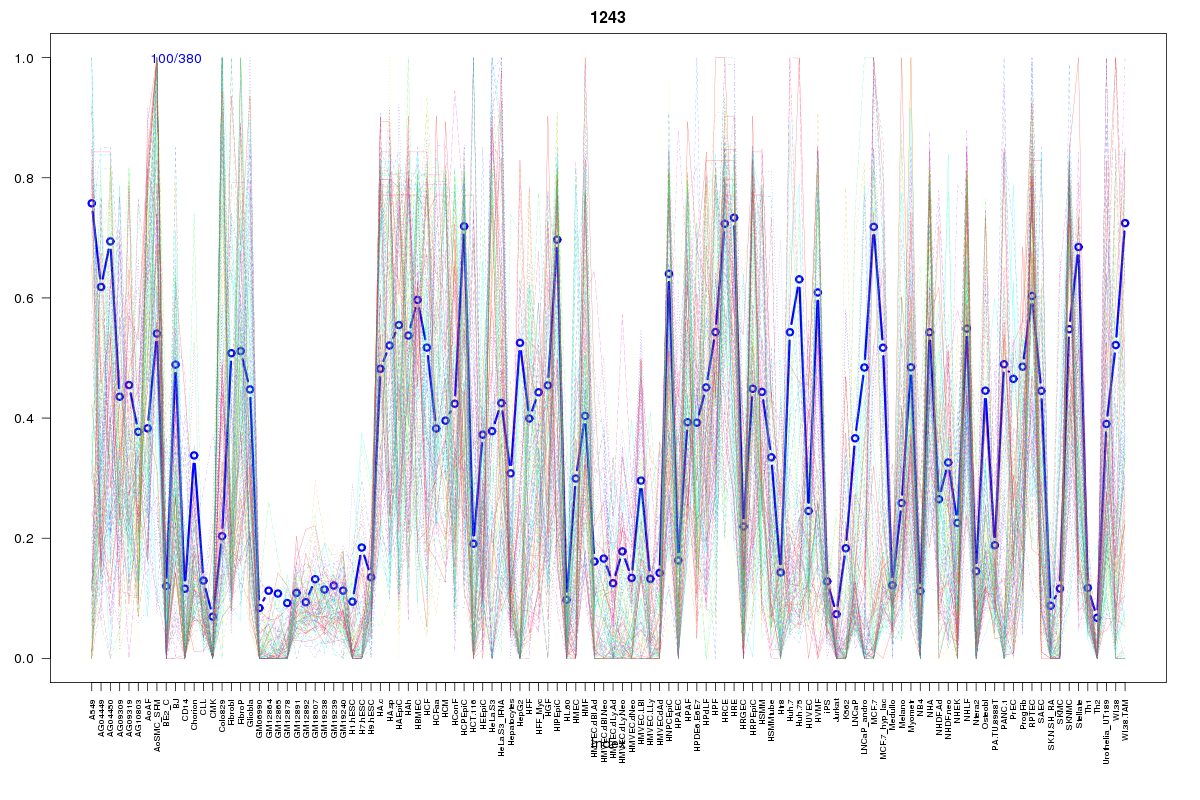 | 1243 | 1 |
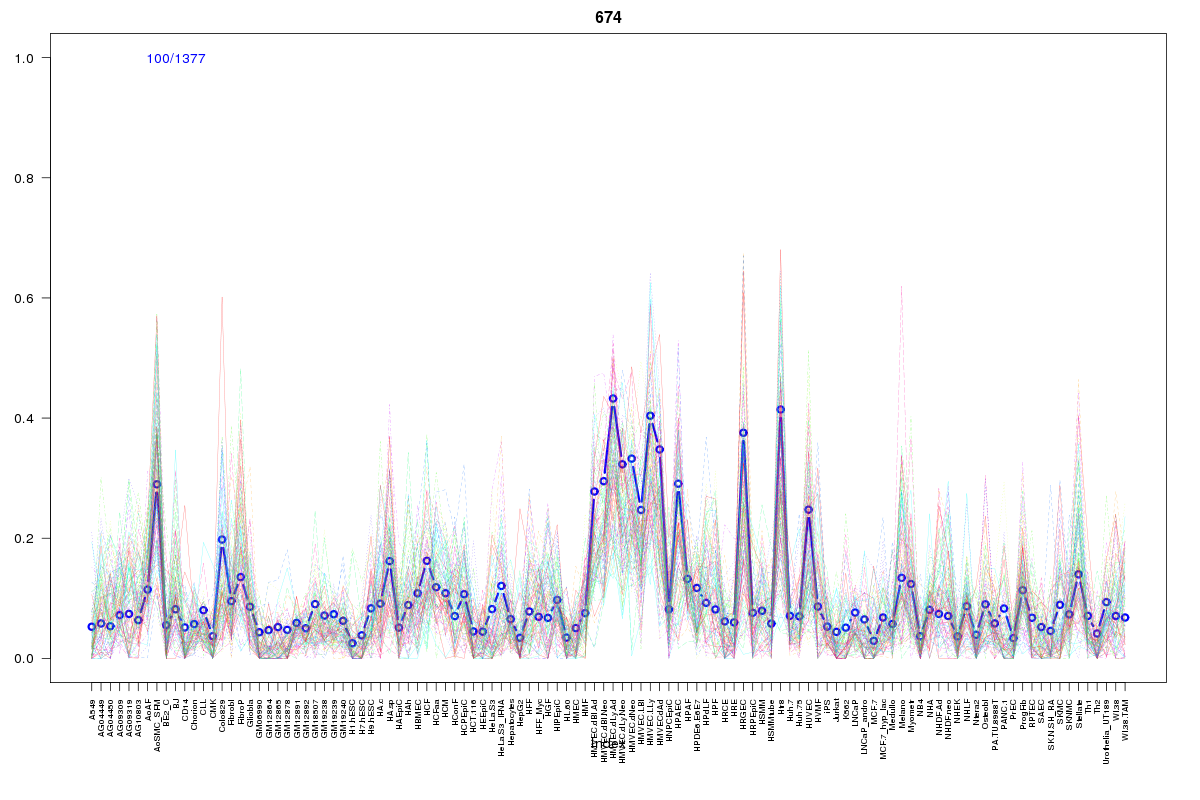 | 674 | 1 |
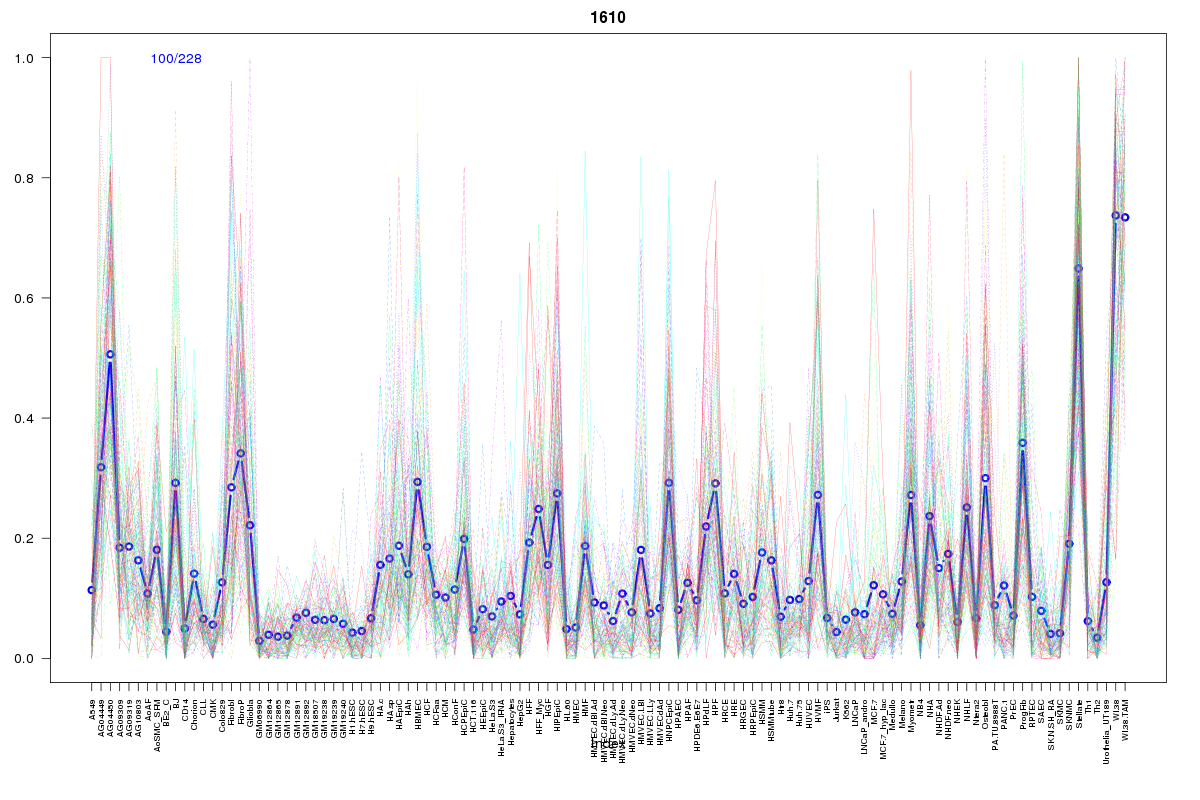 | 1610 | 1 |
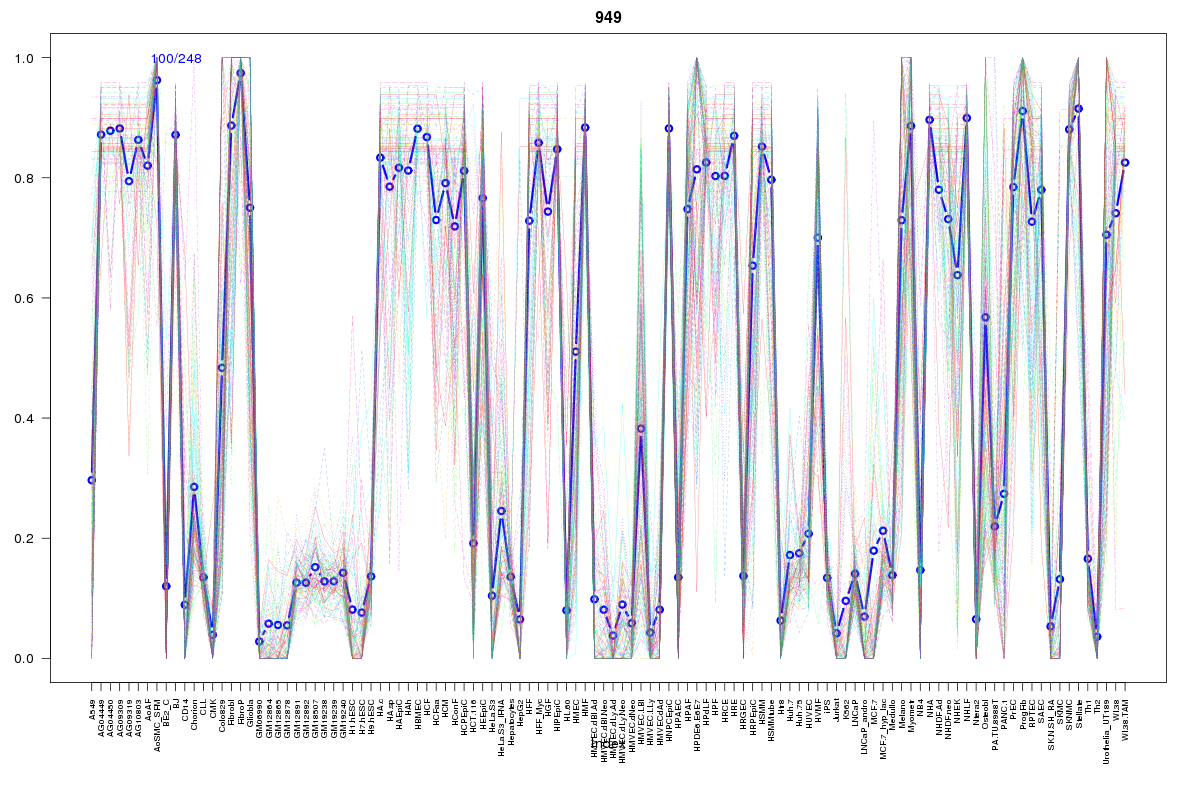 | 949 | 1 |
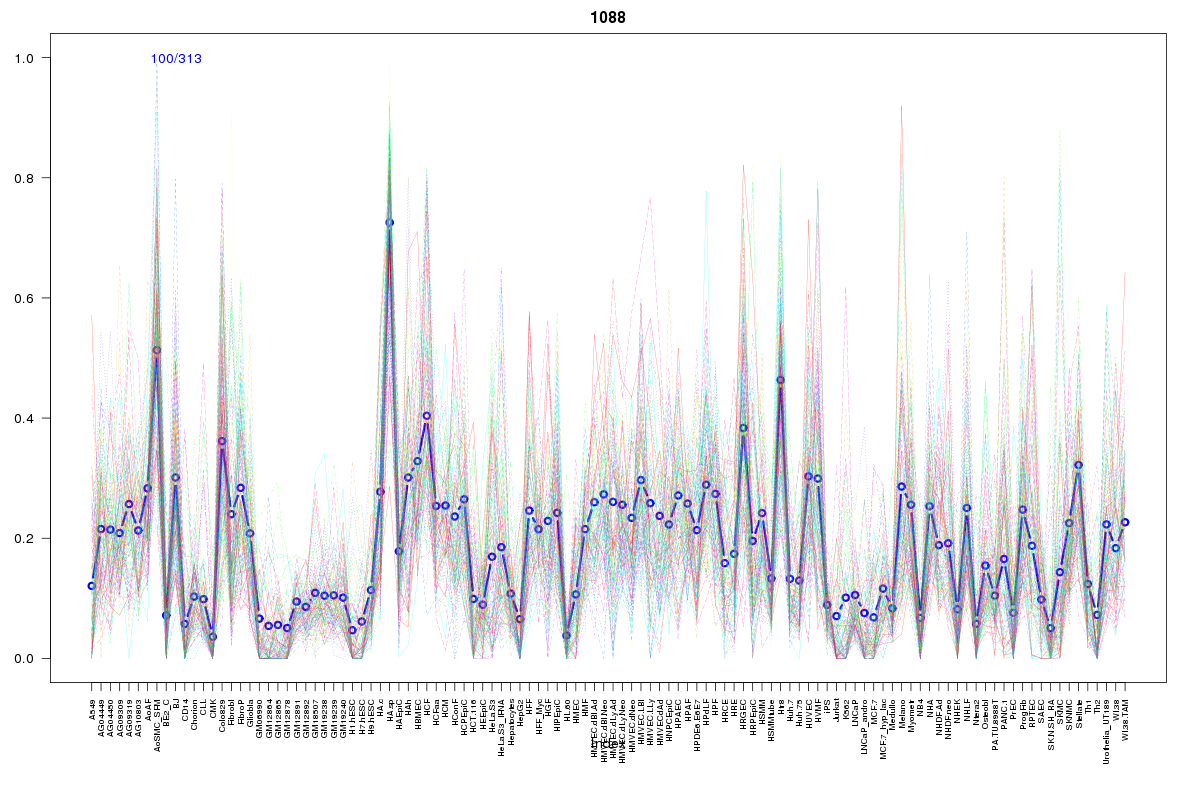 | 1088 | 1 |
 | 1388 | 1 |
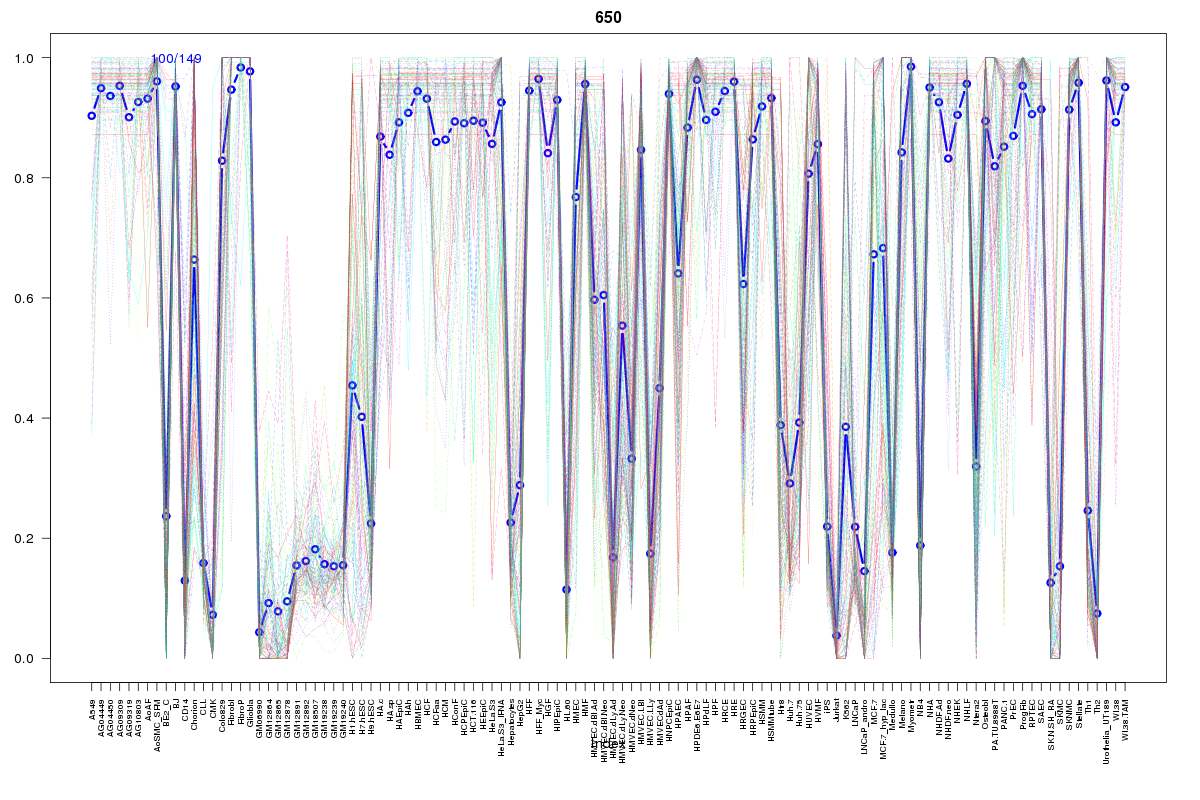 | 650 | 1 |
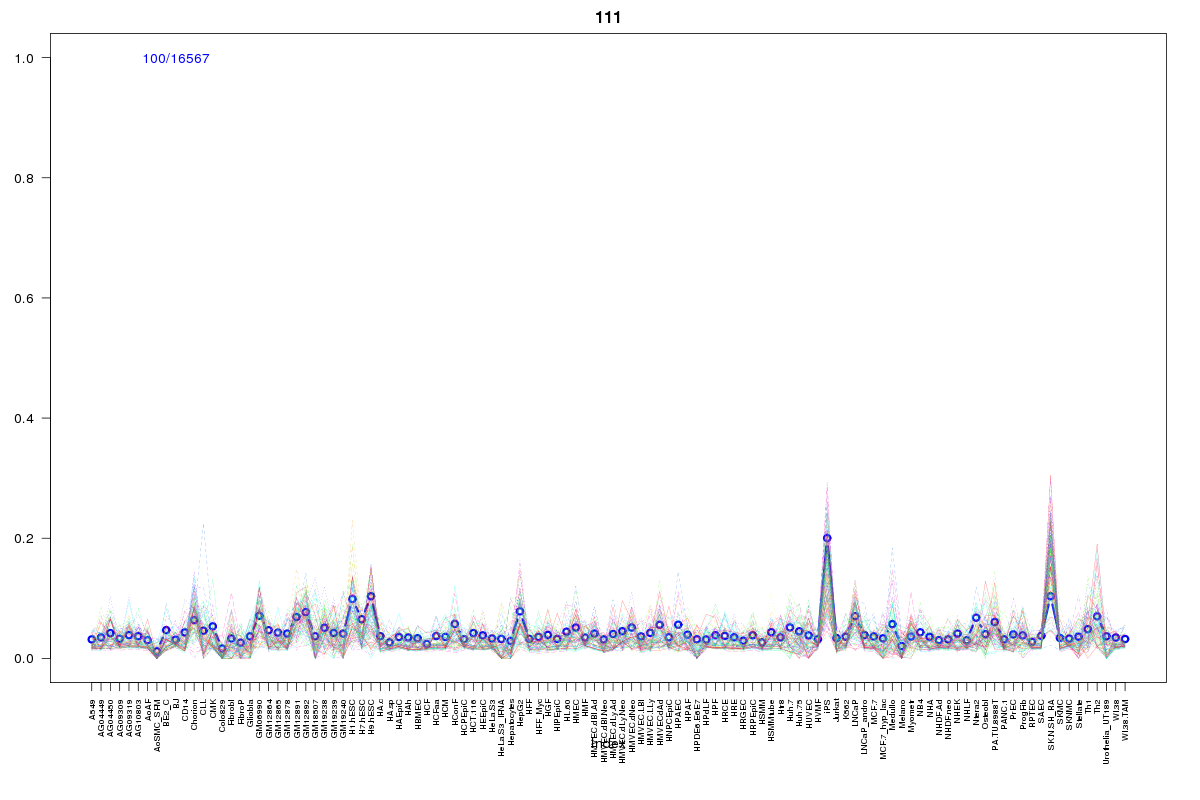 | 111 | 1 |
 | 569 | 1 |
 | 860 | 1 |
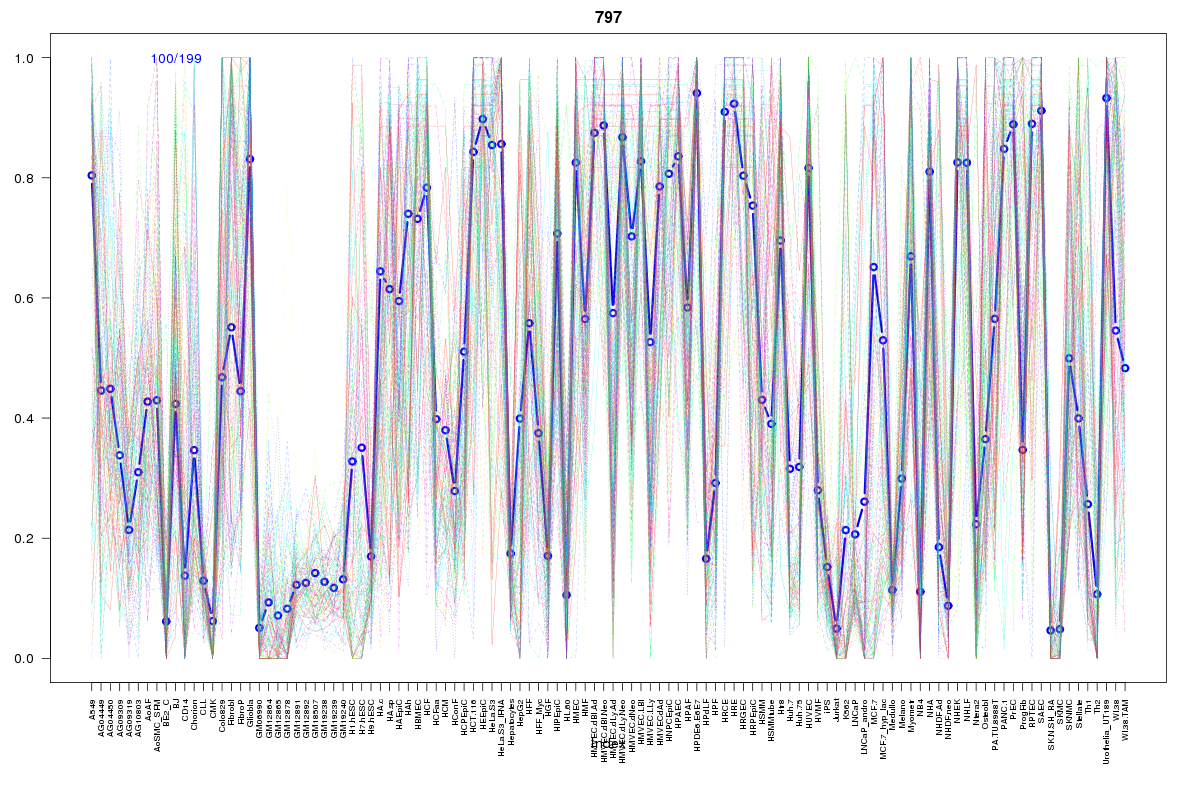 | 797 | 1 |
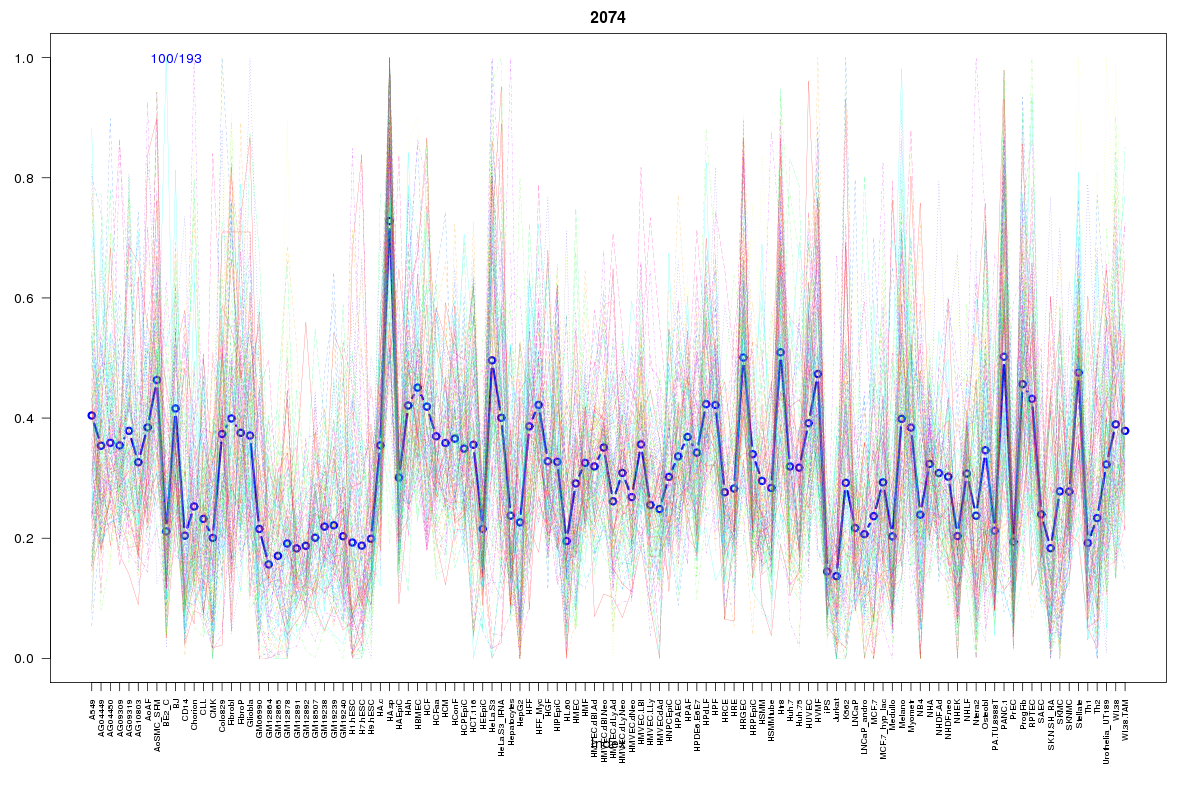 | 2074 | 1 |
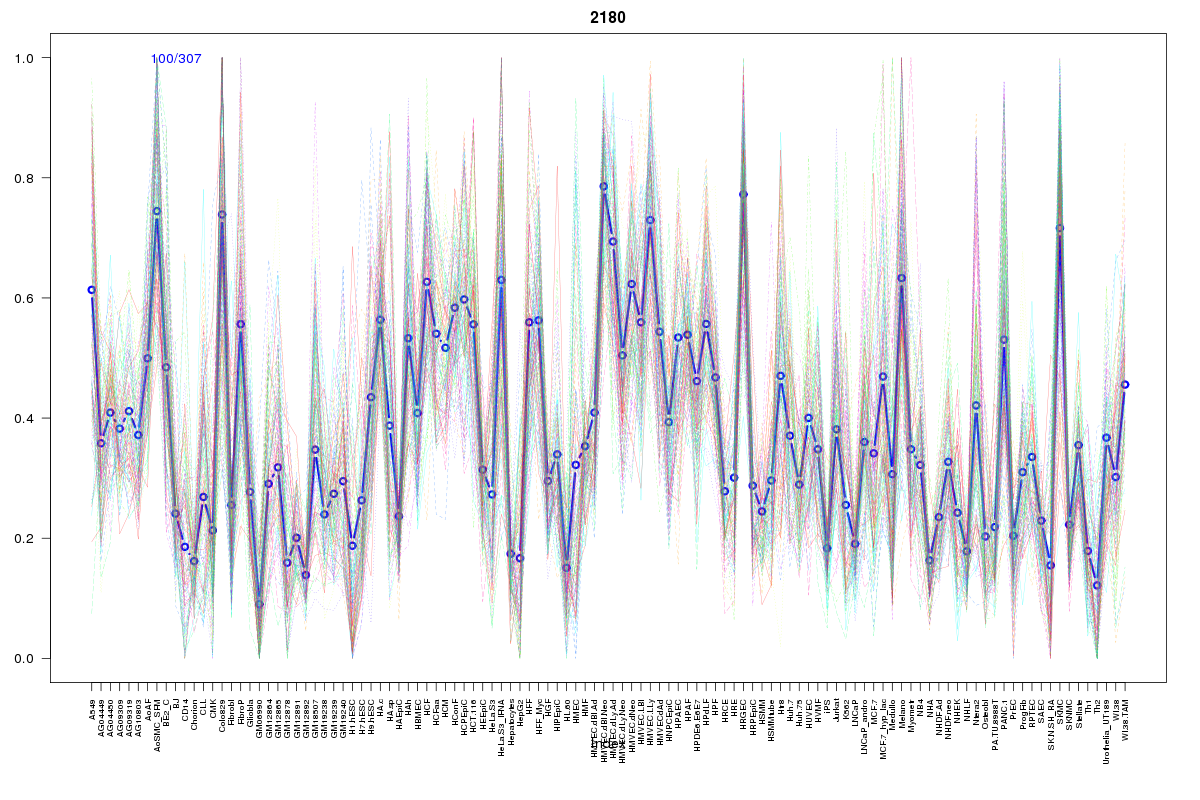 | 2180 | 1 |
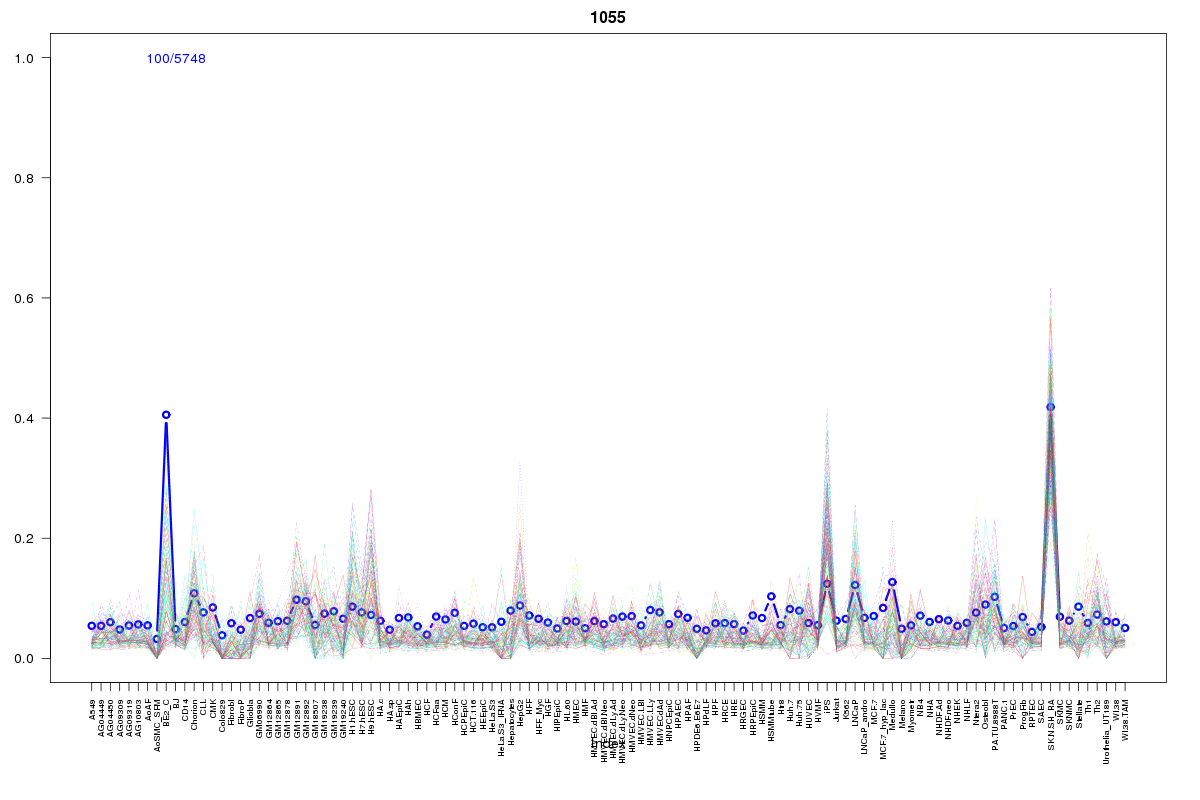 | 1055 | 1 |
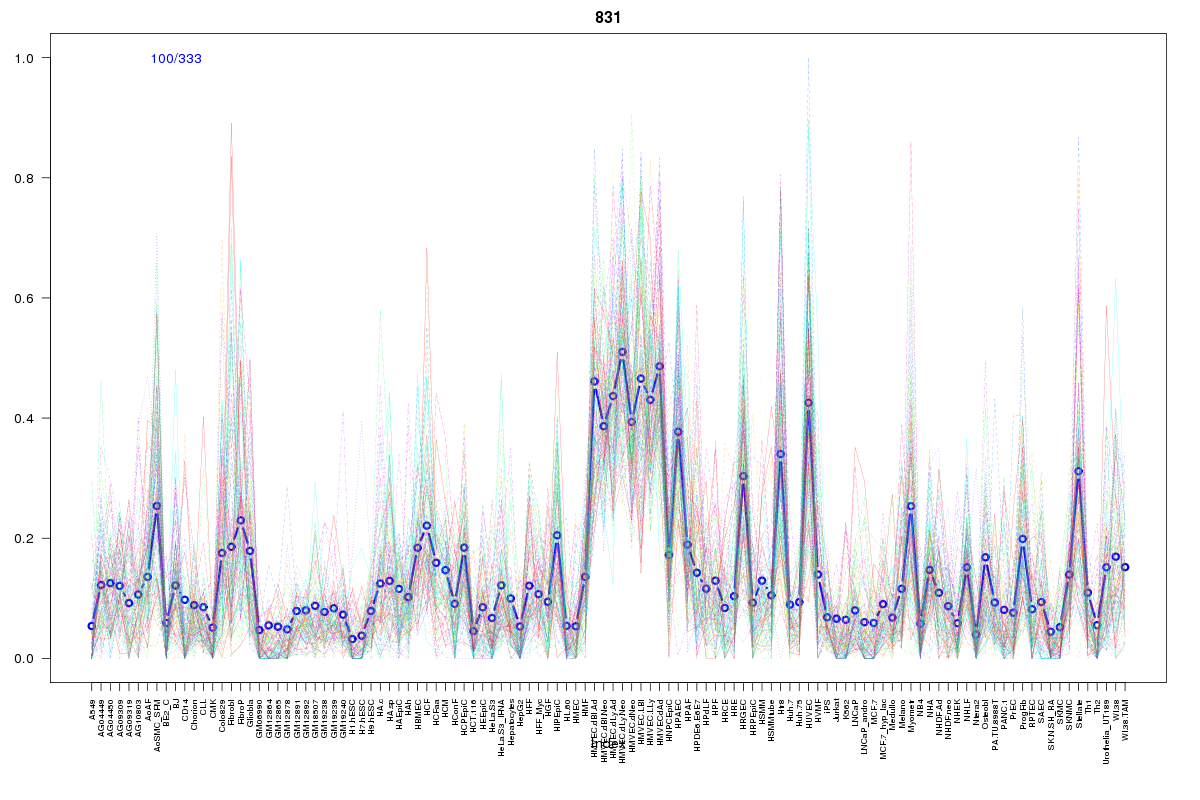 | 831 | 1 |
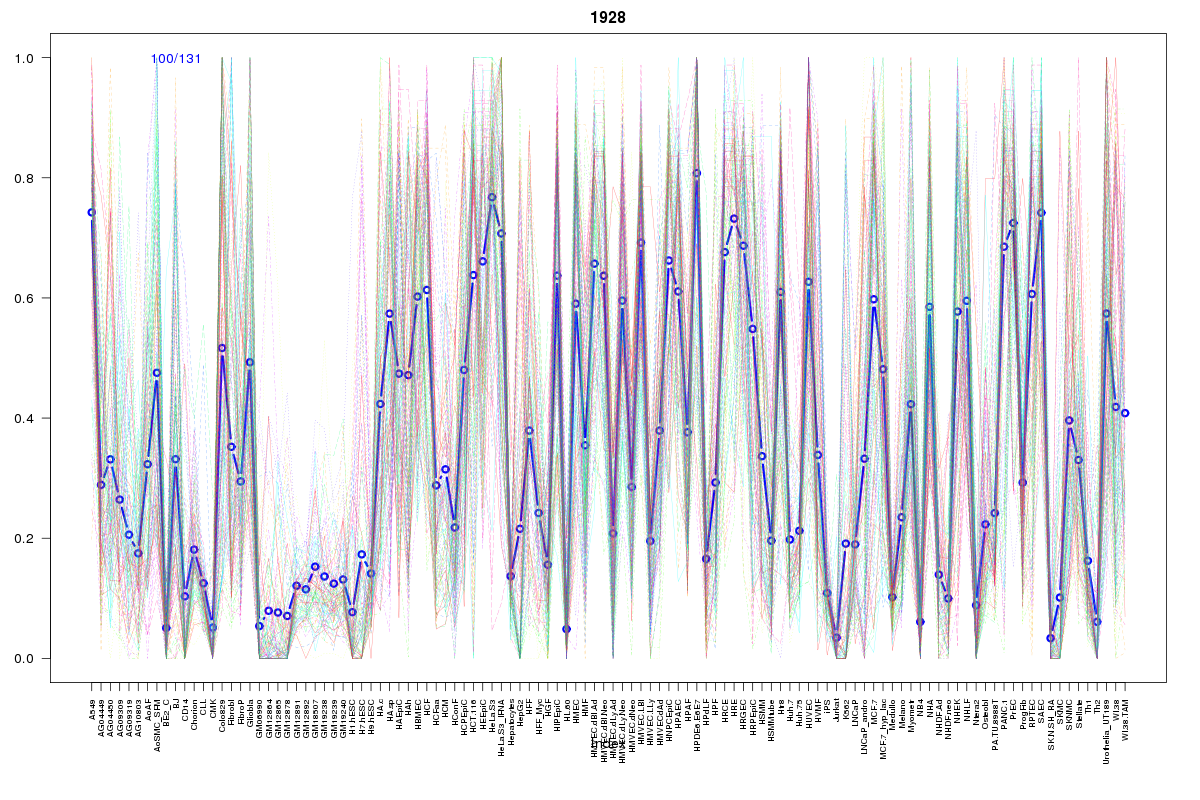 | 1928 | 1 |
 | 186 | 1 |
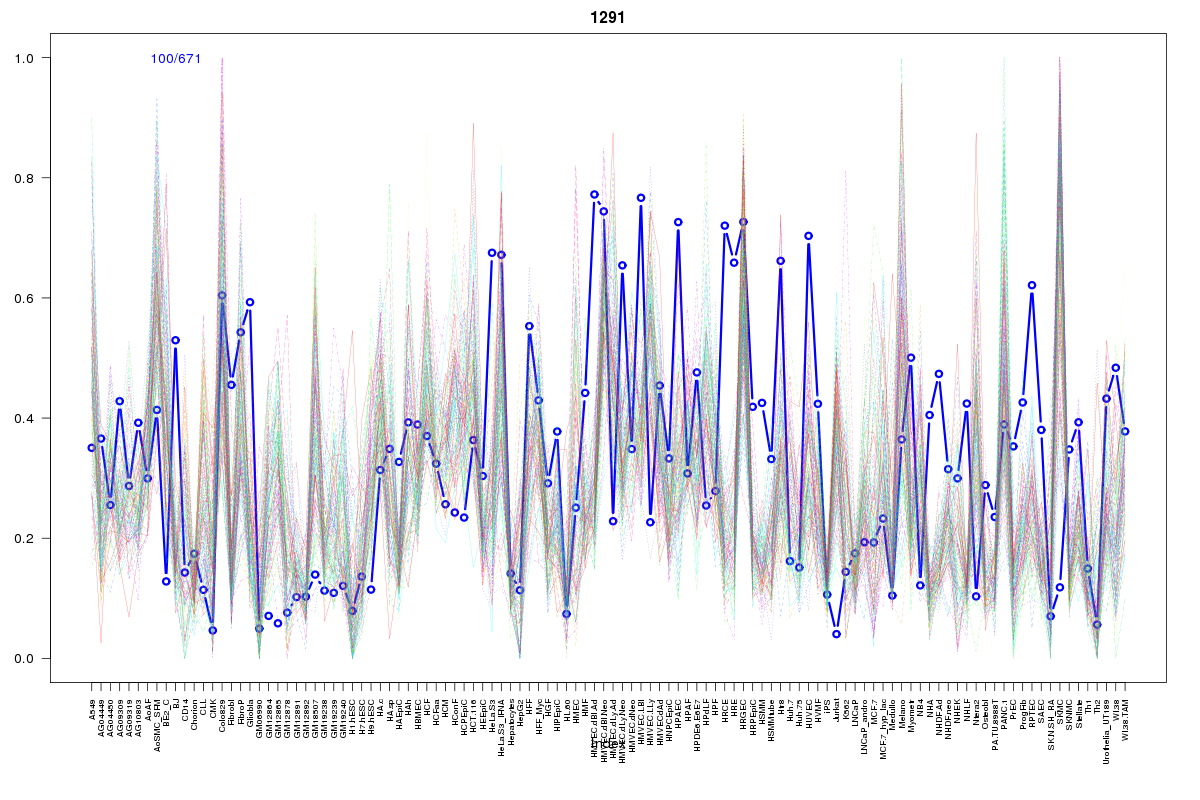 | 1291 | 1 |
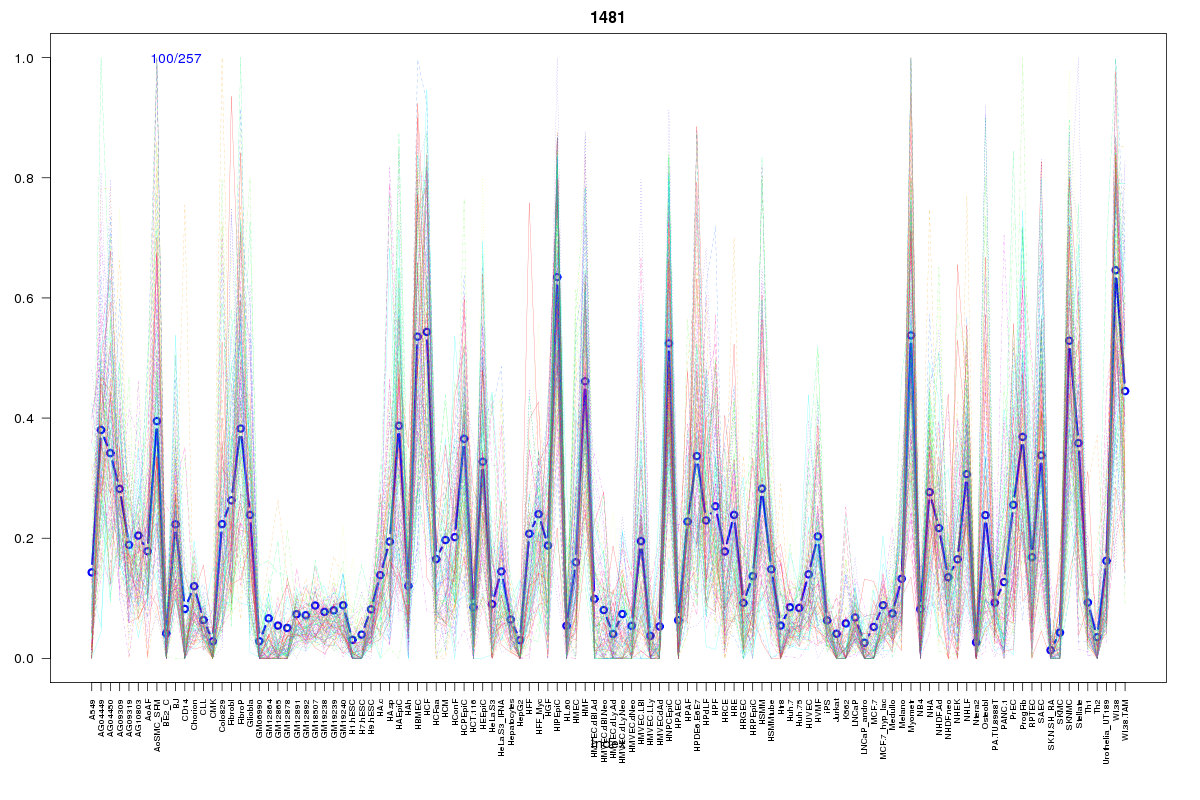 | 1481 | 1 |
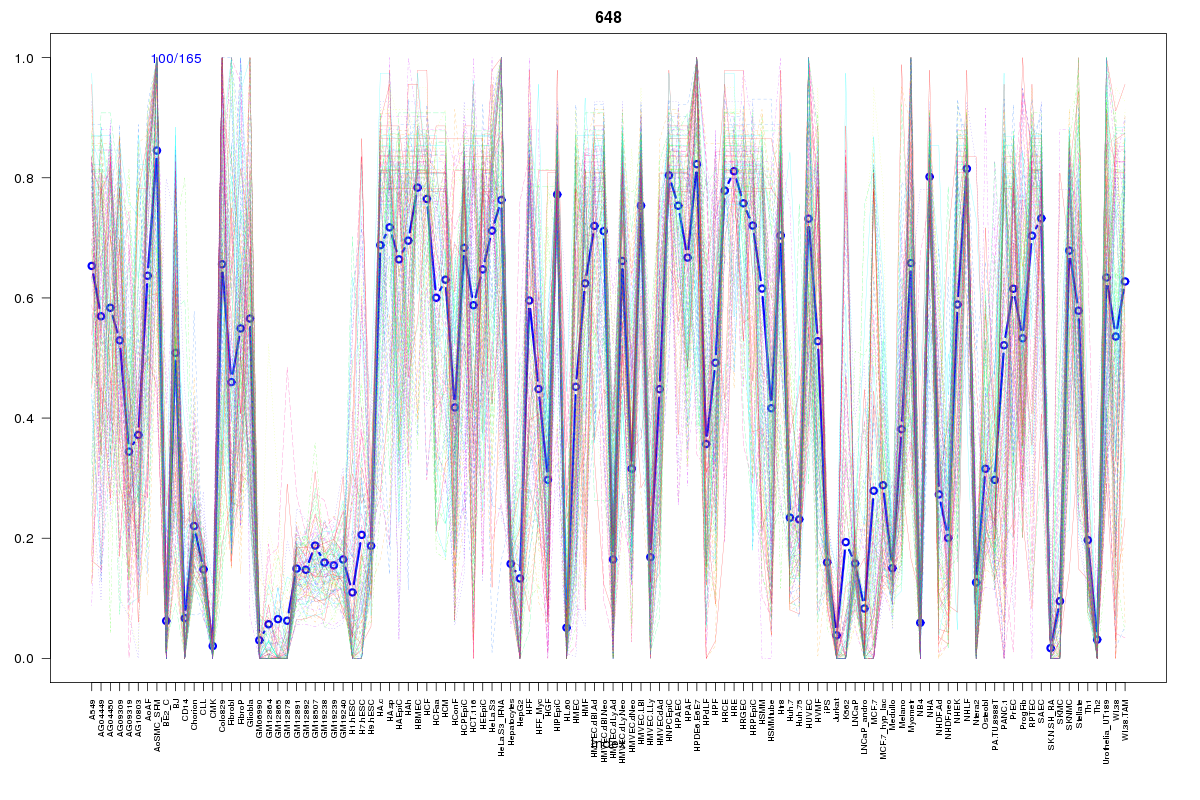 | 648 | 1 |
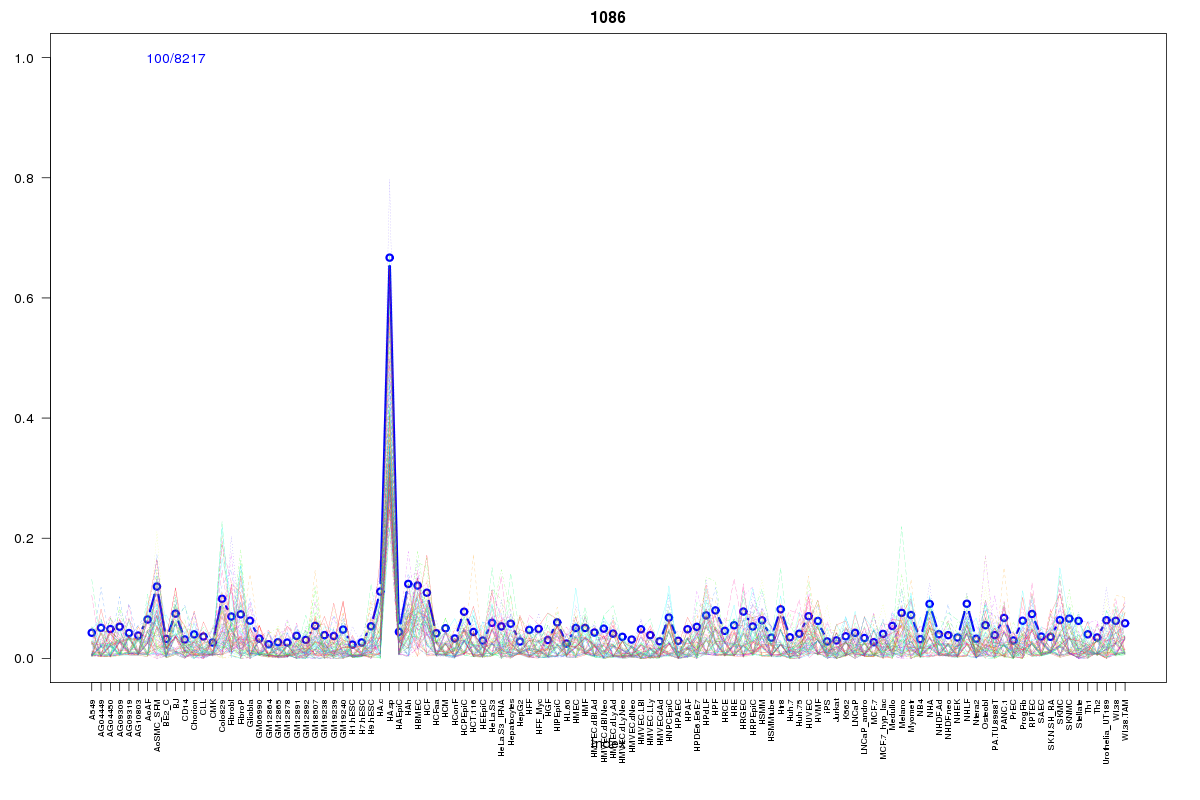 | 1086 | 1 |
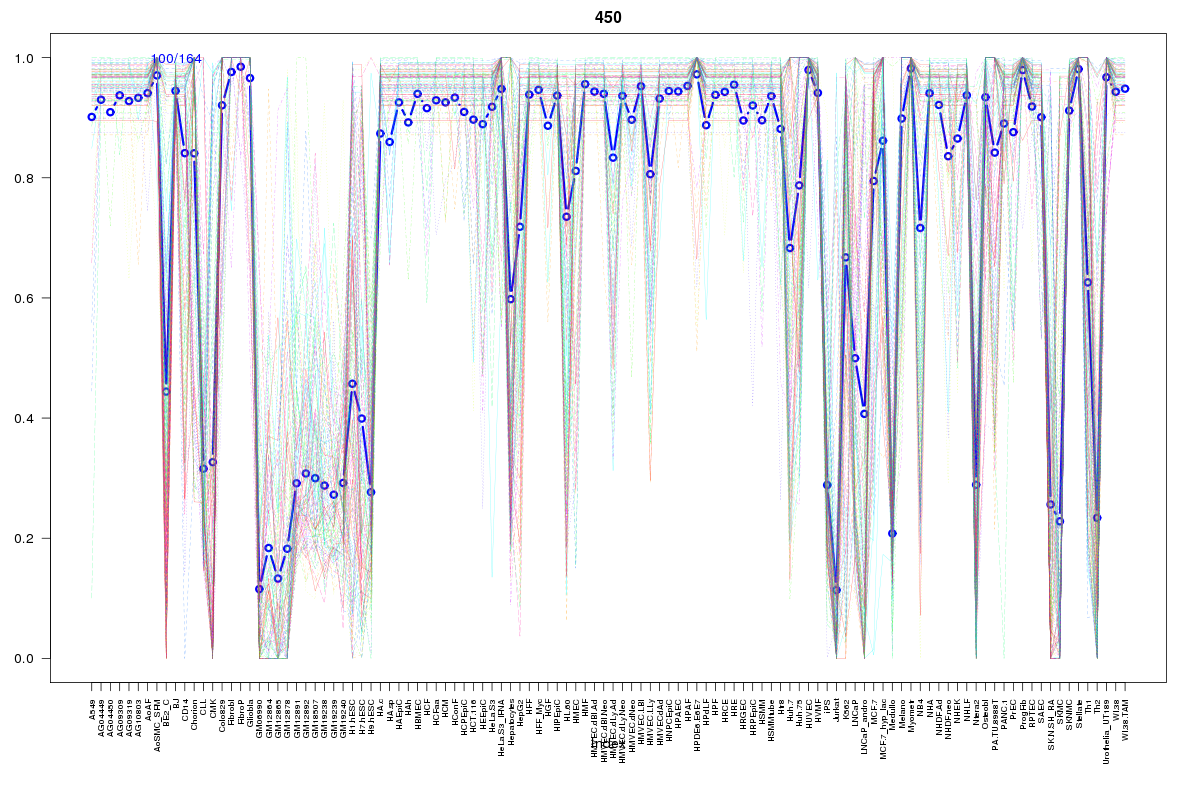 | 450 | 1 |
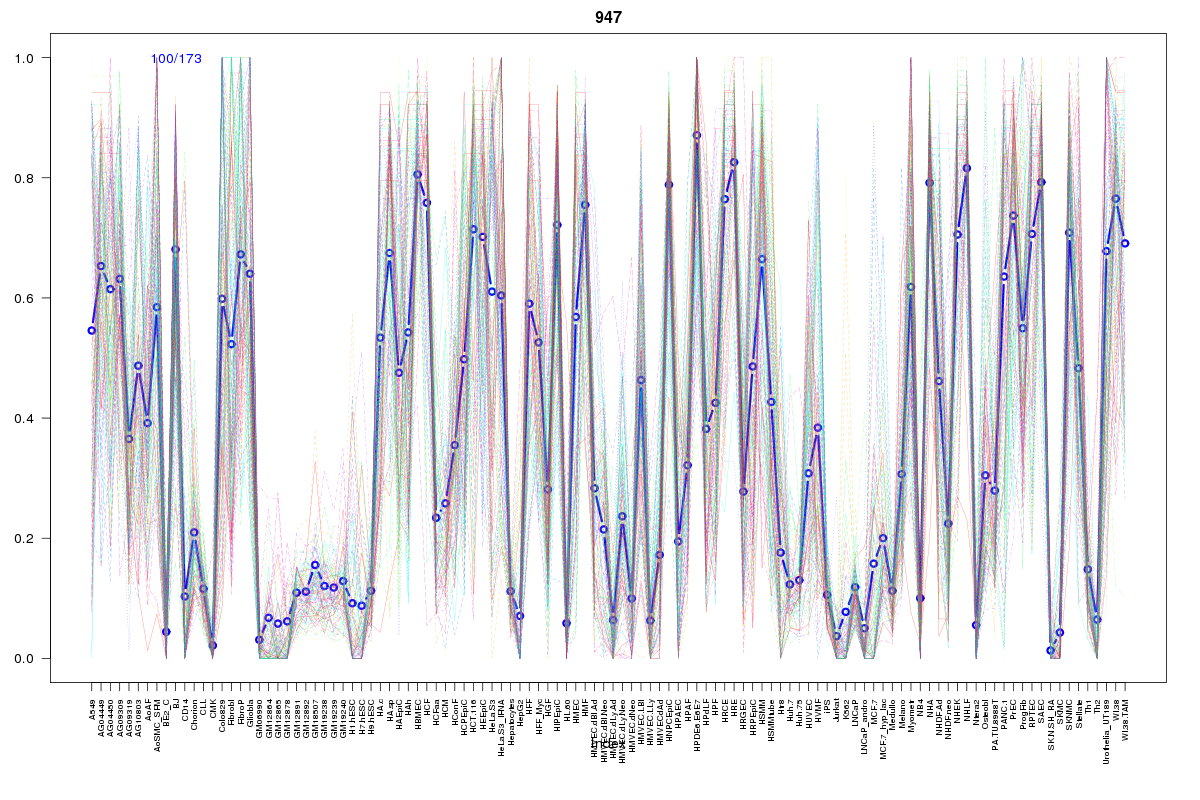 | 947 | 1 |
Resources
BED file downloads
Connects to 44 DHS sitesTop 10 Correlated DHS Sites
p-values indiciate significant higher or lower correlationExternal Databases
UCSCEnsembl (ENSG00000107959)