SOM cluster: 1334
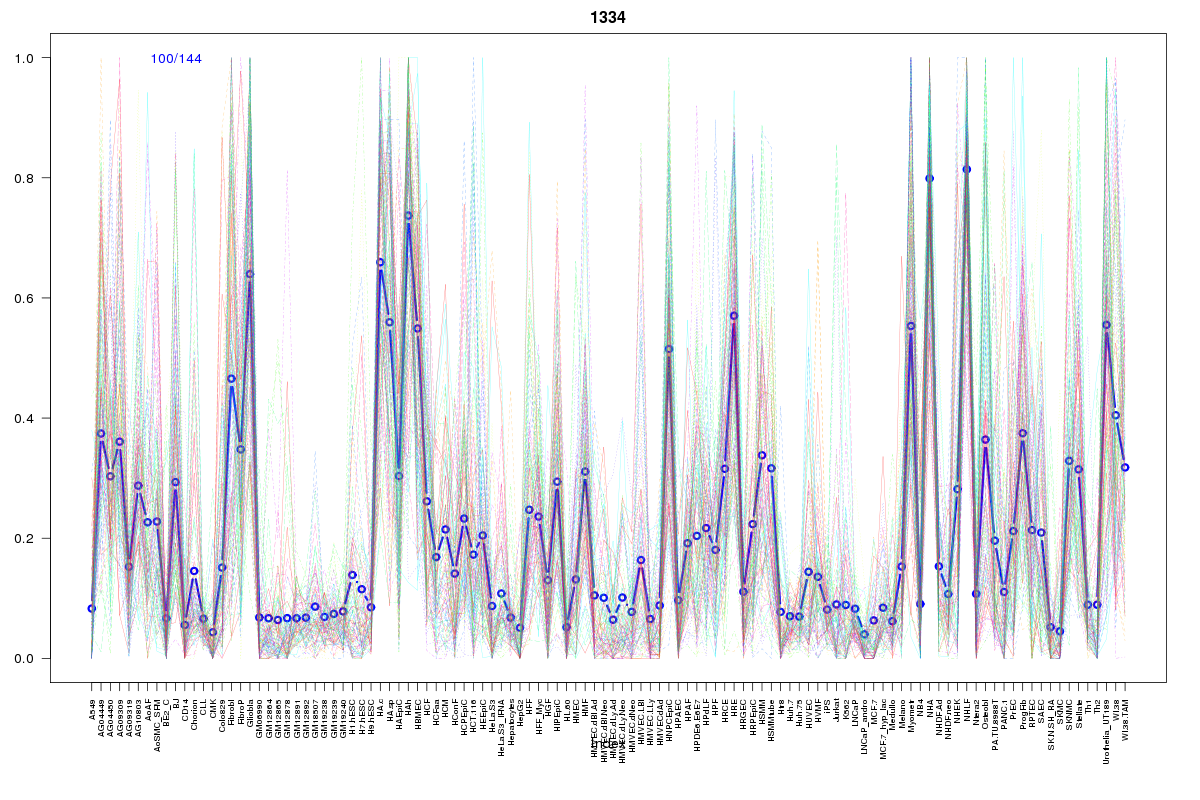
Cluster Hypersensitivity Profile

Genomic Location Trend
These plots show the distribution of the DHS sites surrounding the Transcript Start Site of the nearest gene.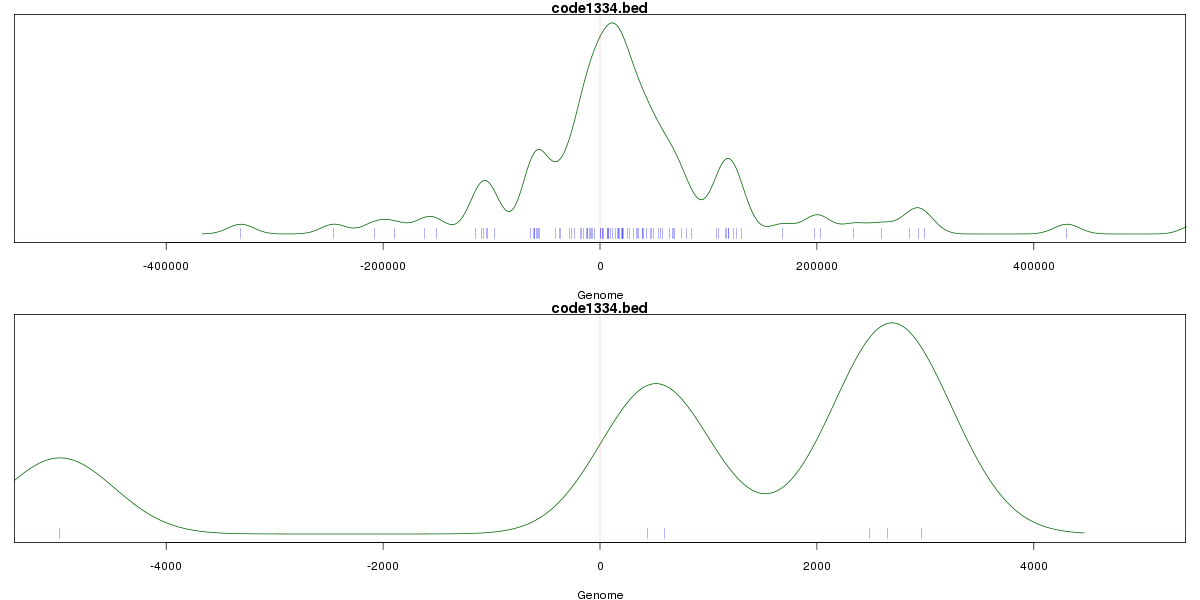
Stats
Number of sites: 144Promoter: 0%
CpG-Island: 4%
Conserved: 29%
Enriched Motifs & Matches
Match Detail: [Jaspar]
|
| ||
|---|---|---|
| Sites: 36/100 | e-val: 0.0000032 | ||
| Factor | e-val(match) | DB |
| AP1 | 0.000000000034803 | JASPAR |
| NFE2L2 | 0.0000000048936 | JASPAR |
| PPARG | 0.0041107 | JASPAR |
| NFE2L1::MafG | 0.0049132 | JASPAR |
| Foxa2 | 0.017566 | JASPAR |
|
| ||
| Sites: 14/100 | e-val: 0.0024 | ||
| Factor | e-val(match) | DB |
| IRF1 | 0.0041571 | JASPAR |
| FOXF2 | 0.004328 | JASPAR |
| EWSR1-FLI1 | 0.0049432 | JASPAR |
| Foxd3 | 0.0070546 | JASPAR |
| NFATC2 | 0.0073736 | JASPAR |
BED file downloads
Top 10 Example Regions
| Location | Gene Link | Dist. |
|---|---|---|
| chr12: 3216400-3216550 | TSPAN9 | 20.12 |
| chr8: 8175120-8175270 | FAM86B3P | 48.2 |
| chr8: 8175120-8175270 | ALG1L13P | 48.2 |
| chr19: 48693600-48693750 | PLA2G4C | 48.74 |
| chr12: 105199100-105199250 | Y_RNA | 49.19 |
| chr12: 105199100-105199250 | SLC41A2 | 49.19 |
| chr13: 110986780-110986930 | COL4A2 | 50.76 |
| chr13: 110986780-110986930 | COL4A1 | 50.76 |
| chr4: 183064925-183065075 | AC108142.1 | 52.1 |
| chr6: 56616940-56617090 | DST | 52.69 |