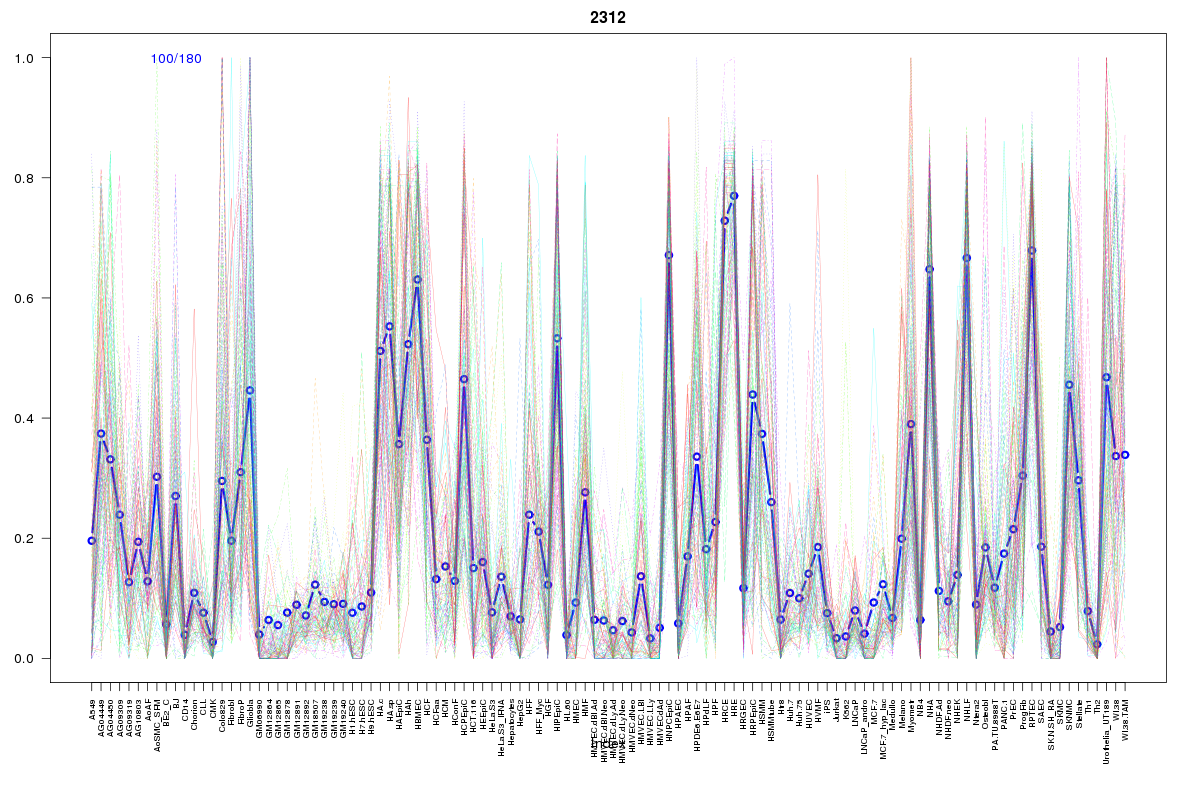
SOM cluster: 2312
Cluster Hypersensitivity Profile

Genomic Location Trend
These plots show the distribution of the DHS sites surrounding the Transcript Start Site of the nearest gene.
Stats
Number of sites: 180Promoter: 2%
CpG-Island: 0%
Conserved: 32%
Enriched Motifs & Matches
Match Detail: [Jaspar]
|
| ||
|---|---|---|
| Sites: 45/100 | e-val: 3.6e-17 | ||
| Factor | e-val(match) | DB |
| AP1 | 0.0000000024965 | JASPAR |
| NFE2L2 | 0.00000027326 | JASPAR |
| PPARG | 0.00057863 | JASPAR |
| HNF1B | 0.0057092 | JASPAR |
| NFE2L1::MafG | 0.02377 | JASPAR |
BED file downloads
Top 10 Example Regions
| Location | Gene Link | Dist. |
|---|---|---|
| chr16: 11851740-11851890 | ZC3H7A | 23.81 |
| chr8: 81919900-81920050 | RP11-172E10.1 | 28.78 |
| chr17: 70599800-70599950 | LINC00511 | 49.92 |
| chr7: 55198640-55198790 | EGFR-AS1 | 53.76 |
| chr18: 12628800-12628950 | SPIRE1 | 54.64 |
| chr7: 43341840-43341990 | AC004692.4 | 55.46 |
| chr7: 43341840-43341990 | HECW1 | 55.46 |
| chr11: 106259940-106260090 | RP11-680E19.2 | 56.73 |
| chr2: 105385680-105385830 | POU3F3 | 57.85 |
| chr2: 105385680-105385830 | LINC01158 | 57.85 |