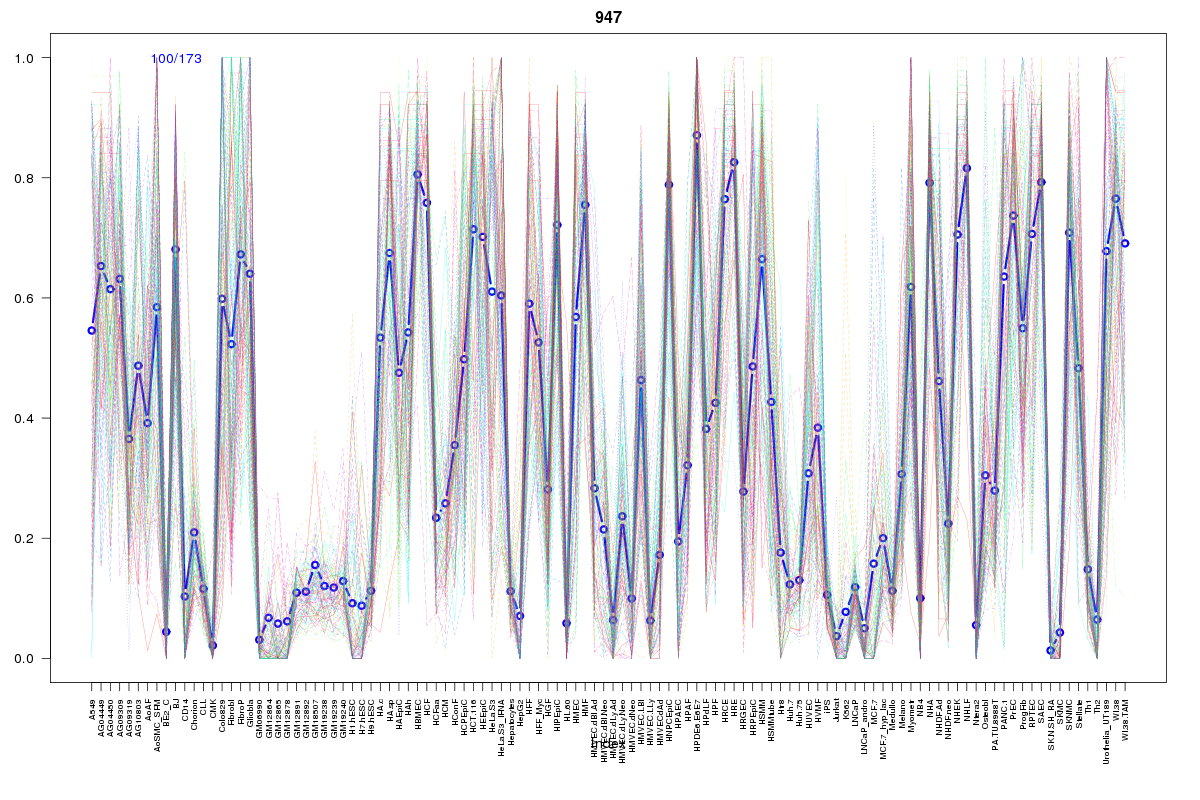
SOM cluster: 947
Cluster Hypersensitivity Profile

Genomic Location Trend
These plots show the distribution of the DHS sites surrounding the Transcript Start Site of the nearest gene.
Stats
Number of sites: 173Promoter: 1%
CpG-Island: 0%
Conserved: 43%
Enriched Motifs & Matches
Match Detail: [Jaspar]
|
| ||
|---|---|---|
| Sites: 68/100 | e-val: 0 | ||
| Factor | e-val(match) | DB |
| NFE2L2 | 0.000000000088972 | JASPAR |
| AP1 | 0.00000000096788 | JASPAR |
| NFE2L1::MafG | 0.00021096 | JASPAR |
| Pax2 | 0.0036551 | JASPAR |
| PBX1 | 0.0090143 | JASPAR |
BED file downloads
Top 10 Example Regions
| Location | Gene Link | Dist. |
|---|---|---|
| chr8: 17083920-17084070 | VPS37A | 29.78 |
| chr8: 17083920-17084070 | ZDHHC2 | 29.78 |
| chr7: 55200380-55200530 | EGFR | 42.47 |
| chr7: 55200380-55200530 | EGFR-AS1 | 42.47 |
| chr8: 134369260-134369410 | NDRG1 | 44.35 |
| chr1: 85839960-85840110 | BCL10 | 47.56 |
| chr1: 85839960-85840110 | DDAH1 | 47.56 |
| chr1: 198090300-198090450 | NEK7 | 51.75 |
| chr1: 168290400-168290550 | RP5-1059H15.1 | 55.46 |
| chr8: 32572780-32572930 | NRG1 | 59.99 |