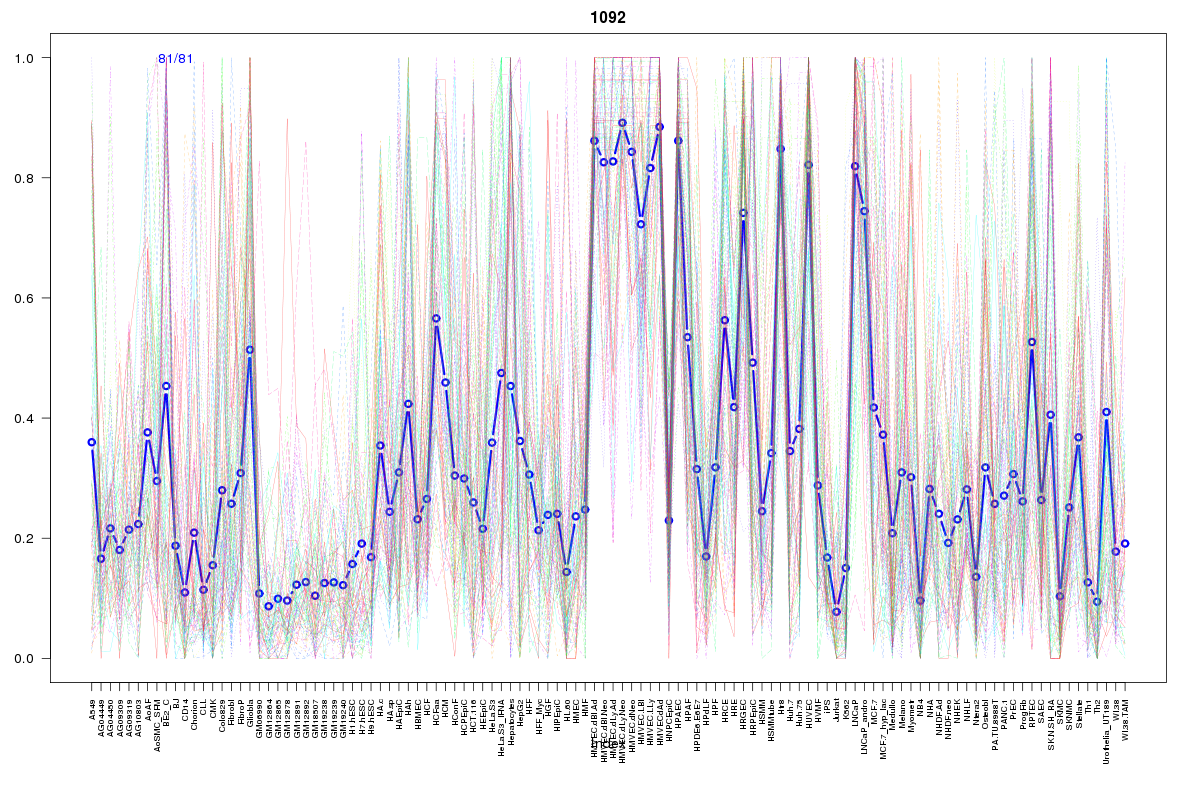
SOM cluster: 1092
Cluster Hypersensitivity Profile

Genomic Location Trend
These plots show the distribution of the DHS sites surrounding the Transcript Start Site of the nearest gene.
Stats
Number of sites: 81Promoter: 10%
CpG-Island: 5%
Conserved: 56%
Enriched Motifs & Matches
Match Detail: [Jaspar]
|
| ||
|---|---|---|
| Sites: 72/81 | e-val: 4.9e-18 | ||
| Factor | e-val(match) | DB |
| TLX1::NFIC | 0.000020219 | JASPAR |
| EWSR1-FLI1 | 0.00010846 | JASPAR |
| NFIC | 0.0020629 | JASPAR |
| NFATC2 | 0.0055819 | JASPAR |
| FEV | 0.008169 | JASPAR |
|
| ||
| Sites: 31/81 | e-val: 0.012 | ||
| Factor | e-val(match) | DB |
| FEV | 0.000000020755 | JASPAR |
| Stat3 | 0.00000020977 | JASPAR |
| SPI1 | 0.0000015197 | JASPAR |
| ELK4 | 0.0000022031 | JASPAR |
| ELF5 | 0.000064416 | JASPAR |
|
| ||
| Sites: 35/81 | e-val: 1.8 | ||
| Factor | e-val(match) | DB |
| SP1 | 0.0000013097 | JASPAR |
| Tal1::Gata1 | 0.000013086 | JASPAR |
| EWSR1-FLI1 | 0.00010635 | JASPAR |
| Klf4 | 0.0081322 | JASPAR |
| SPI1 | 0.010574 | JASPAR |
BED file downloads
Top 10 Example Regions
| Location | Gene Link | Dist. |
|---|---|---|
| chr19: 8459840-8459990 | MARCH2 | 48.66 |
| chr19: 8459840-8459990 | KANK3 | 48.66 |
| chr12: 120976520-120976670 | TRIAP1 | 52.79 |
| chr12: 120976520-120976670 | COX6A1 | 52.79 |
| chr12: 120976520-120976670 | POP5 | 52.79 |
| chr9: 116756500-116756650 | ZNF618 | 56.22 |
| chr5: 142254260-142254410 | ARHGAP26 | 59.46 |
| chr17: 200600-200750 | RPH3AL | 60.26 |
| chr17: 200600-200750 | AC108004.3 | 60.26 |
| chr16: 57300100-57300250 | PLLP | 60.53 |