Gene: CCT3
chr1: 156278758-156308256Expression Profile
(log scale)
Graphical Connections
Distribution of linked clusters:
You may find it interesting if many of the connected DHS sites belong to the same cluster.| Cluster Profile | Cluster ID | Number of DHS sites in this cluster |
|---|---|---|
 | 2279 | 3 |
 | 1056 | 1 |
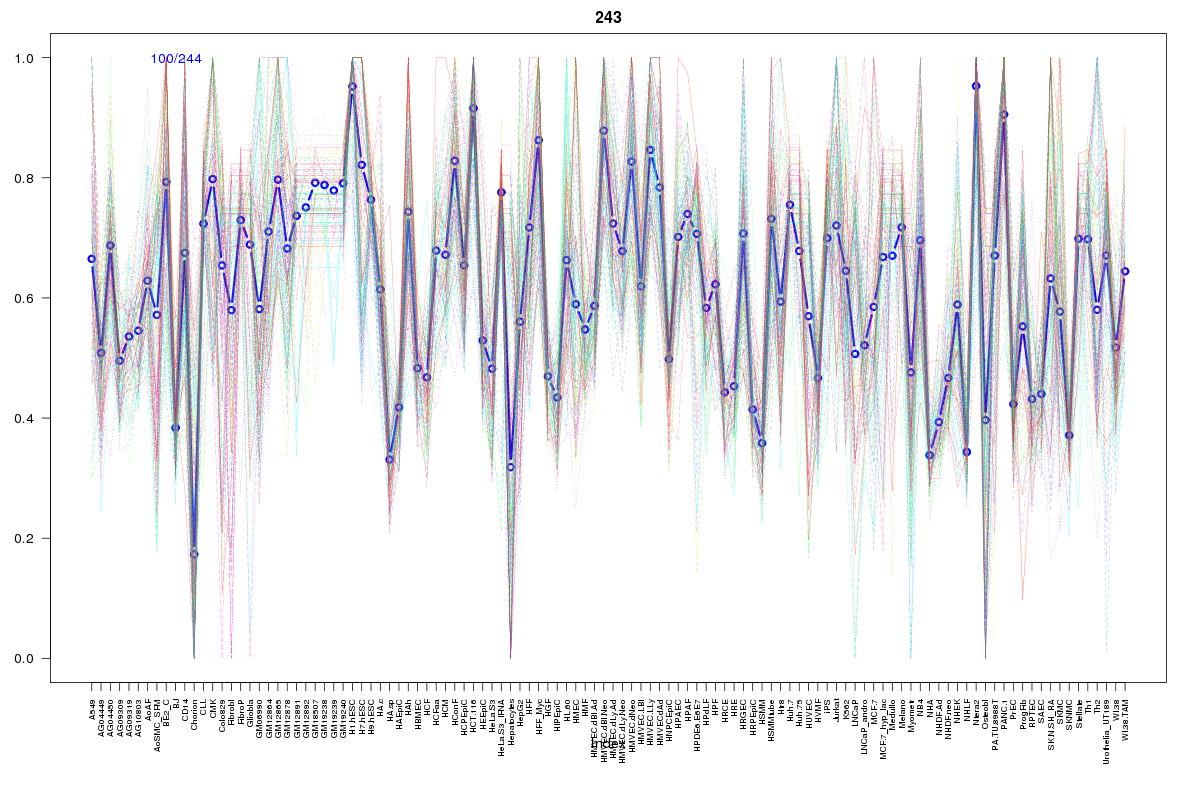 | 243 | 1 |
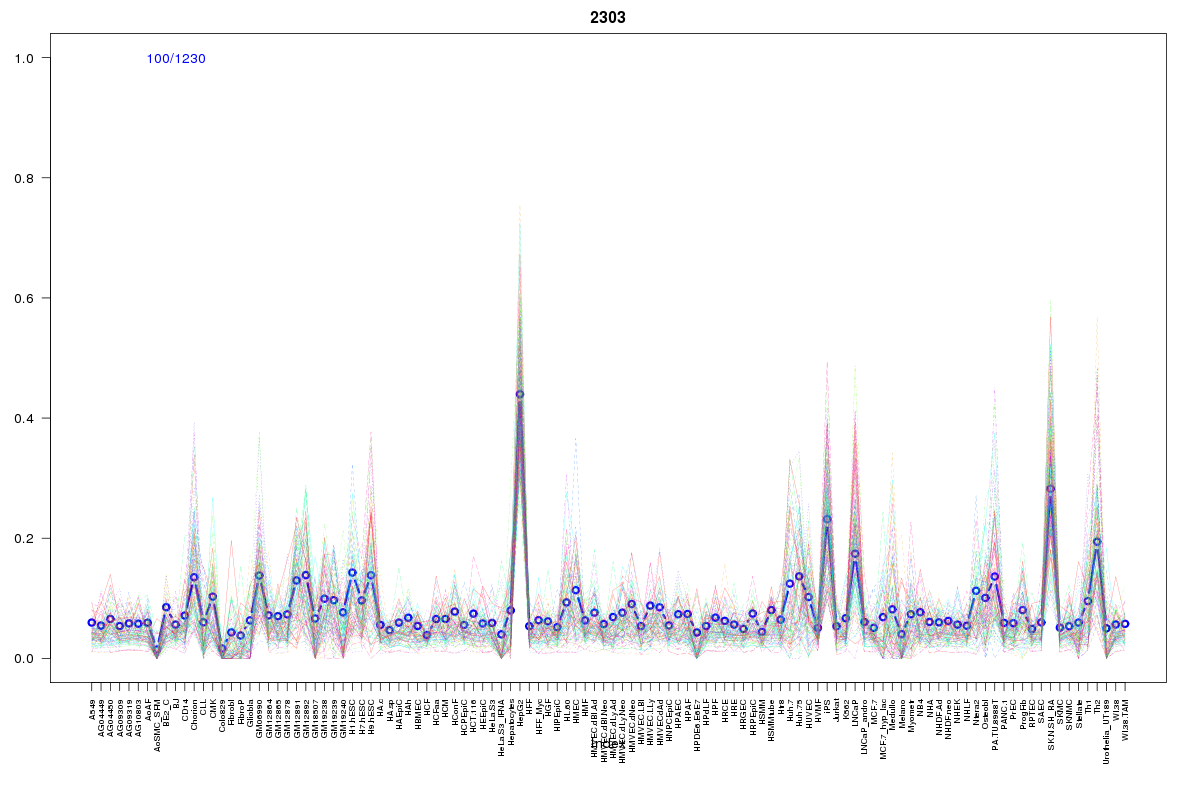 | 2303 | 1 |
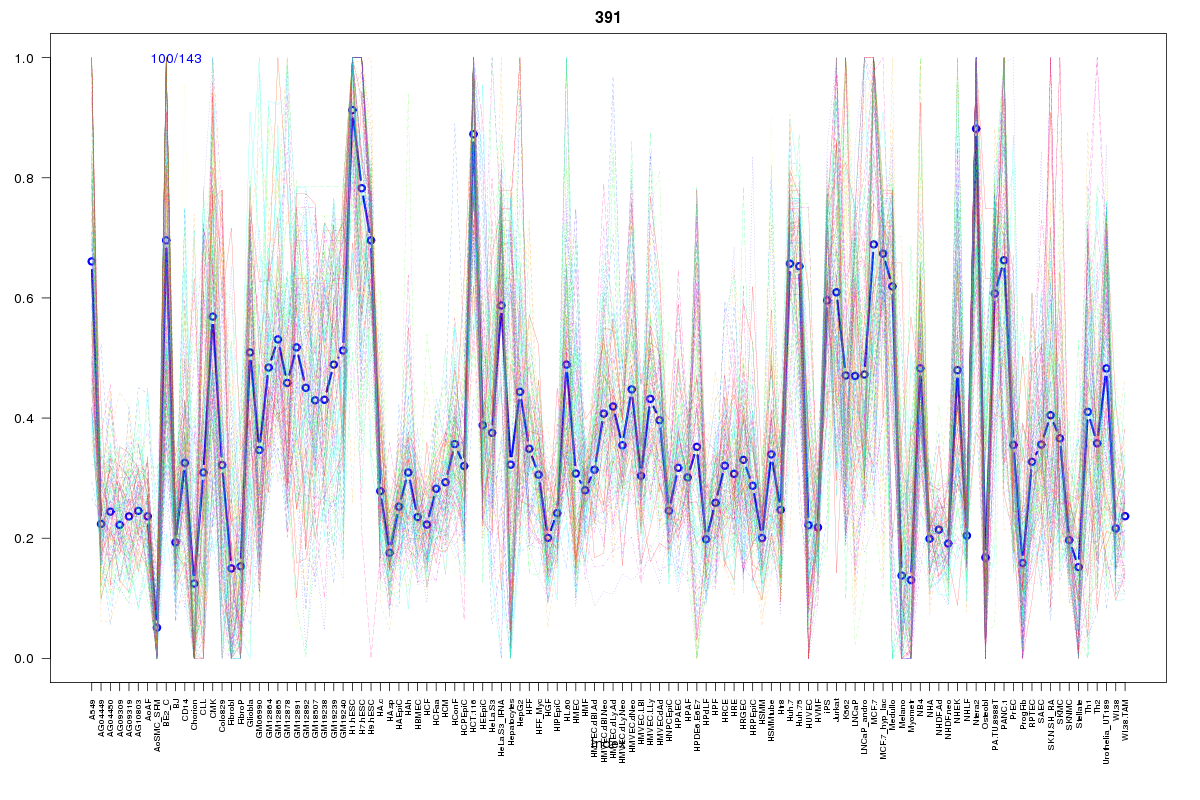 | 391 | 1 |
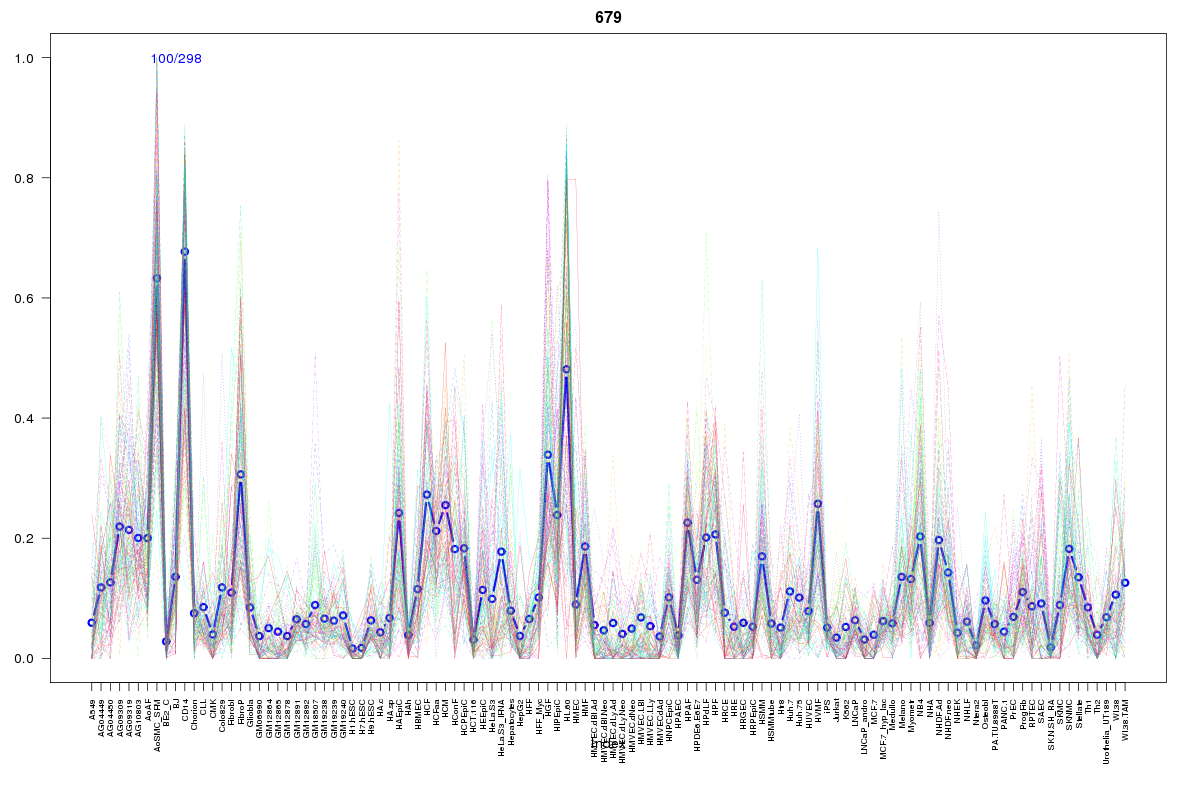 | 679 | 1 |
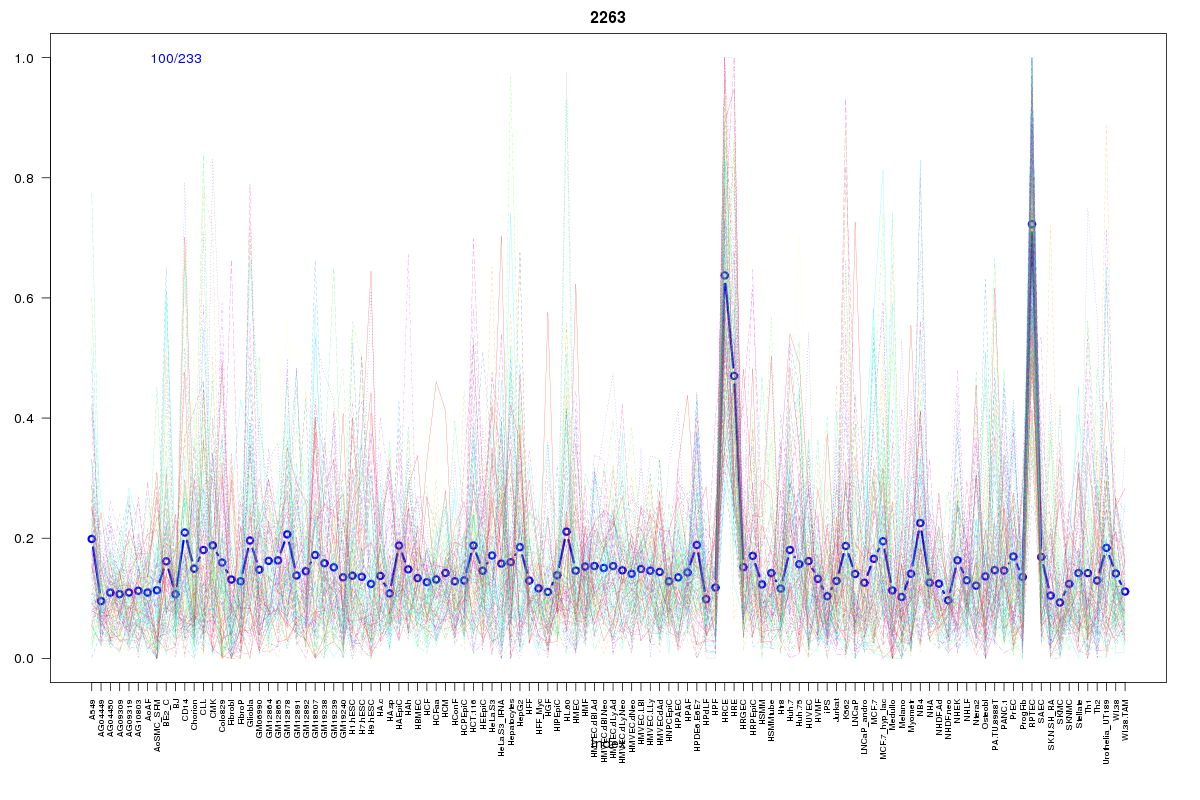 | 2263 | 1 |
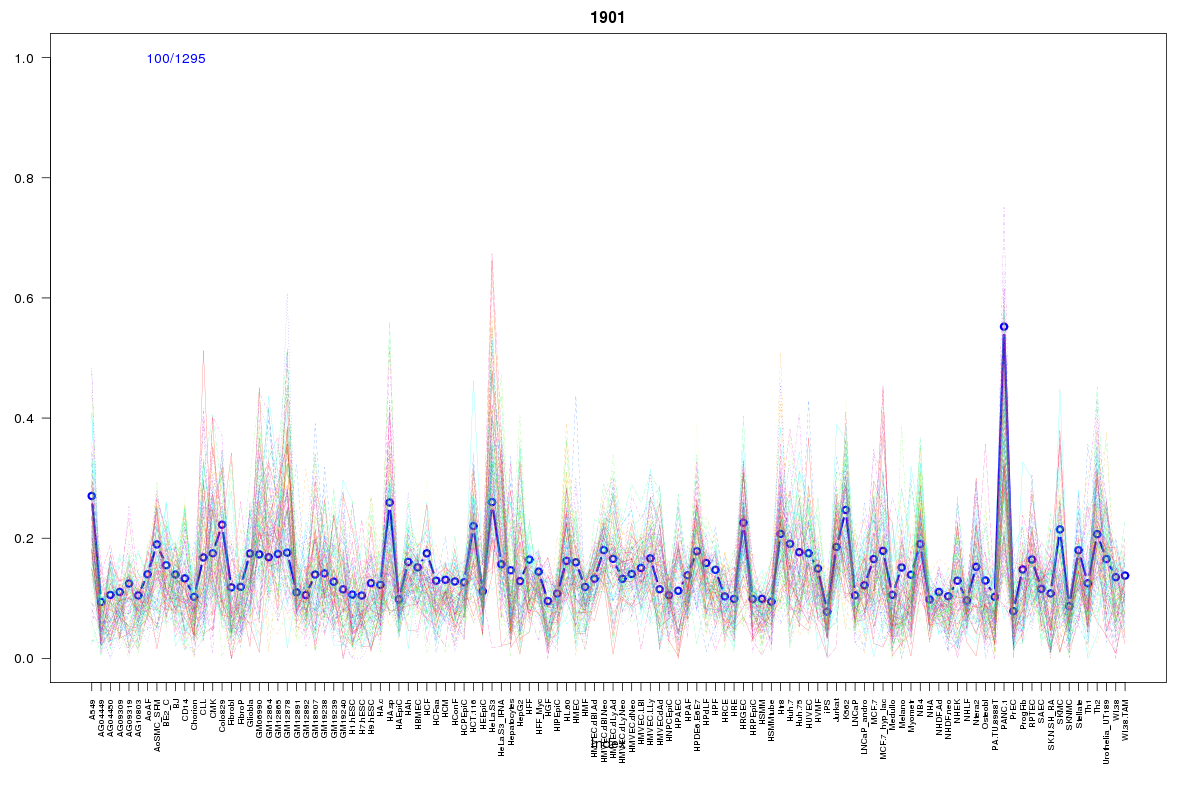 | 1901 | 1 |
 | 421 | 1 |
 | 860 | 1 |
 | 655 | 1 |
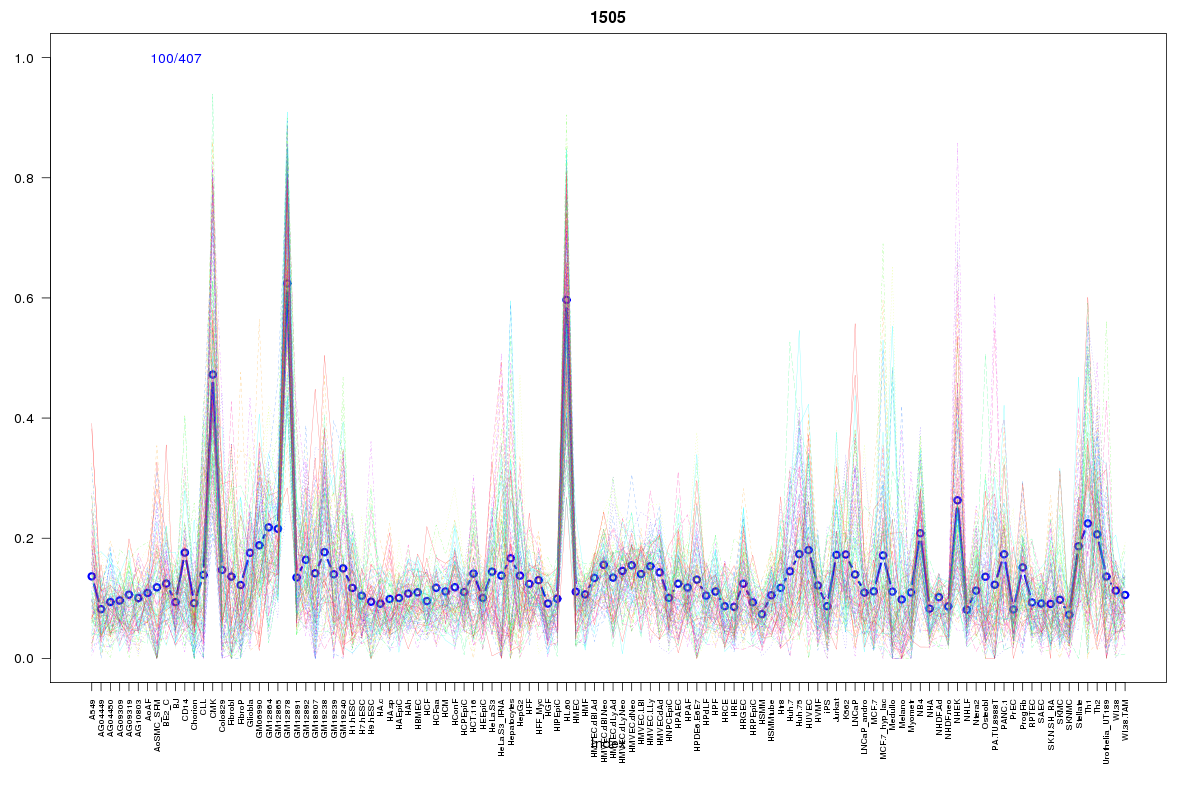 | 1505 | 1 |
 | 1495 | 1 |
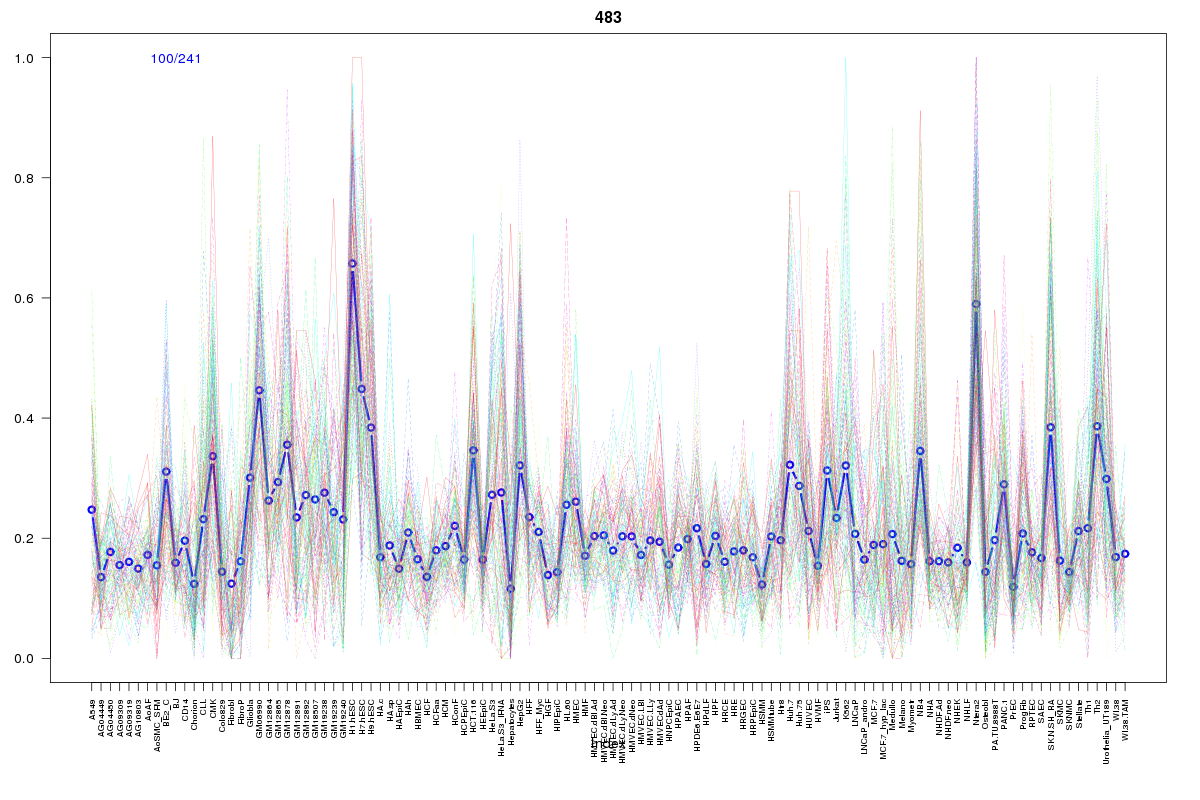 | 483 | 1 |
 | 2055 | 1 |
 | 629 | 1 |
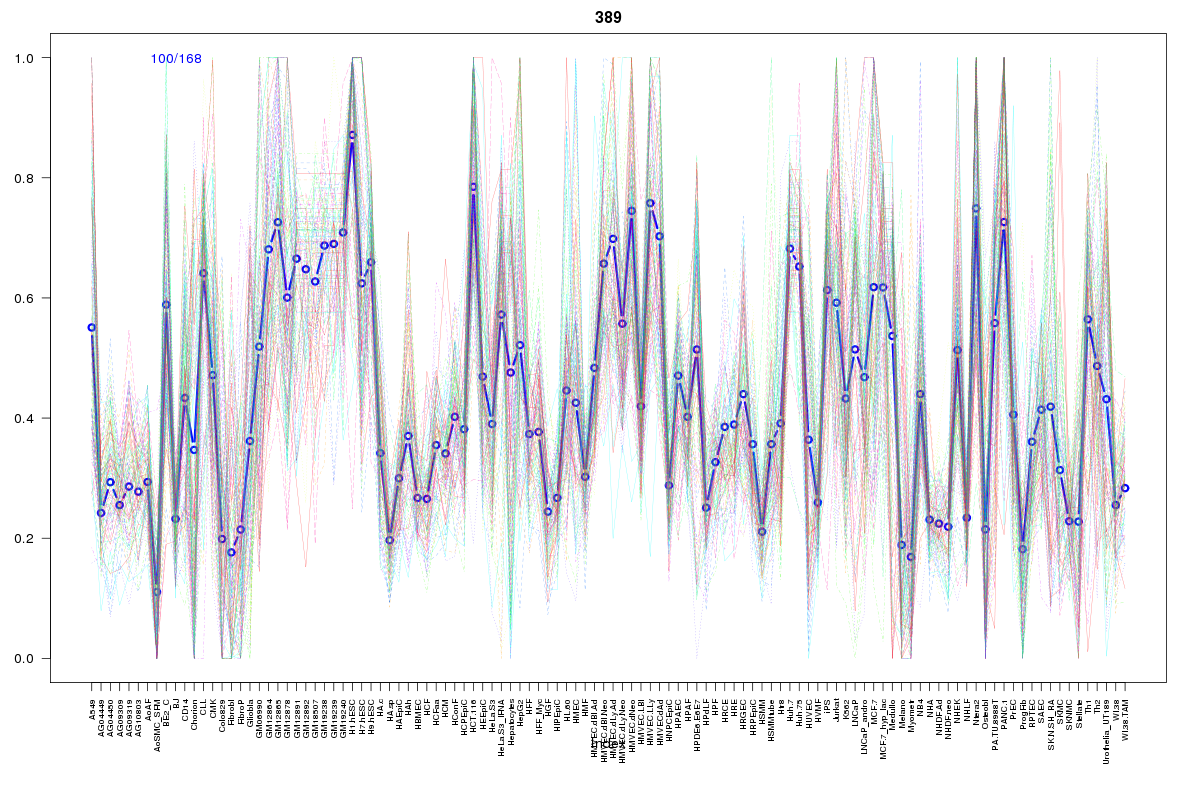 | 389 | 1 |
 | 615 | 1 |
 | 1011 | 1 |
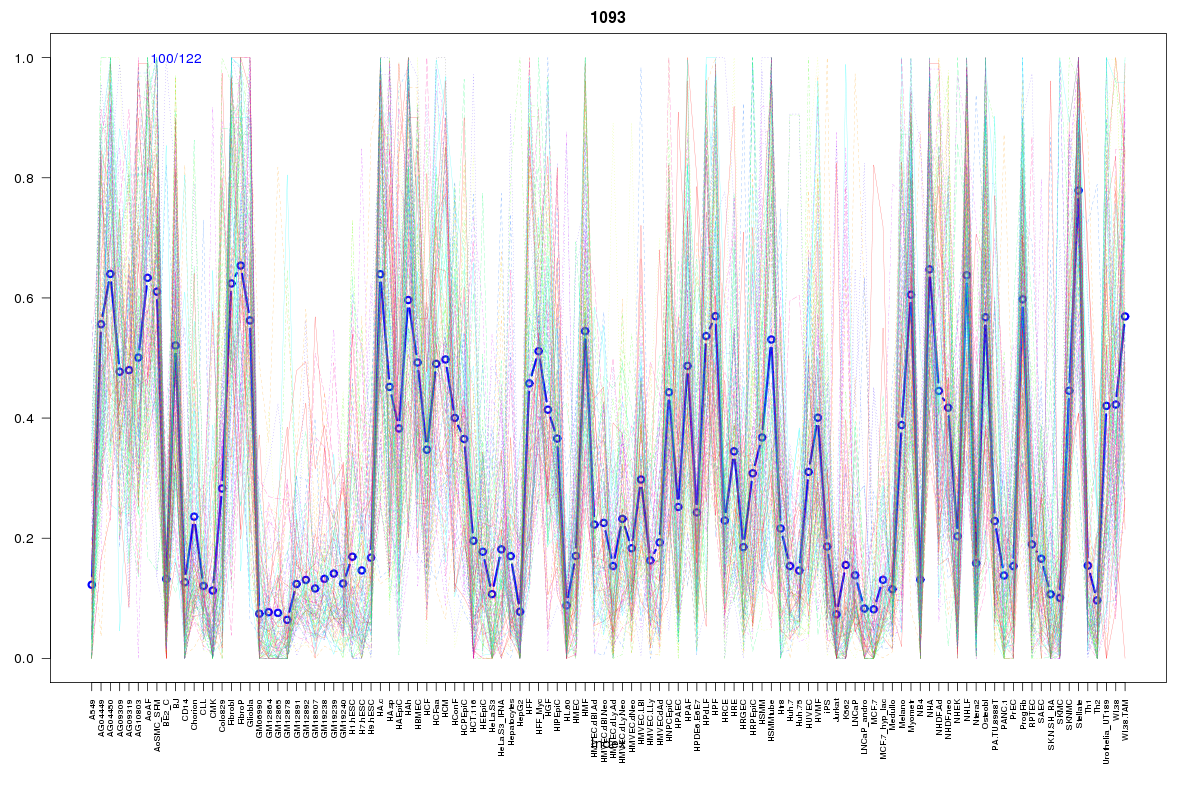 | 1093 | 1 |
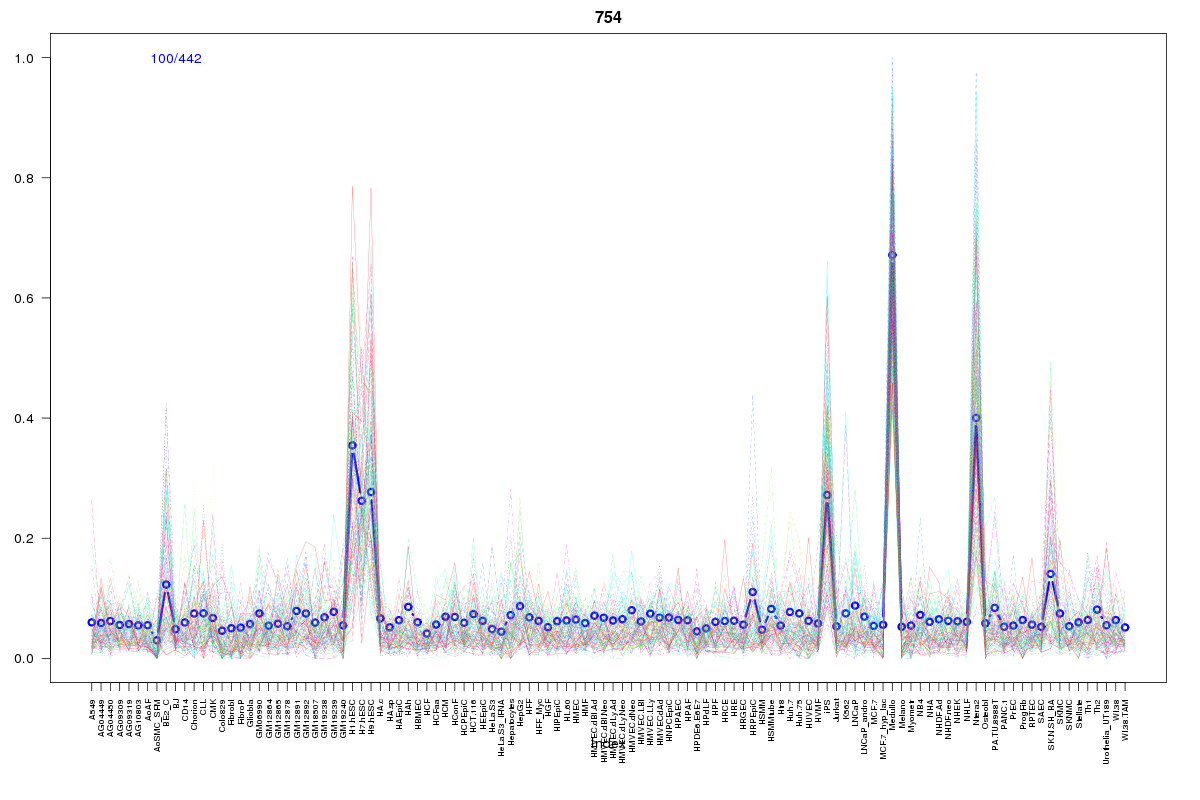 | 754 | 1 |
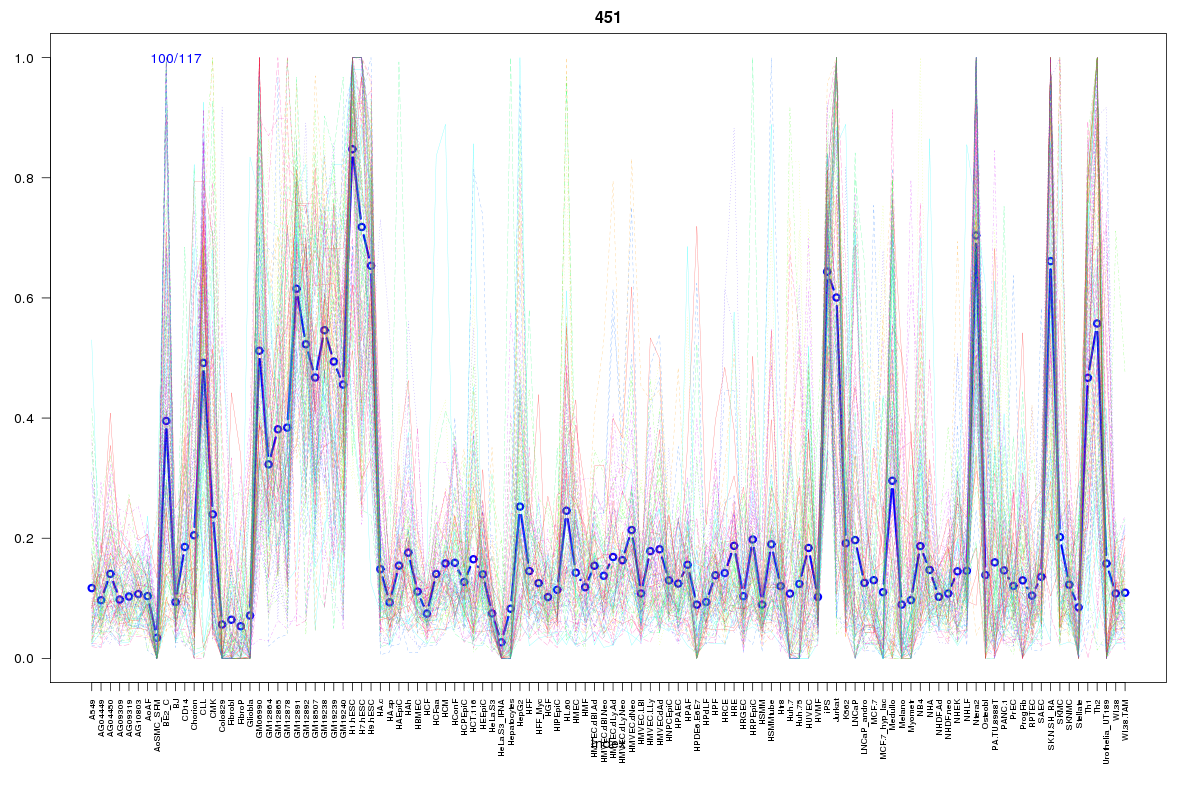 | 451 | 1 |
 | 2122 | 1 |
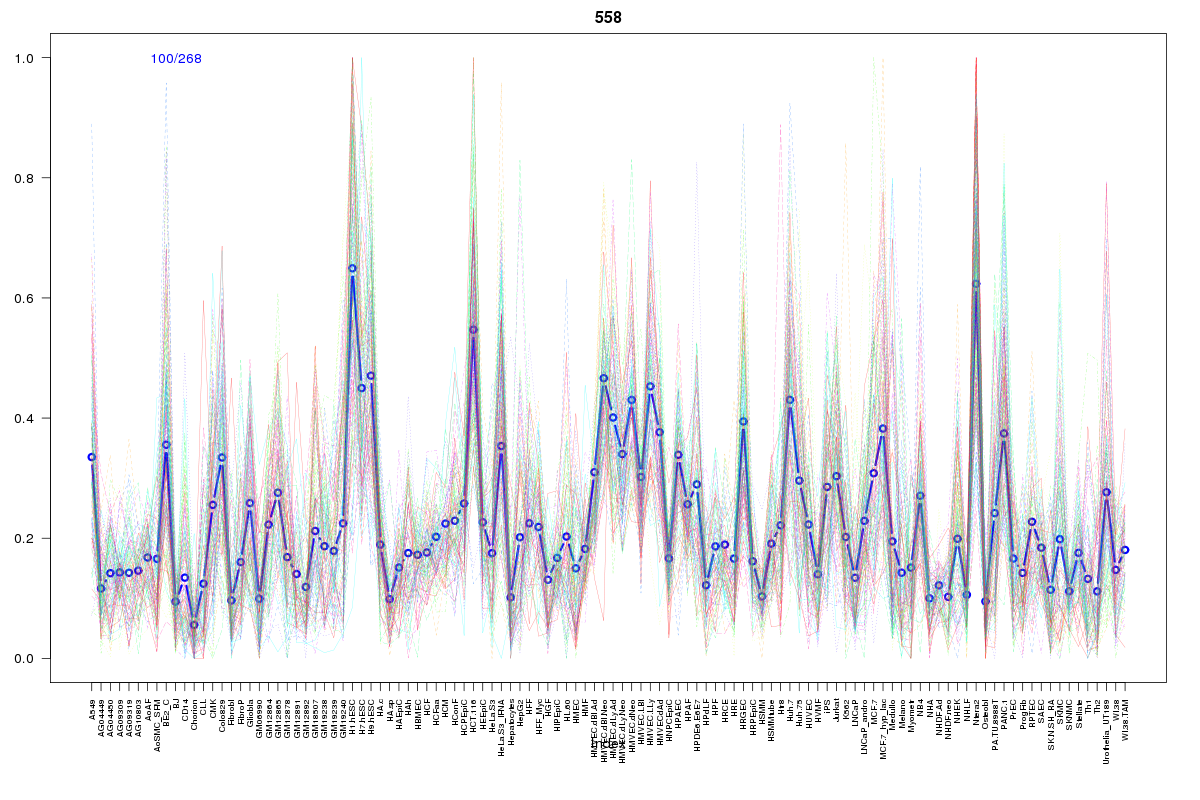 | 558 | 1 |
Resources
BED file downloads
Connects to 26 DHS sitesTop 10 Correlated DHS Sites
p-values indiciate significant higher or lower correlation| Location | Cluster | P-value |
|---|---|---|
| chr1:156251900-156252050 | 1901 | 0.002 |
| chr1:156183340-156183490 | 483 | 0.003 |
| chr1:156326840-156326990 | 389 | 0.003 |
| chr1:156427360-156427510 | 391 | 0.003 |
| chr1:156217585-156217735 | 2279 | 0.005 |
| chr1:156202140-156202290 | 615 | 0.007 |
| chr1:156414280-156414430 | 558 | 0.007 |
| chr1:156415700-156415850 | 243 | 0.008 |
| chr1:156216765-156216915 | 2279 | 0.012 |
| chr1:156216585-156216735 | 1056 | 0.012 |
| chr1:156184045-156184195 | 629 | 0.012 |
External Databases
UCSCEnsembl (ENSG00000163468)