SOM cluster: 421
Cluster Hypersensitivity Profile

Genomic Location Trend
These plots show the distribution of the DHS sites surrounding the Transcript Start Site of the nearest gene.
Stats
Number of sites: 251Promoter: 44%
CpG-Island: 40%
Conserved: 59%
Enriched Motifs & Matches
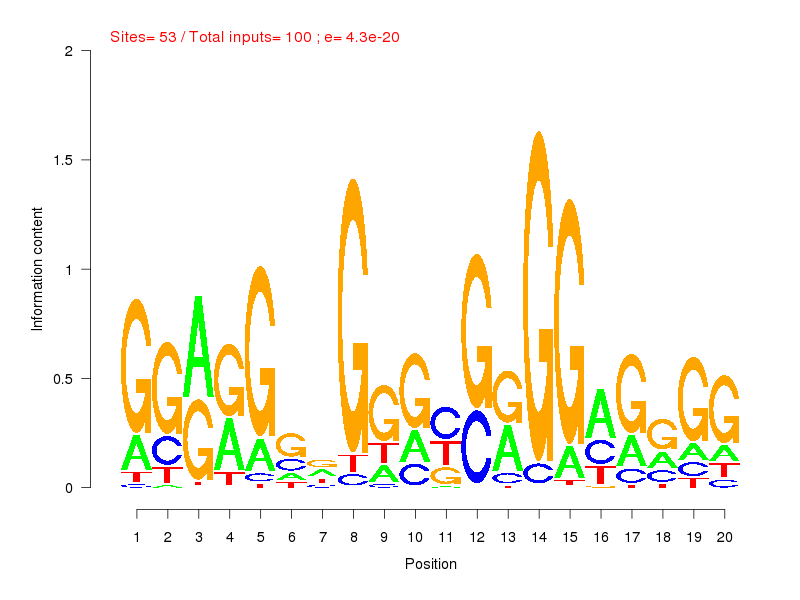
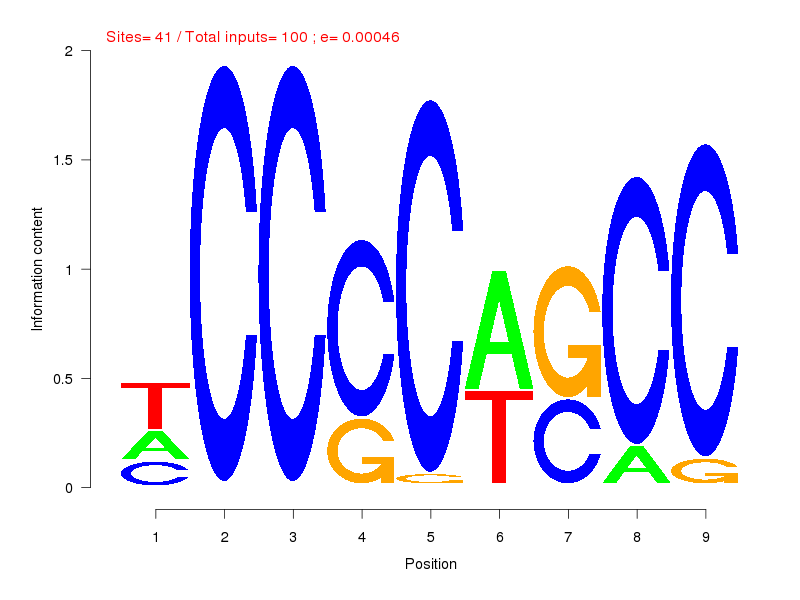
Match Detail: [Jaspar]

| ||
|---|---|---|
| Sites: 53/100 | e-val: 4.3e-20 | ||
| Factor | e-val(match) | DB |
| SP1 | 0.0000001444 | JASPAR |
| RREB1 | 0.0000038462 | JASPAR |
| Pax4 | 0.0000041088 | JASPAR |
| EWSR1-FLI1 | 0.0000054495 | JASPAR |
| Klf4 | 0.00097167 | JASPAR |

| ||
| Sites: 41/100 | e-val: 0.00046 | ||
| Factor | e-val(match) | DB |
| Tal1::Gata1 | 0.00004031 | JASPAR |
| Klf4 | 0.000072818 | JASPAR |
| INSM1 | 0.0001987 | JASPAR |
| SP1 | 0.00027878 | JASPAR |
| MZF1_1-4 | 0.00051779 | JASPAR |

| ||
| Sites: 14/100 | e-val: 0.071 | ||
| Factor | e-val(match) | DB |
| SPI1 | 0.000018719 | JASPAR |
| SPIB | 0.000045076 | JASPAR |
| EWSR1-FLI1 | 0.00093157 | JASPAR |
| FEV | 0.0021045 | JASPAR |
| Stat3 | 0.0034351 | JASPAR |
BED file downloads
Top 10 Example Regions
| Location | Gene Link | Dist. |
|---|---|---|
| chr5: 175815040-175815190 | ARL10 | 45.45 |
| chr9: 37785640-37785790 | EXOSC3 | 47.51 |
| chr9: 37785640-37785790 | TRMT10B | 47.51 |
| chr3: 45730020-45730170 | LIMD1-AS1 | 50.97 |
| chr1: 45205605-45205755 | RPS8 | 54.48 |
| chr1: 45205605-45205755 | SNORD38B | 54.48 |
| chr1: 45205605-45205755 | KIF2C | 54.48 |
| chr1: 45205605-45205755 | BTBD19 | 54.48 |
| chr1: 45205605-45205755 | TCTEX1D4 | 54.48 |
| chr1: 45205605-45205755 | RP11-269F19.2 | 54.48 |