SOM cluster: 1093
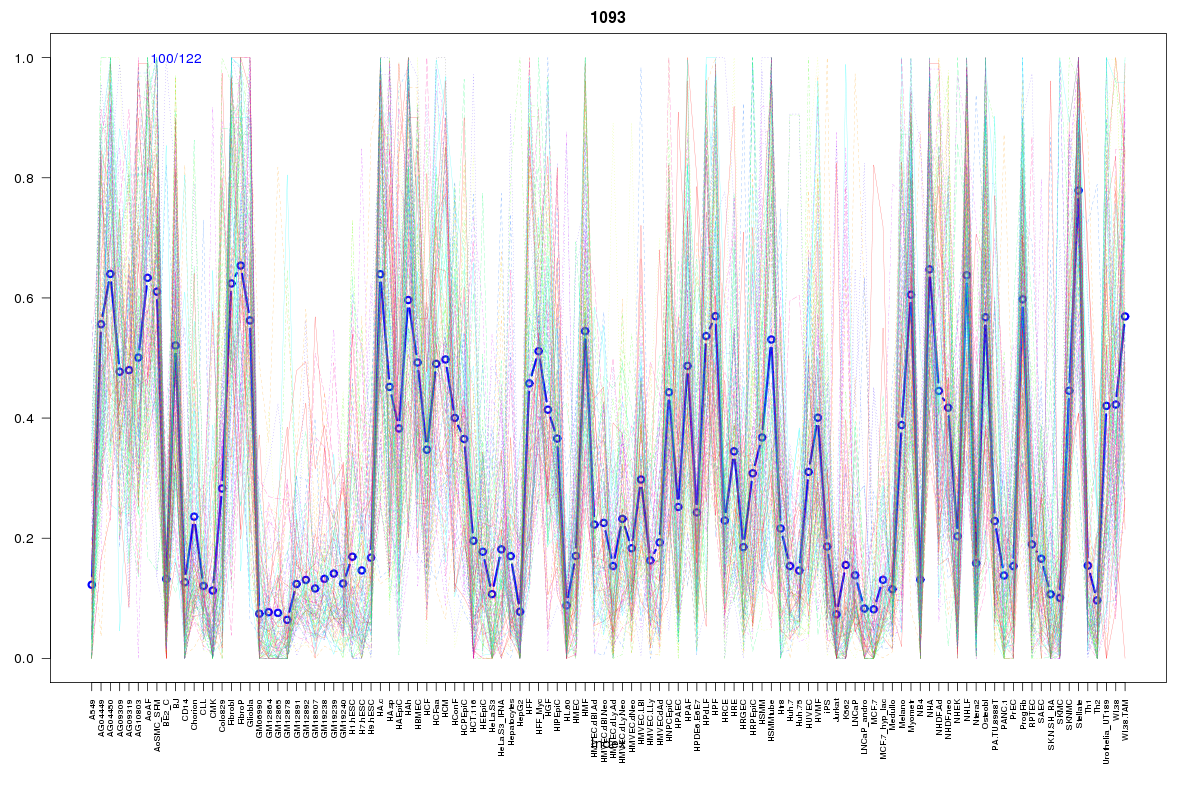
Cluster Hypersensitivity Profile

Genomic Location Trend
These plots show the distribution of the DHS sites surrounding the Transcript Start Site of the nearest gene.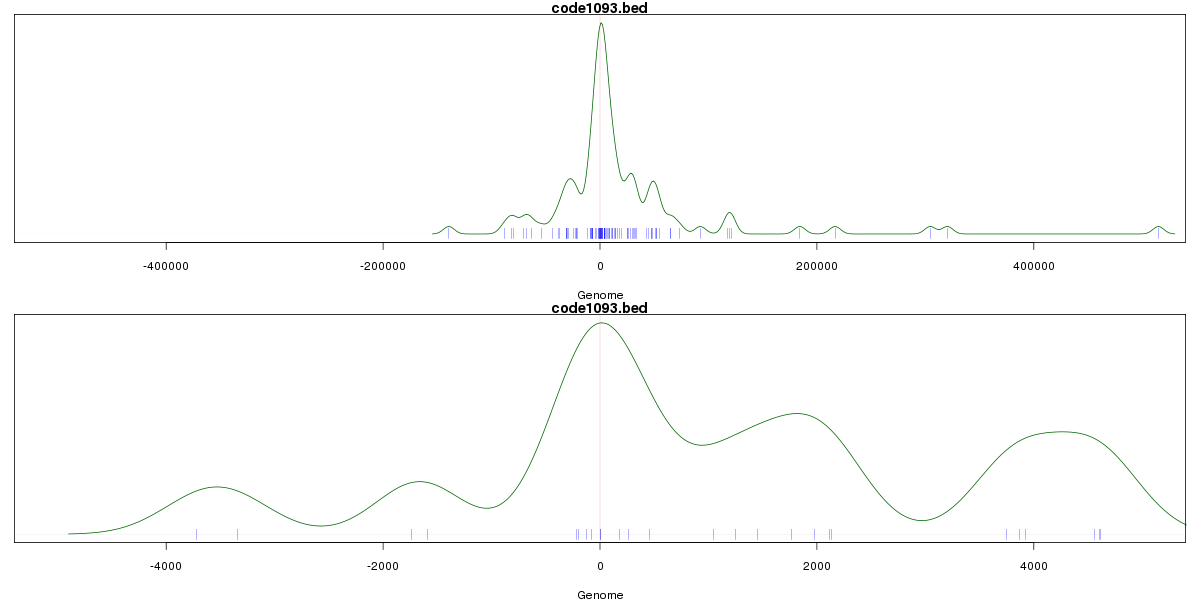
Stats
Number of sites: 122Promoter: 8%
CpG-Island: 8%
Conserved: 50%
Enriched Motifs & Matches
Match Detail: [Jaspar]
|
| ||
|---|---|---|
| Sites: 45/100 | e-val: 0.000000000076 | ||
| Factor | e-val(match) | DB |
| SP1 | 0.00000000040115 | JASPAR |
| Pax4 | 0.000095545 | JASPAR |
| Tal1::Gata1 | 0.00051776 | JASPAR |
| RREB1 | 0.00087089 | JASPAR |
| PLAG1 | 0.0065183 | JASPAR |
|
| ||
| Sites: 23/100 | e-val: 0.000062 | ||
| Factor | e-val(match) | DB |
| Myf | 0.000059091 | JASPAR |
| SPI1 | 0.00091236 | JASPAR |
| NHLH1 | 0.0014932 | JASPAR |
| SPIB | 0.0028974 | JASPAR |
| SP1 | 0.003454 | JASPAR |
|
| ||
| Sites: 14/100 | e-val: 0.49 | ||
| Factor | e-val(match) | DB |
| Foxq1 | 0.000051829 | JASPAR |
| FOXA1 | 0.00037676 | JASPAR |
| Foxa2 | 0.00046253 | JASPAR |
| FOXI1 | 0.00082823 | JASPAR |
| Foxd3 | 0.0039738 | JASPAR |
BED file downloads
Top 10 Example Regions
| Location | Gene Link | Dist. |
|---|---|---|
| chr8: 103742220-103742370 | KB-1732A1.1 | 43.39 |
| chr9: 130284060-130284210 | STXBP1 | 46.66 |
| chr9: 130284060-130284210 | LRSAM1 | 46.66 |
| chr9: 130284060-130284210 | RPL12 | 46.66 |
| chr9: 130284060-130284210 | FAM129B | 46.66 |
| chr9: 130284060-130284210 | SNORA65 | 46.66 |
| chr8: 43046680-43046830 | HGSNAT | 47.06 |
| chr22: 36731380-36731530 | MYH9 | 57.13 |
| chr1: 230985185-230985335 | C1orf198 | 62.21 |
| chr1: 230985185-230985335 | CAPN9 | 62.21 |