SOM cluster: 754
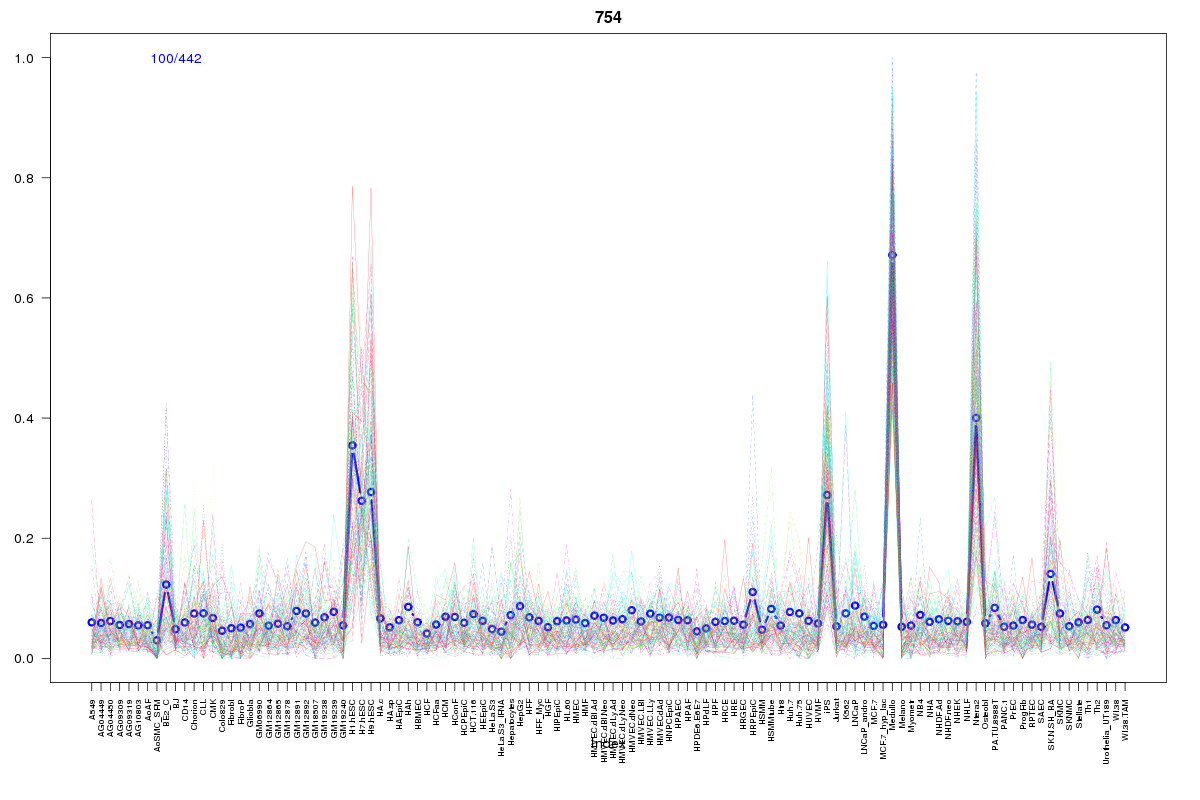
Cluster Hypersensitivity Profile

Genomic Location Trend
These plots show the distribution of the DHS sites surrounding the Transcript Start Site of the nearest gene.
Stats
Number of sites: 442Promoter: 9%
CpG-Island: 10%
Conserved: 53%
Enriched Motifs & Matches
Match Detail: [Jaspar]
|
| ||
|---|---|---|
| Sites: 47/100 | e-val: 1.6e-27 | ||
| Factor | e-val(match) | DB |
| SP1 | 0.00000001781 | JASPAR |
| Pax4 | 0.0000047969 | JASPAR |
| MZF1_5-13 | 0.0018081 | JASPAR |
| RXR::RAR_DR5 | 0.0041451 | JASPAR |
| EWSR1-FLI1 | 0.0047892 | JASPAR |
|
| ||
| Sites: 30/100 | e-val: 0.00000014 | ||
| Factor | e-val(match) | DB |
| Myf | 0.000012083 | JASPAR |
| NHLH1 | 0.0001531 | JASPAR |
| SP1 | 0.0045722 | JASPAR |
| REST | 0.034346 | JASPAR |
| NFE2L2 | 0.043501 | JASPAR |
|
| ||
| Sites: 11/100 | e-val: 0.26 | ||
| Factor | e-val(match) | DB |
| PLAG1 | 0.00000029123 | JASPAR |
| ESR1 | 0.00010983 | JASPAR |
| SP1 | 0.00014555 | JASPAR |
| ESR2 | 0.00093215 | JASPAR |
| Zfp423 | 0.0012118 | JASPAR |
BED file downloads
Top 10 Example Regions
| Location | Gene Link | Dist. |
|---|---|---|
| chr9: 137962205-137962355 | OLFM1 | 42.57 |
| chr1: 203008325-203008475 | CYB5R1 | 44.57 |
| chr11: 17434460-17434610 | KCNJ11 | 51.5 |
| chr11: 17434460-17434610 | SDHCP4 | 51.5 |
| chr11: 17434460-17434610 | ABCC8 | 51.5 |
| chr3: 36845860-36846010 | DCLK3 | 51.82 |
| chr3: 36845860-36846010 | TRANK1 | 51.82 |
| chr2: 105484140-105484290 | POU3F3 | 54.82 |
| chr2: 105484140-105484290 | LINC01158 | 54.82 |
| chr5: 63255520-63255670 | HTR1A | 55.98 |