Gene: TOR2A
chr9: 130493802-130497596Expression Profile
(log scale)
Graphical Connections
Distribution of linked clusters:
You may find it interesting if many of the connected DHS sites belong to the same cluster.| Cluster Profile | Cluster ID | Number of DHS sites in this cluster |
|---|---|---|
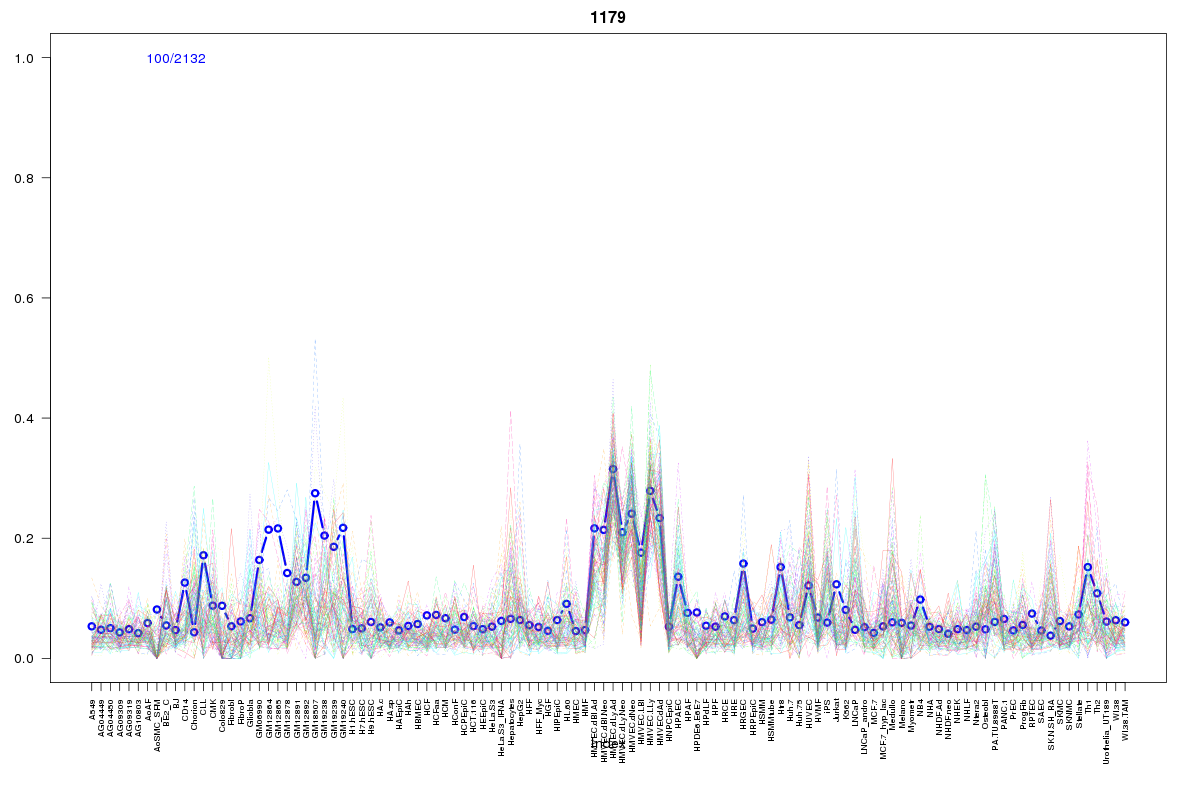 | 1179 | 5 |
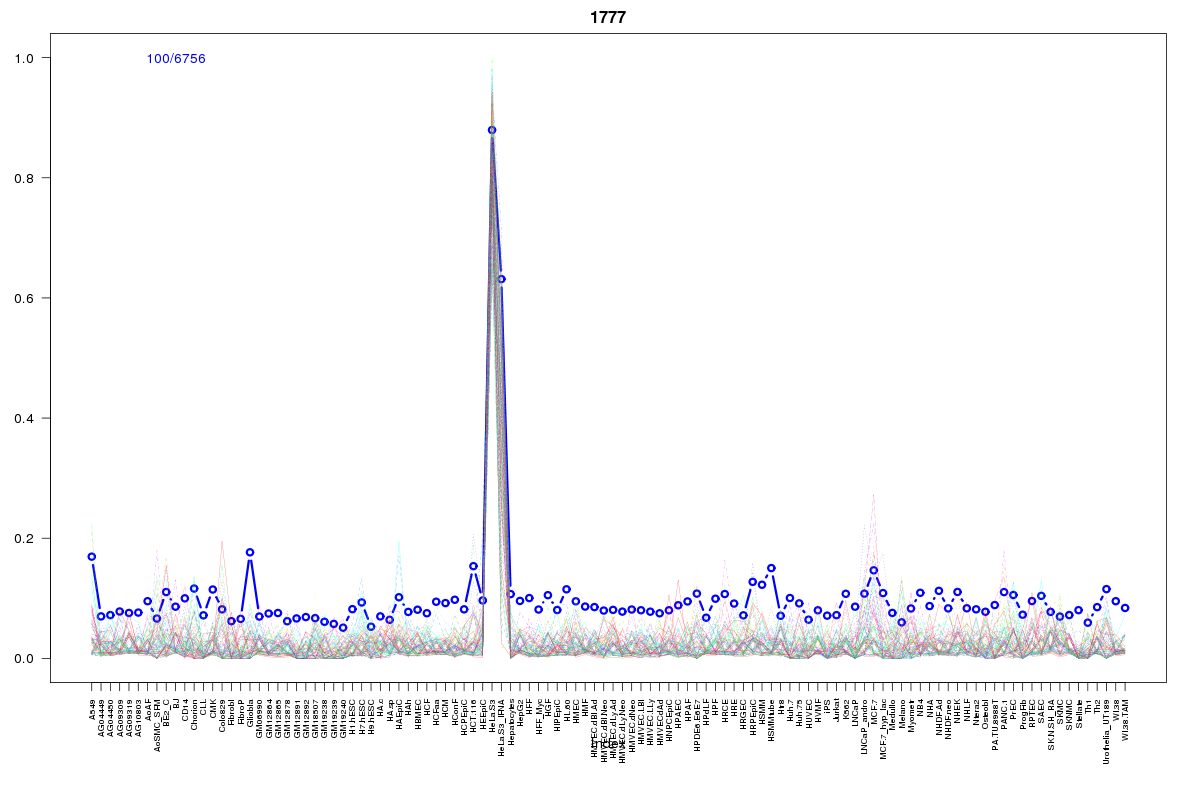 | 1777 | 4 |
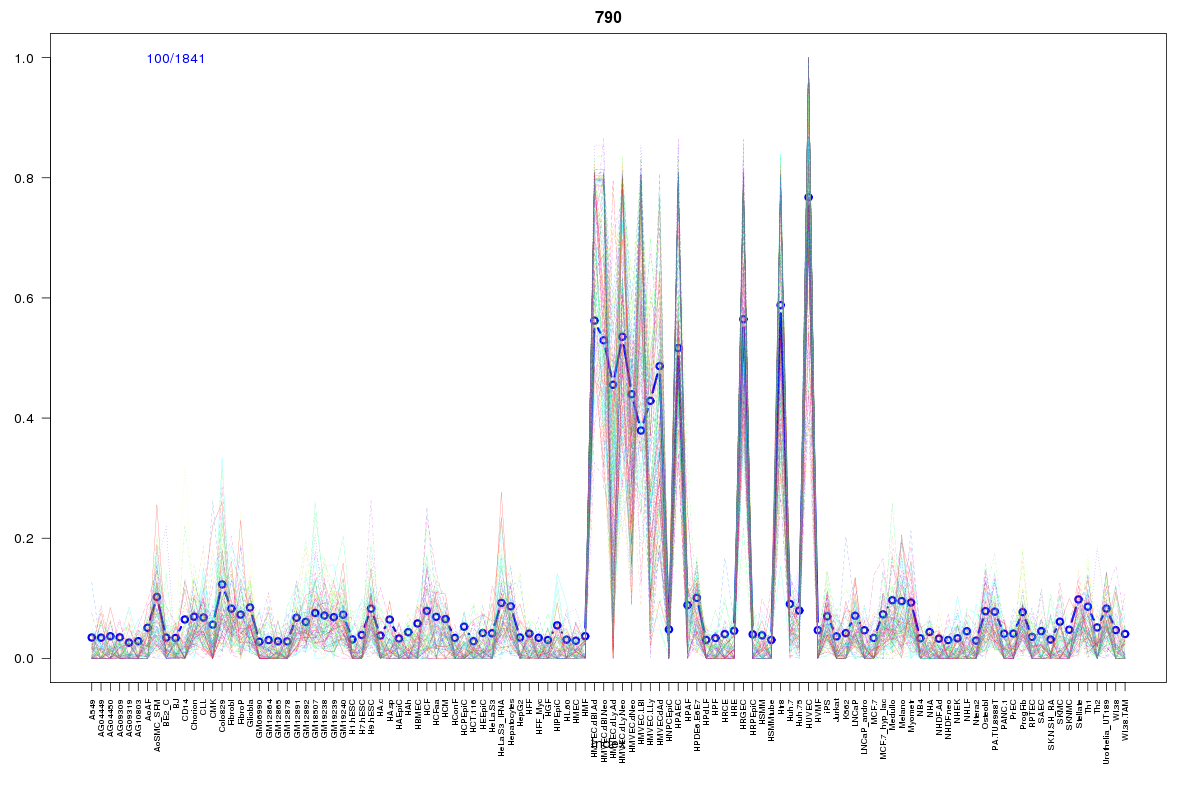 | 790 | 4 |
 | 935 | 4 |
 | 2114 | 3 |
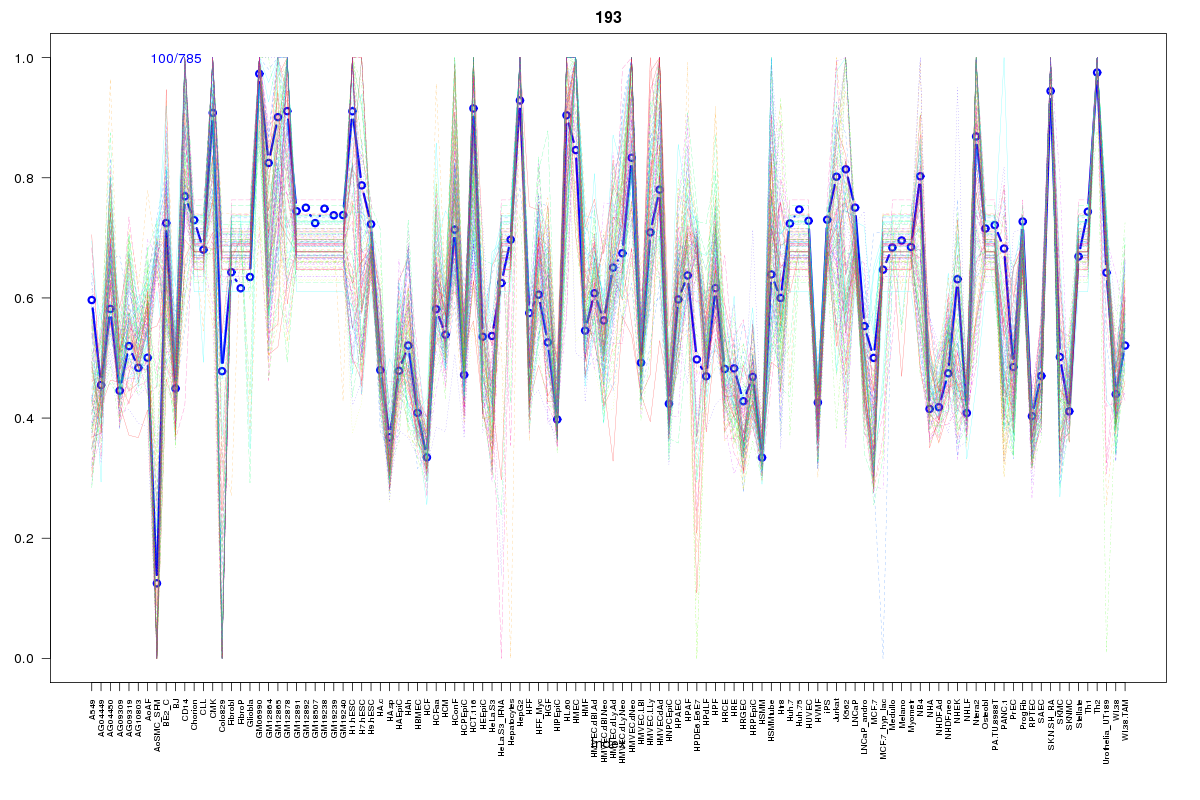 | 193 | 2 |
 | 1724 | 2 |
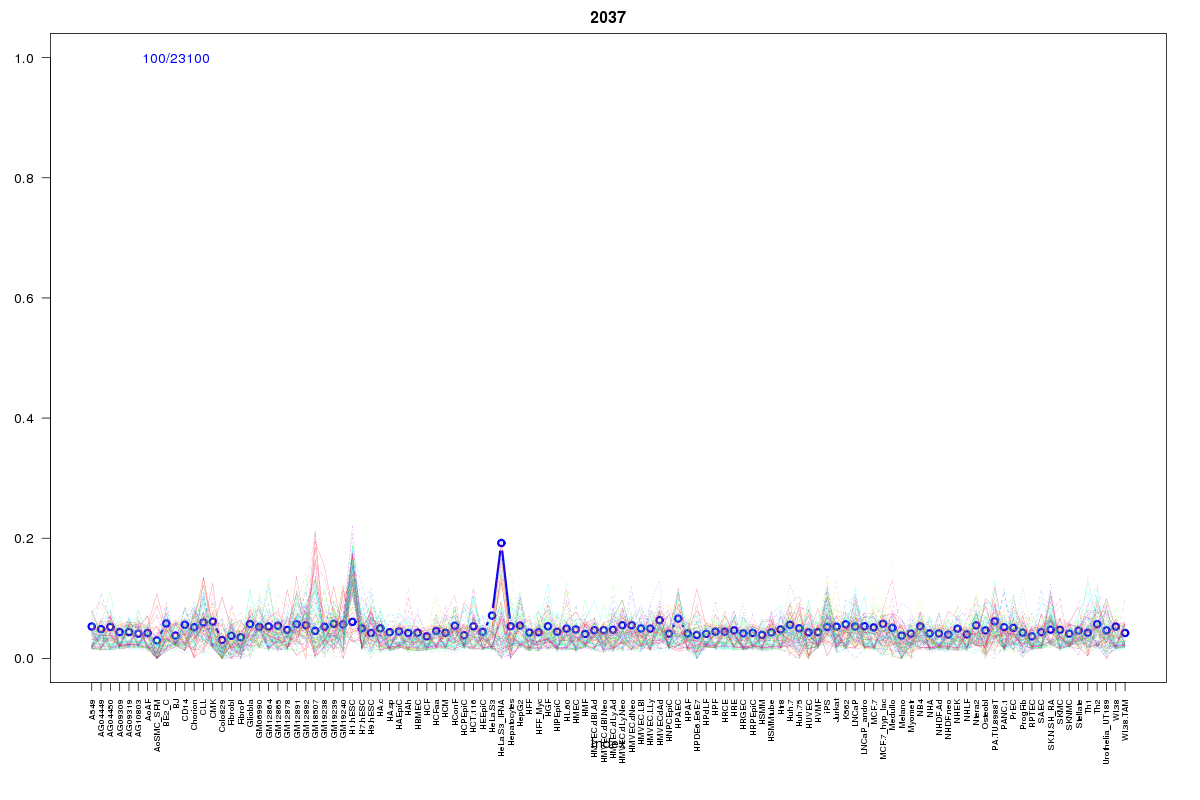 | 2037 | 2 |
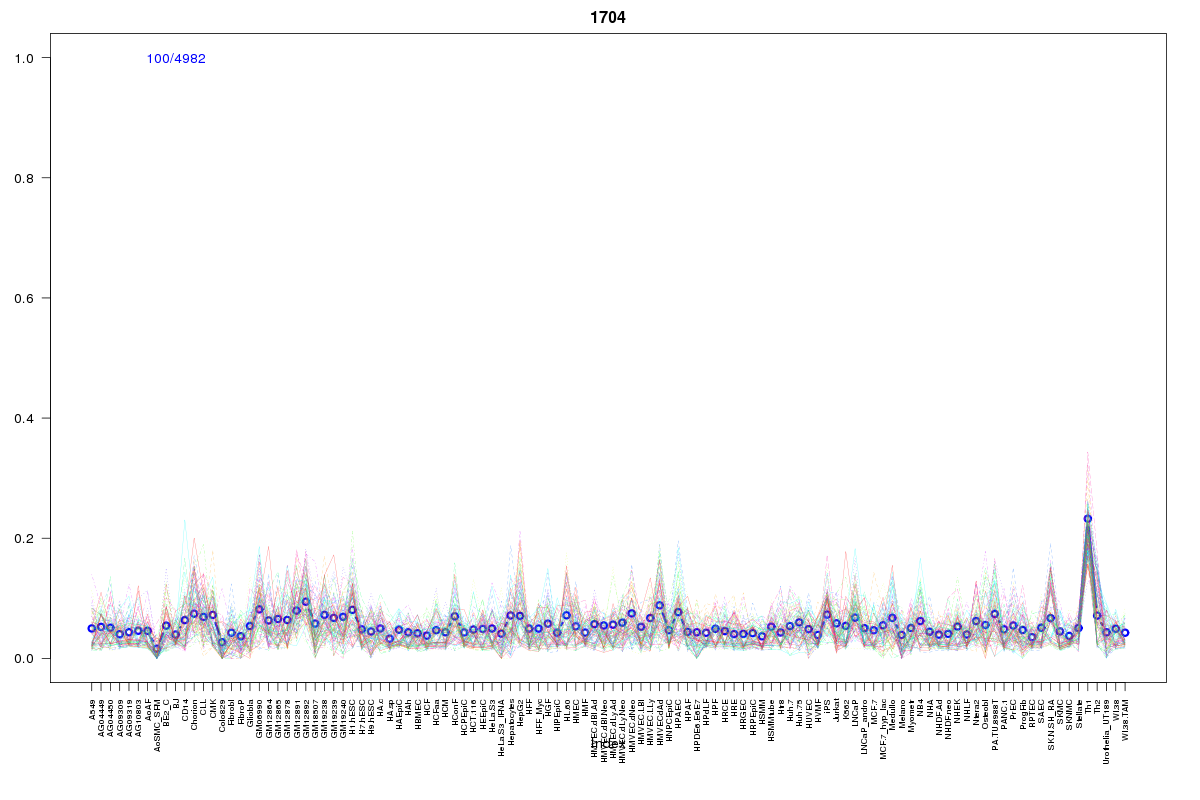 | 1704 | 2 |
 | 979 | 2 |
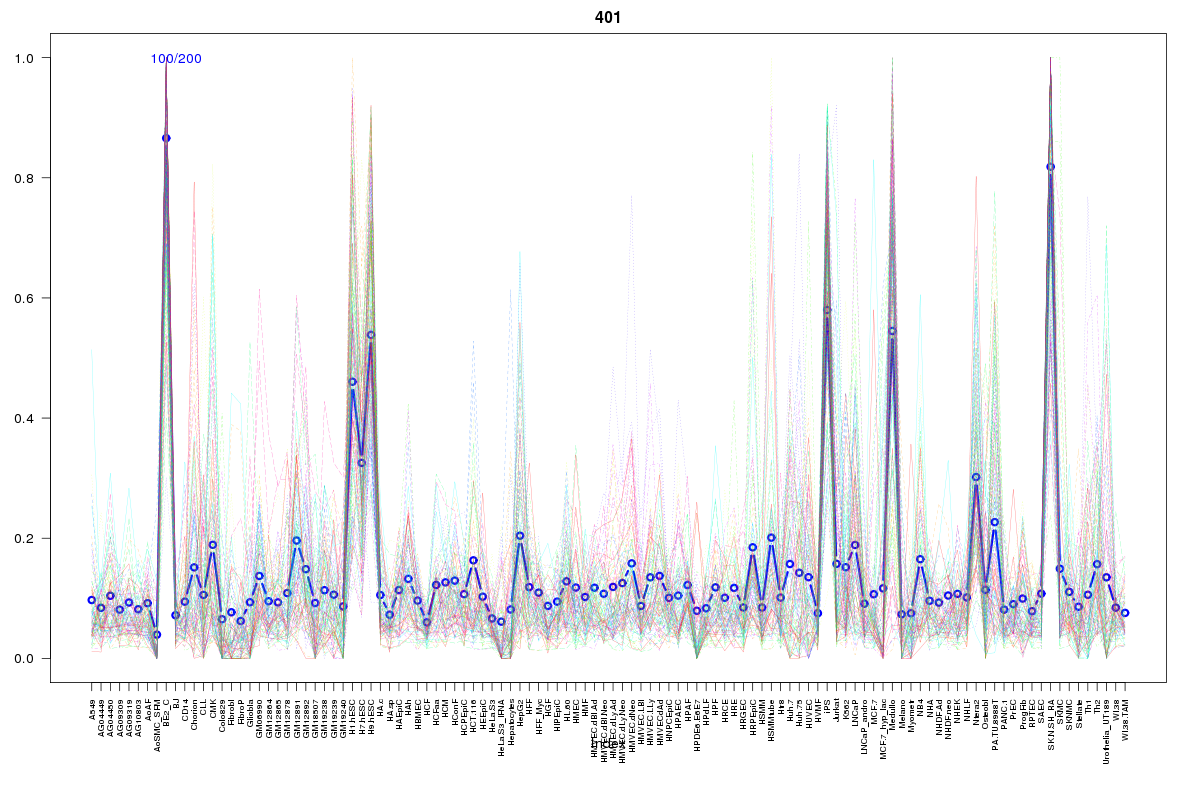 | 401 | 1 |
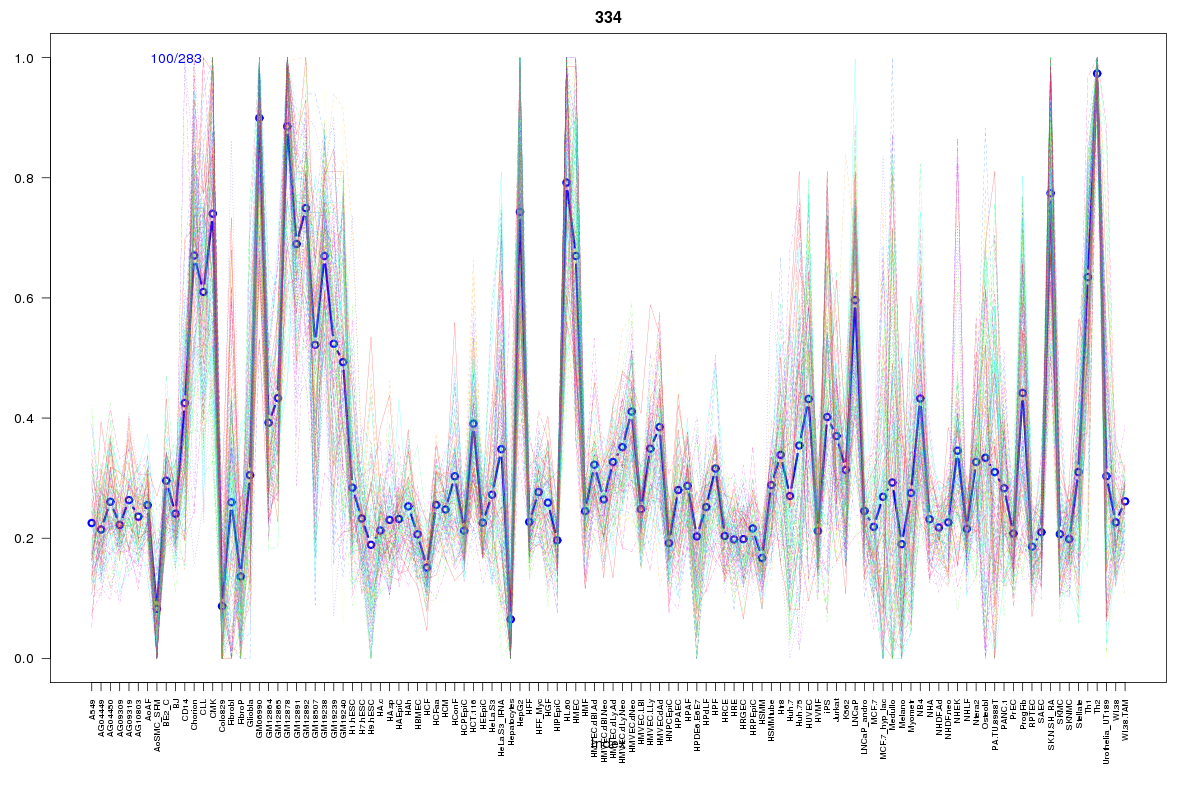 | 334 | 1 |
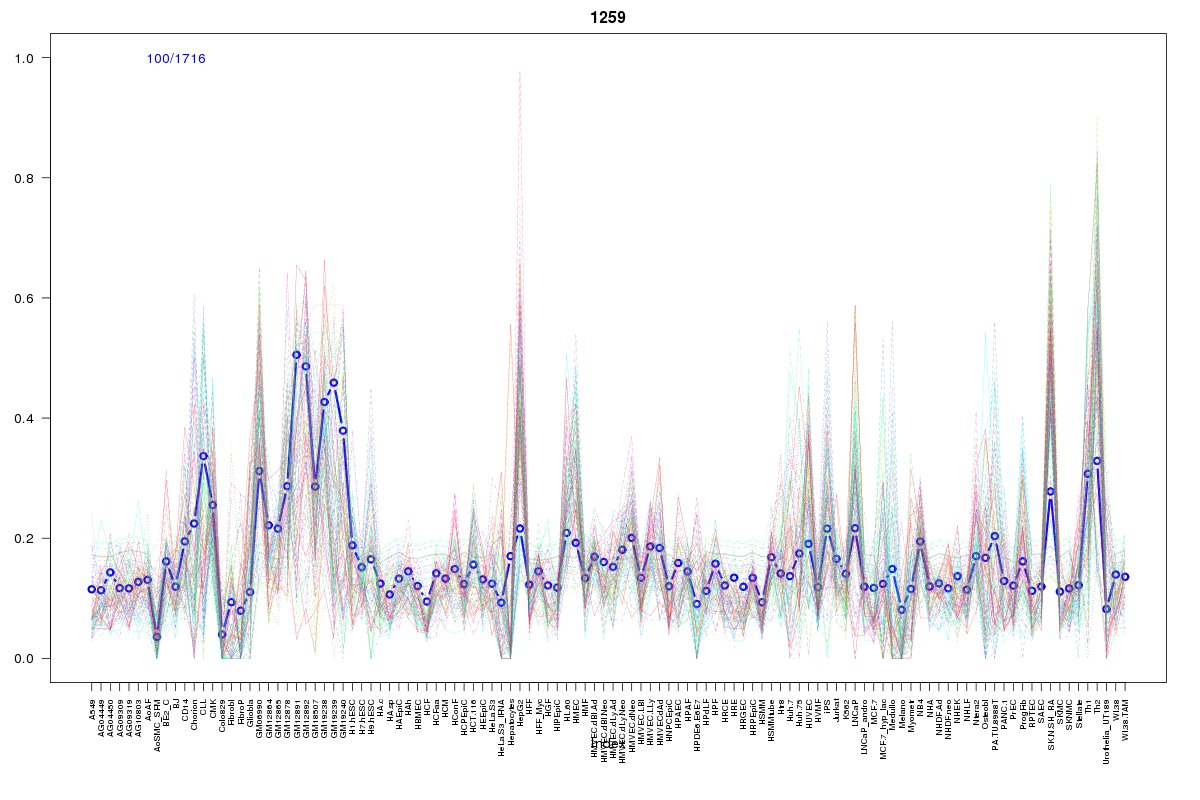 | 1259 | 1 |
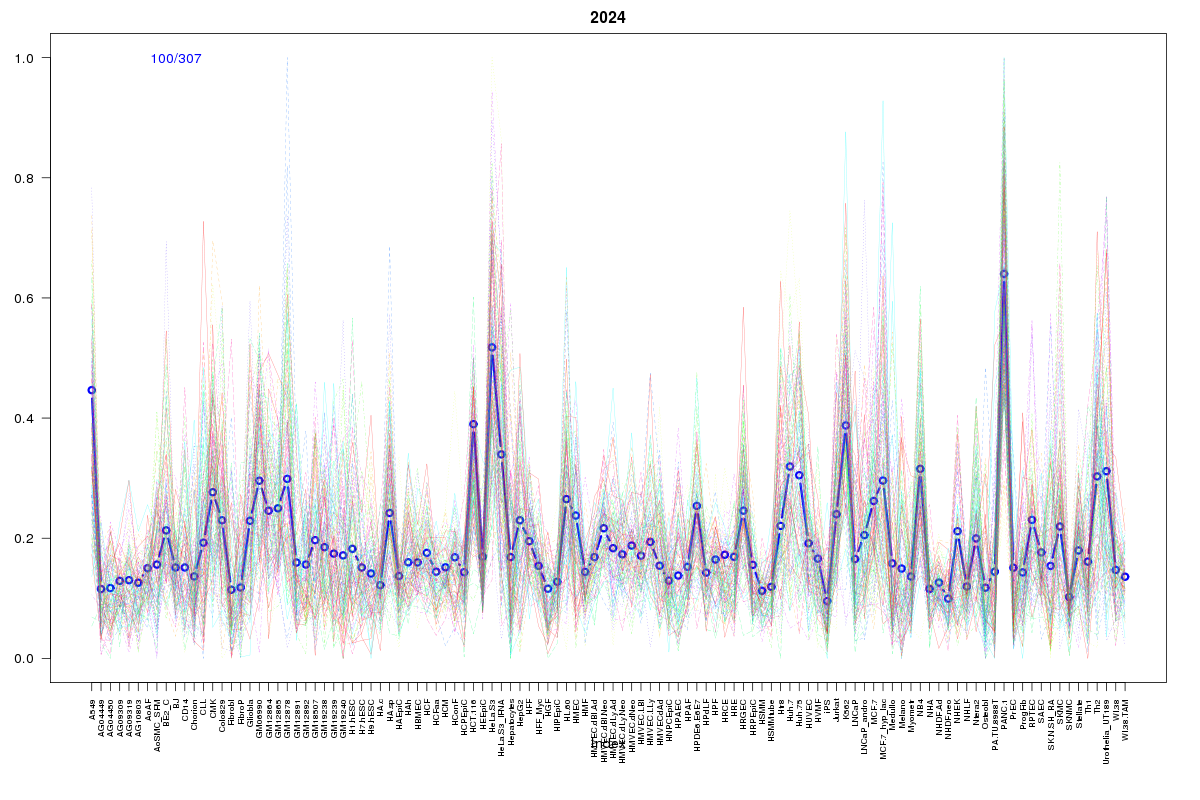 | 2024 | 1 |
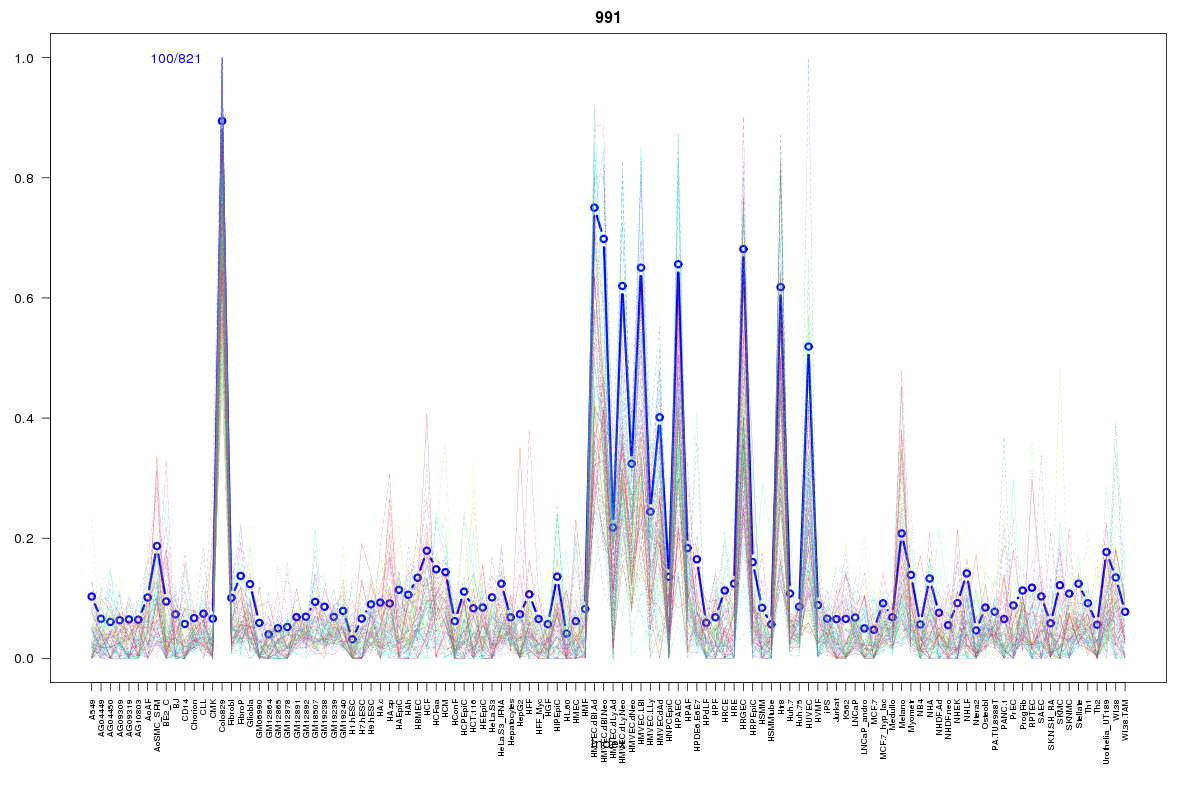 | 991 | 1 |
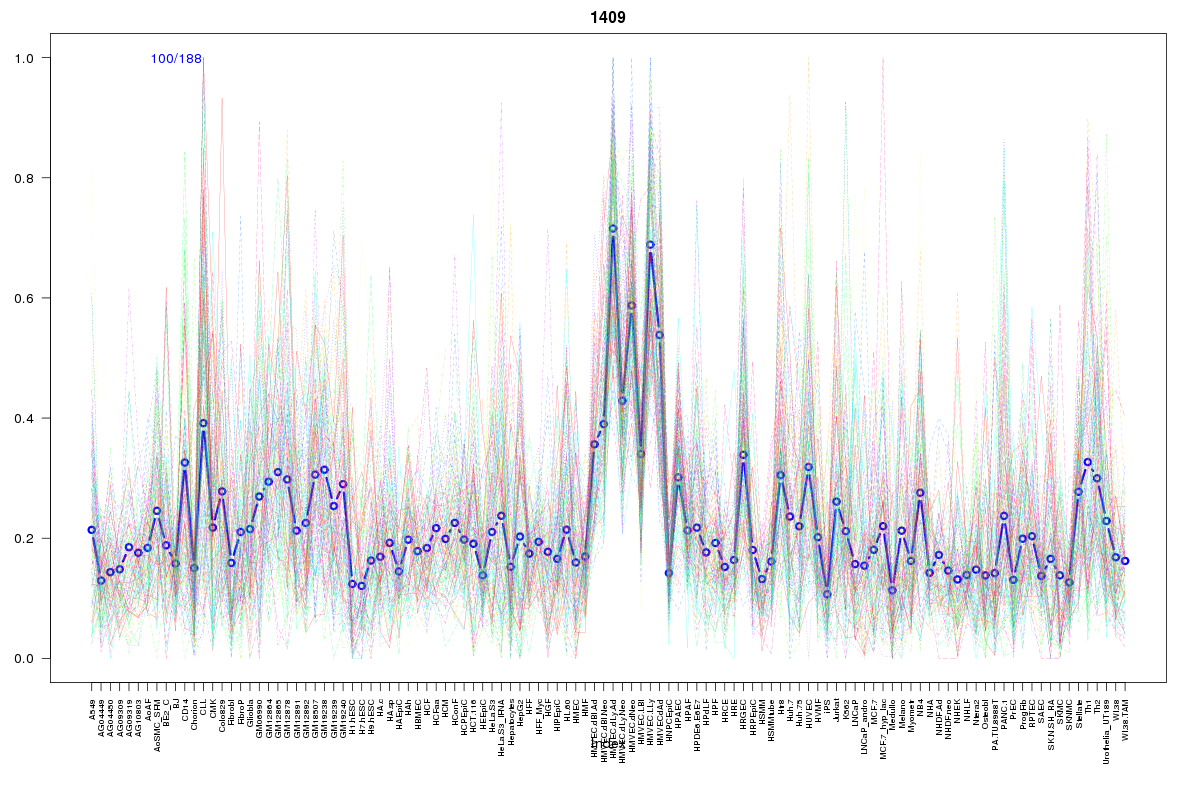 | 1409 | 1 |
 | 2218 | 1 |
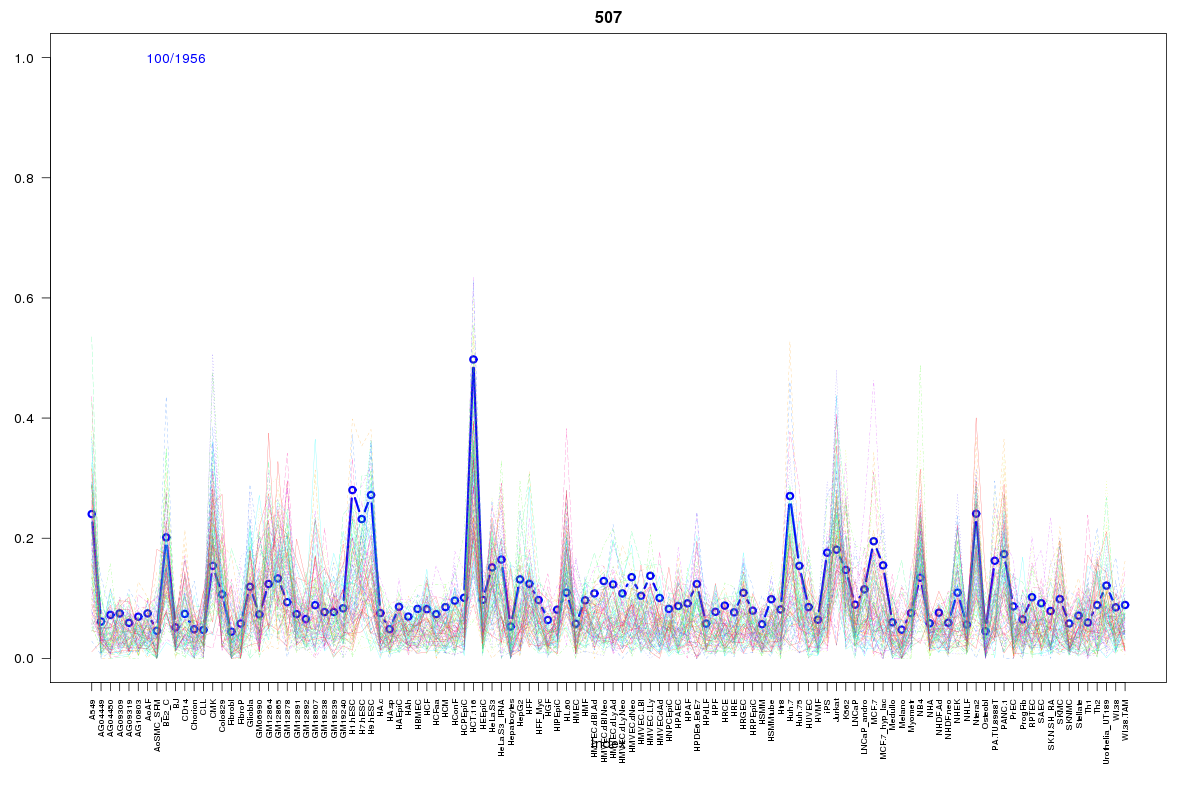 | 507 | 1 |
 | 919 | 1 |
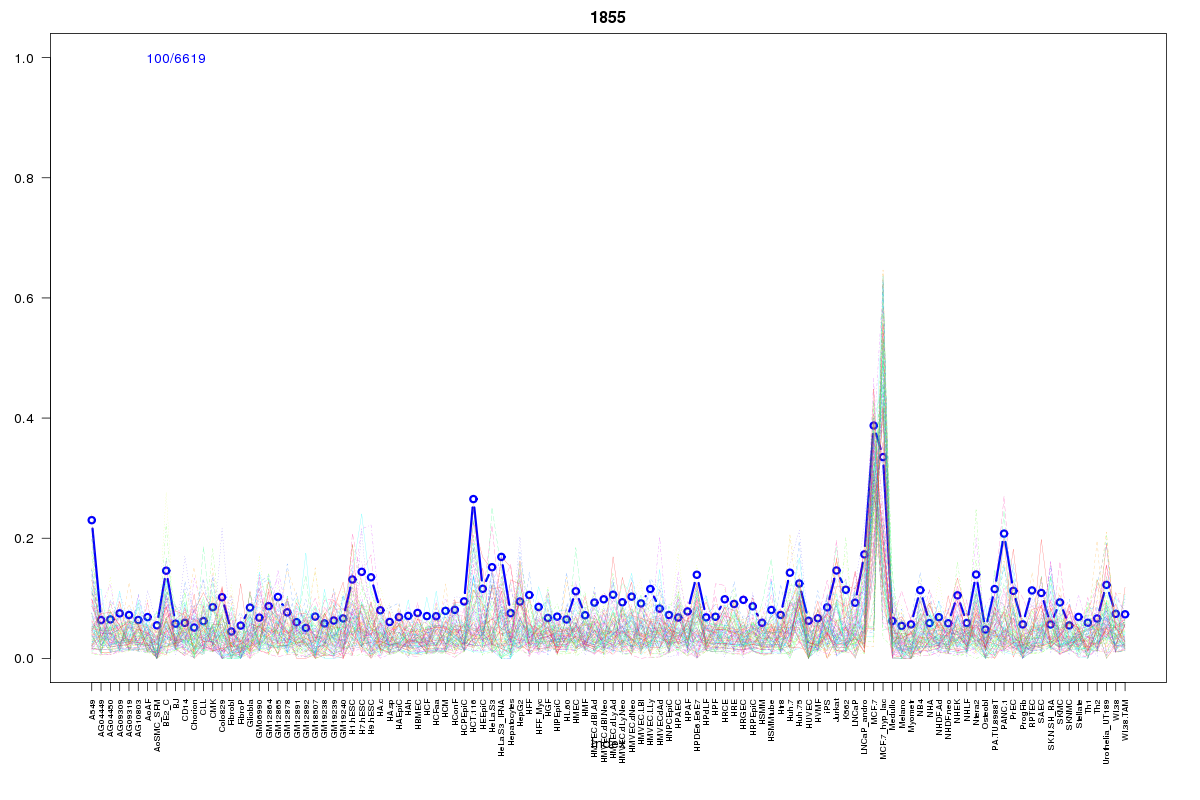 | 1855 | 1 |
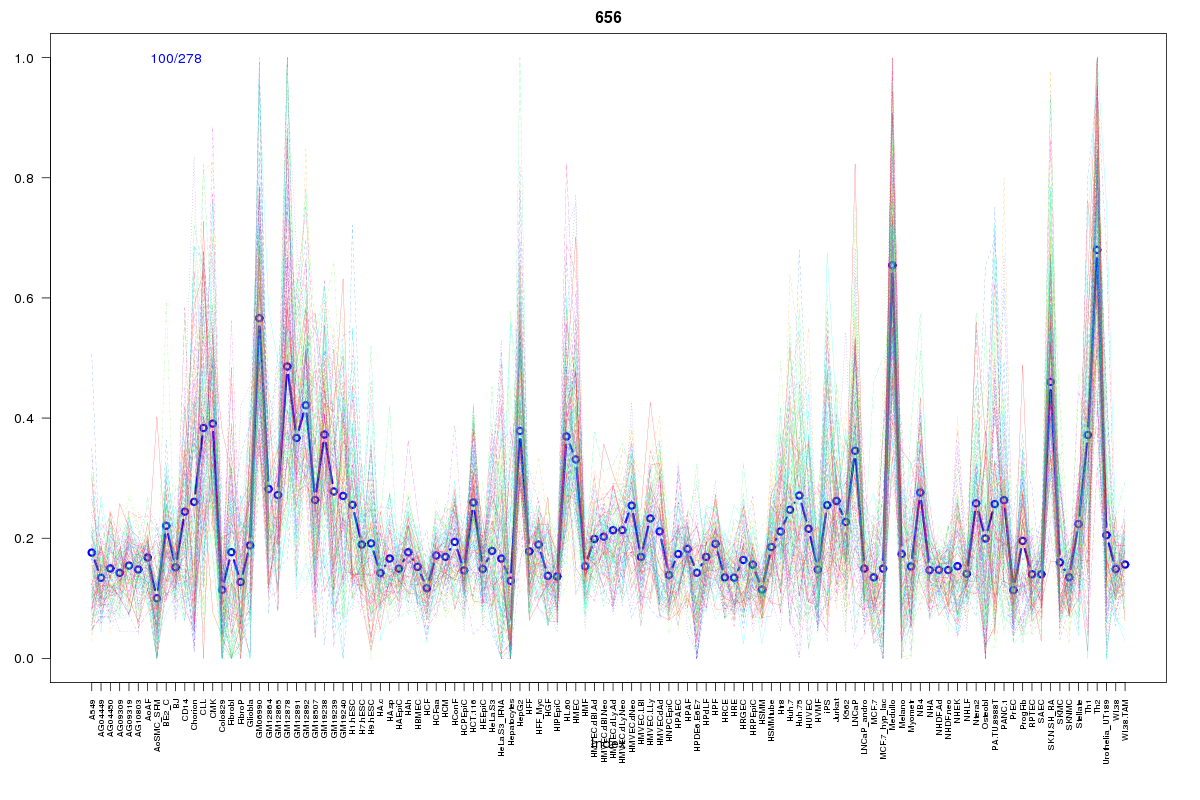 | 656 | 1 |
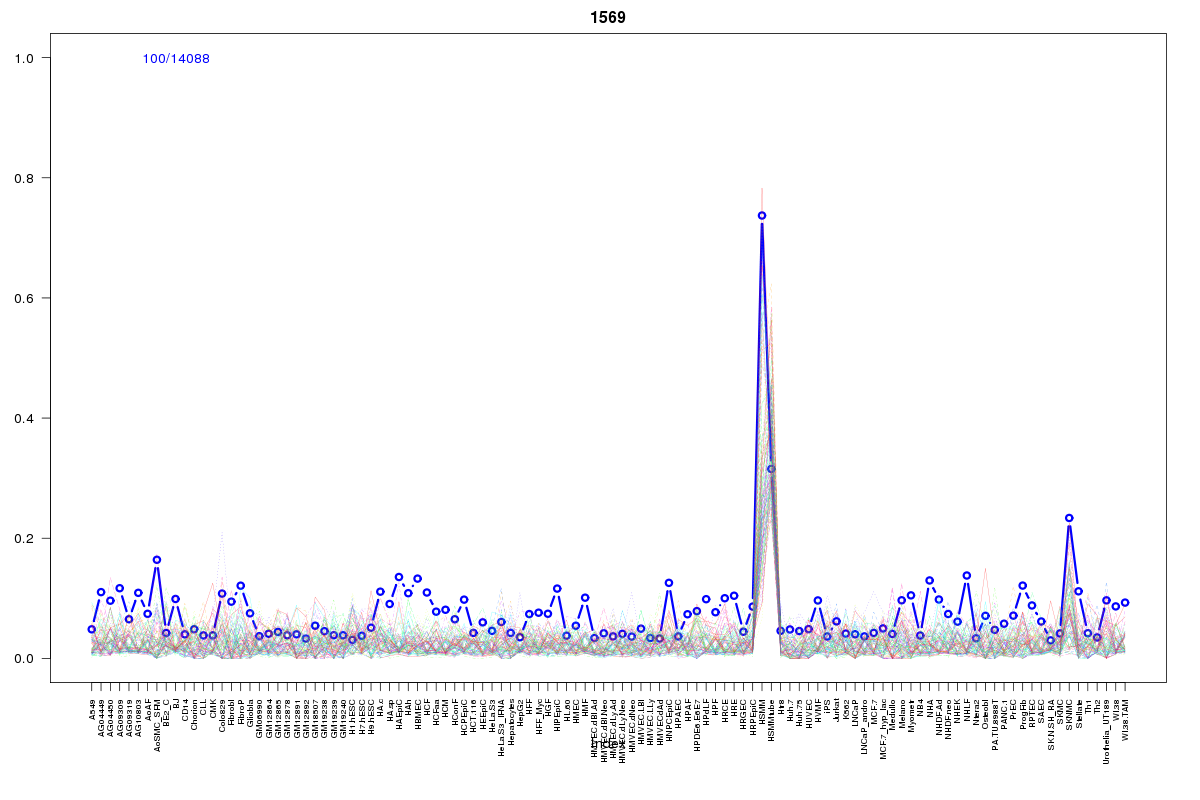 | 1569 | 1 |
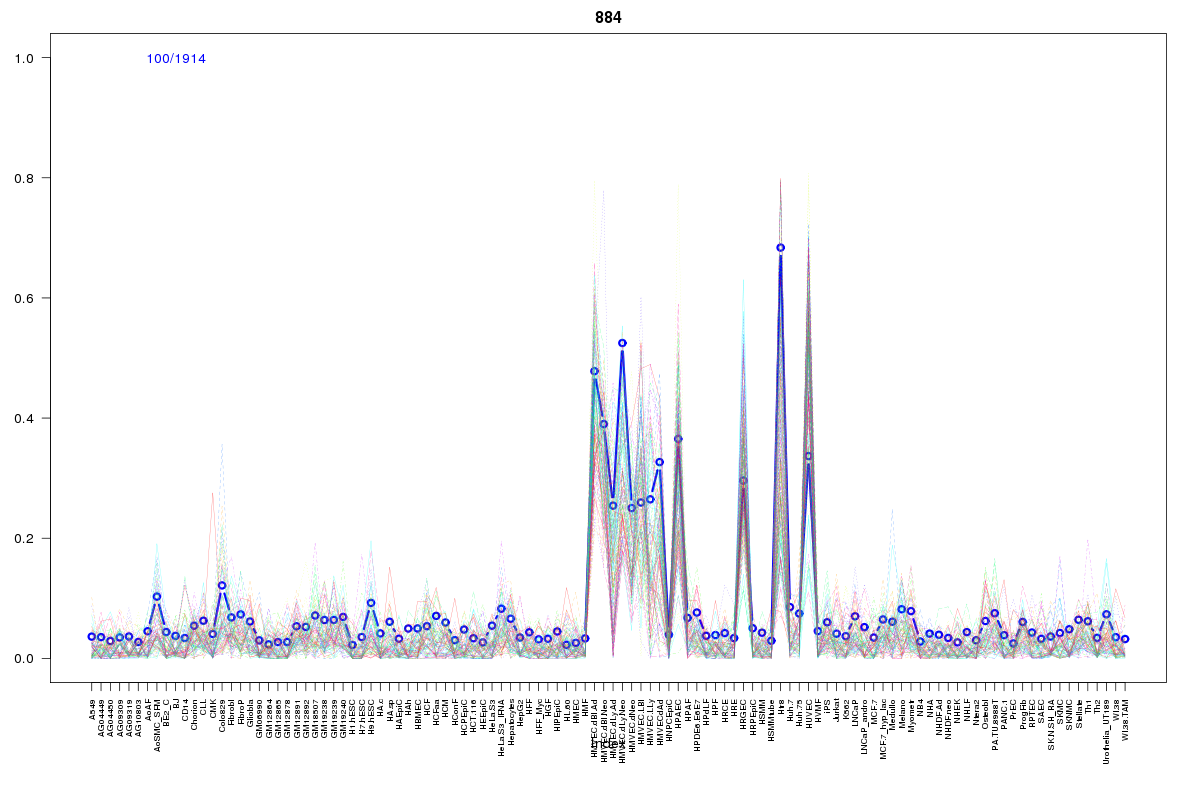 | 884 | 1 |
 | 1401 | 1 |
 | 416 | 1 |
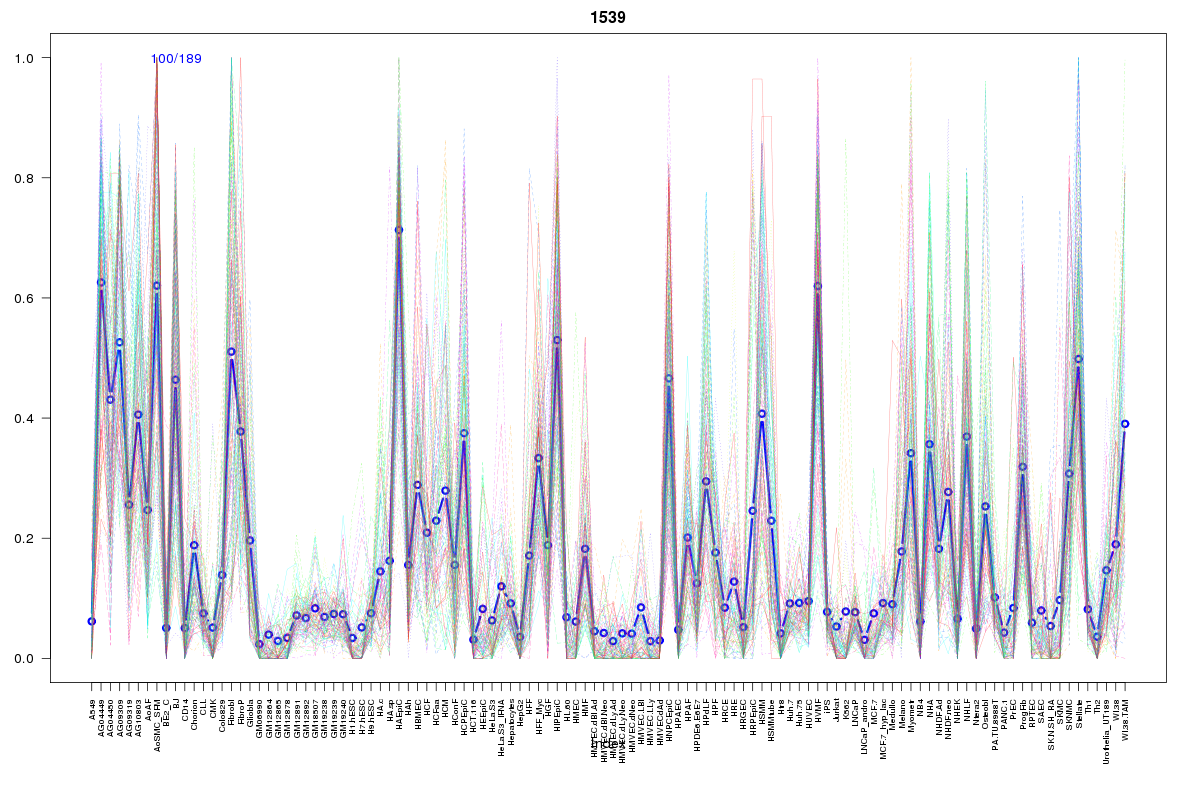 | 1539 | 1 |
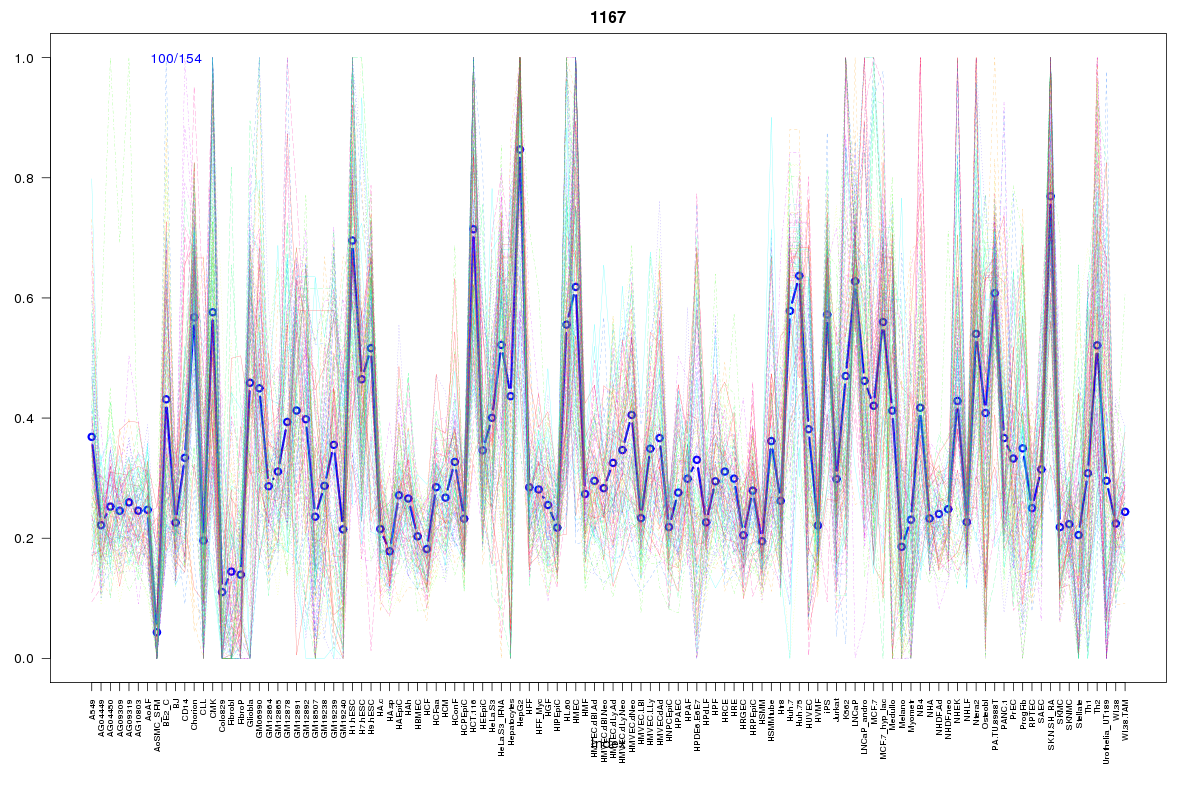 | 1167 | 1 |
 | 1319 | 1 |
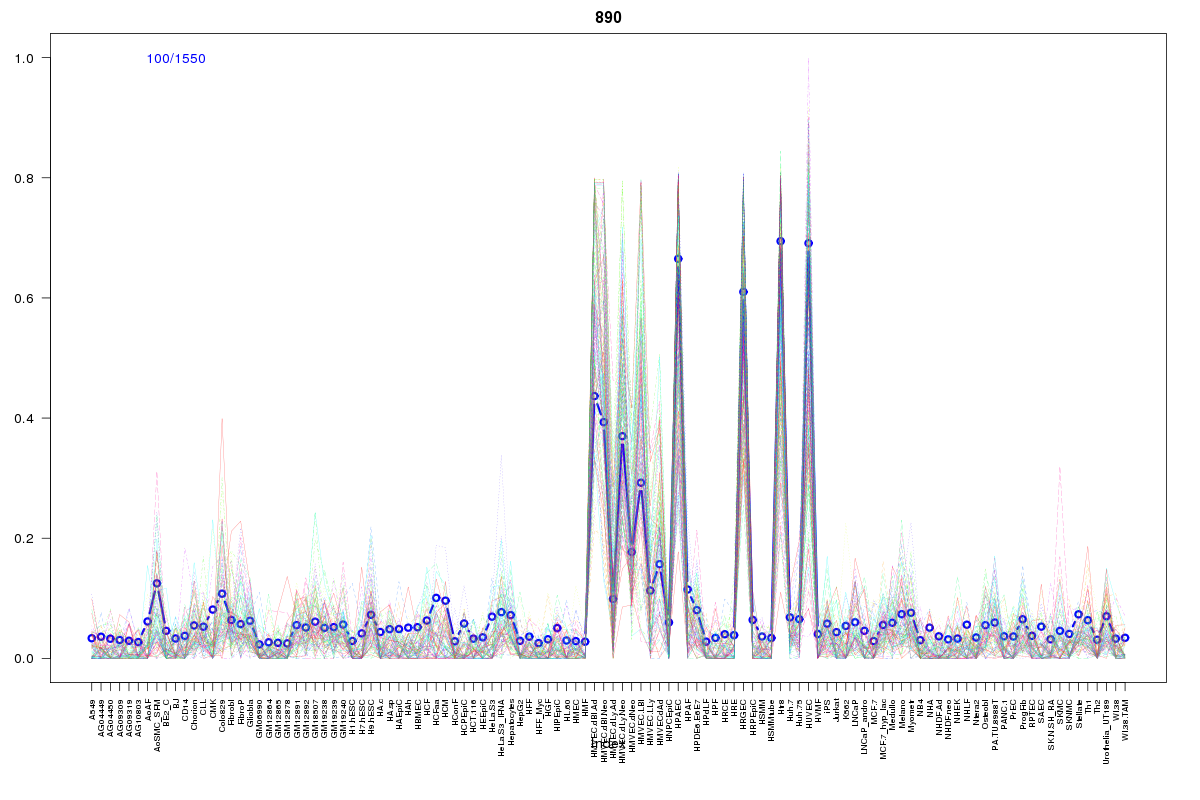 | 890 | 1 |
 | 469 | 1 |
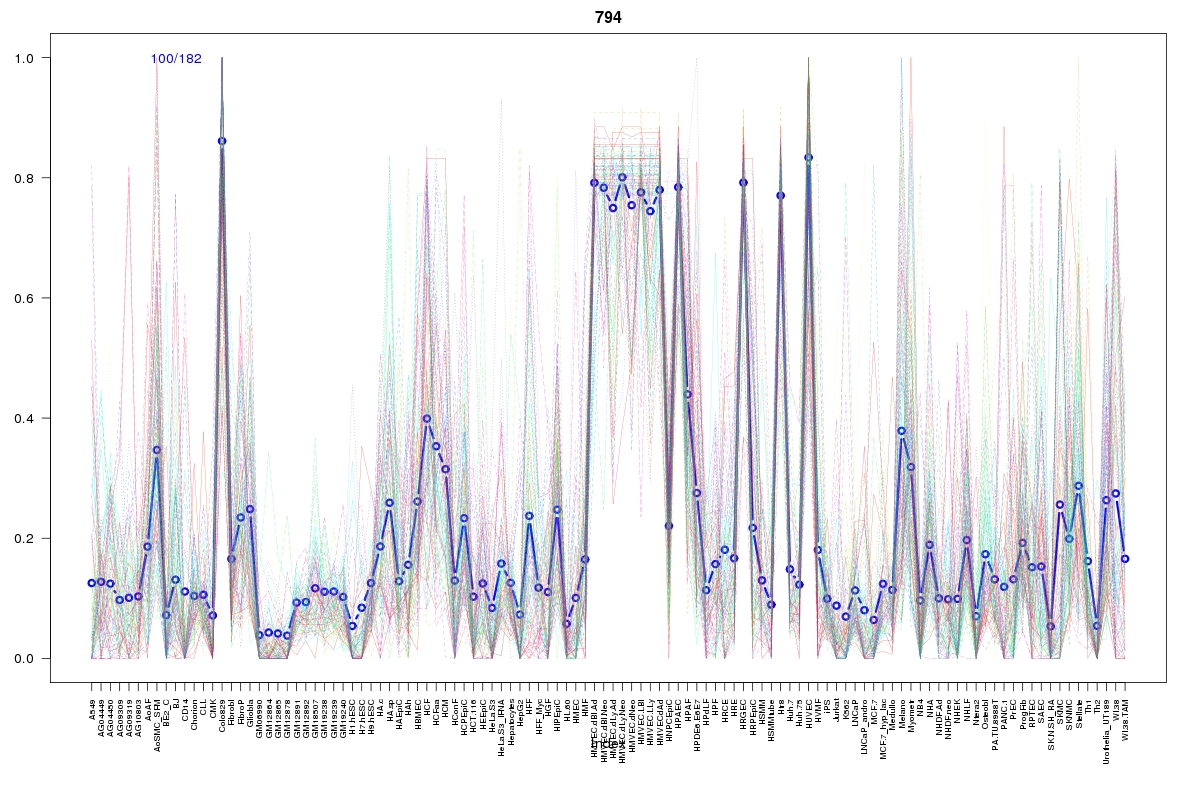 | 794 | 1 |
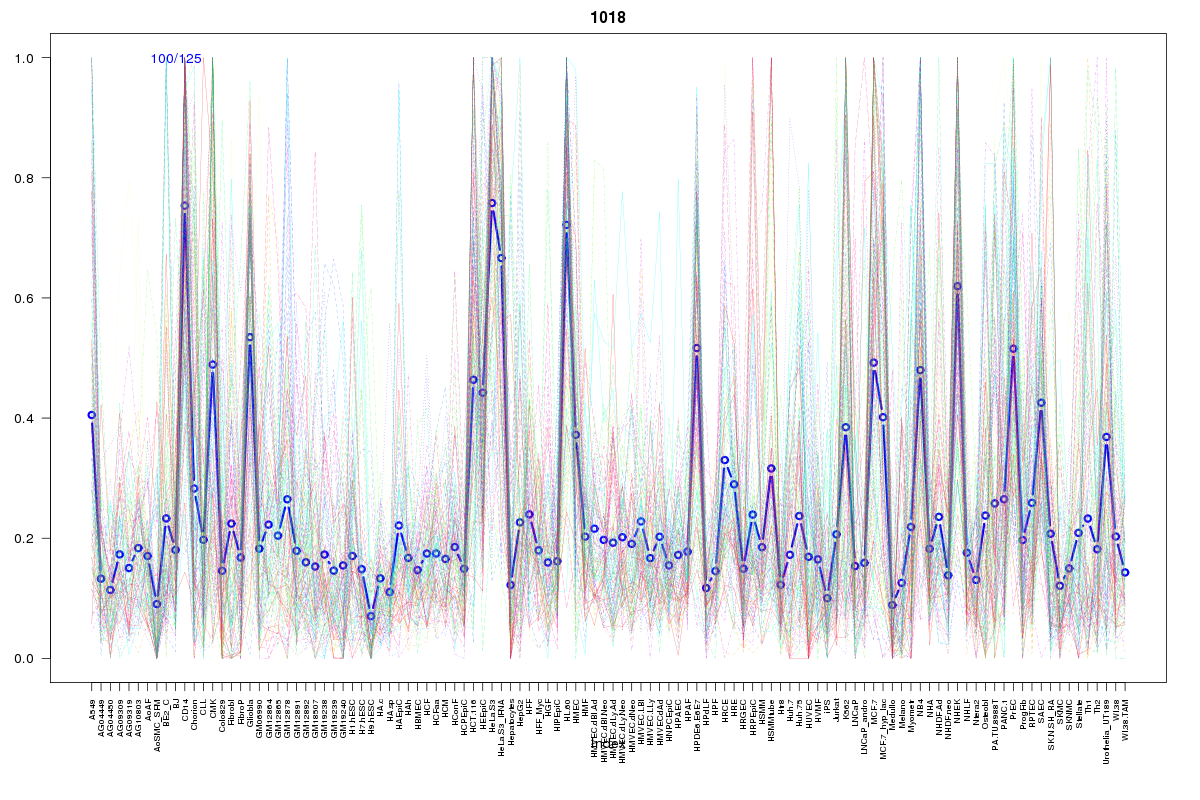 | 1018 | 1 |
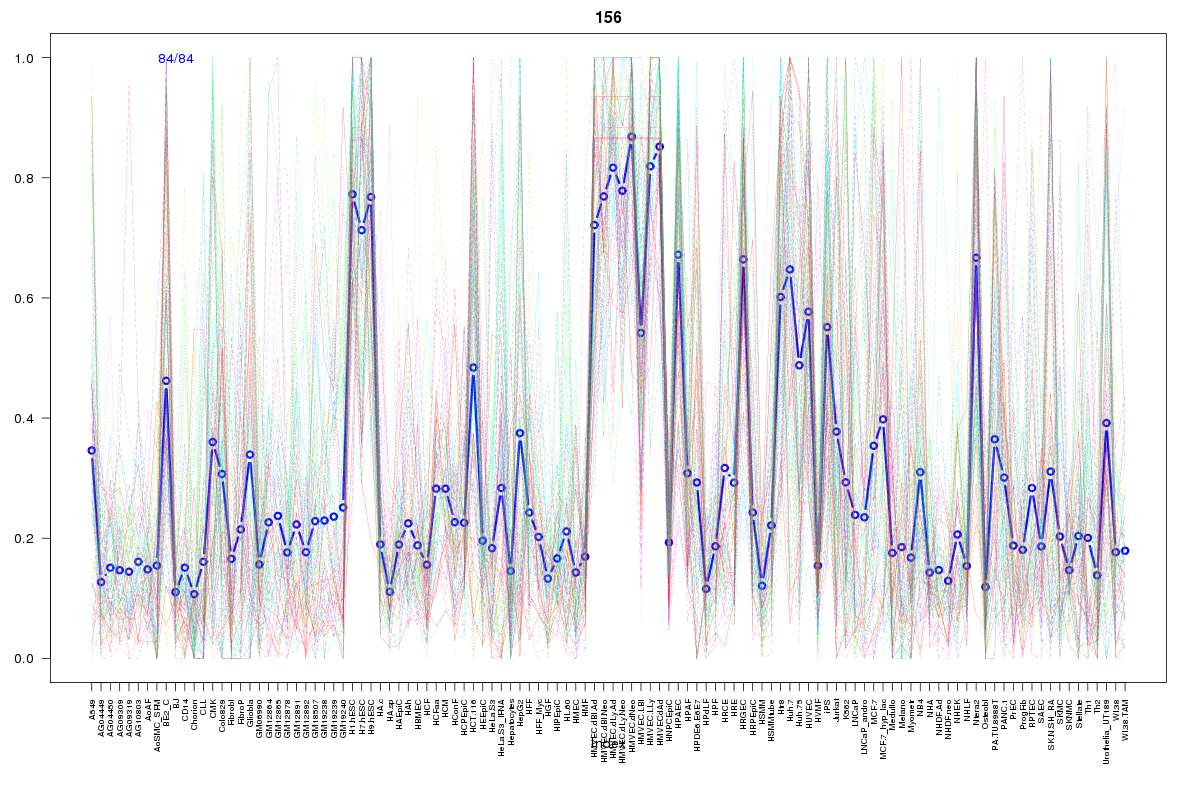 | 156 | 1 |
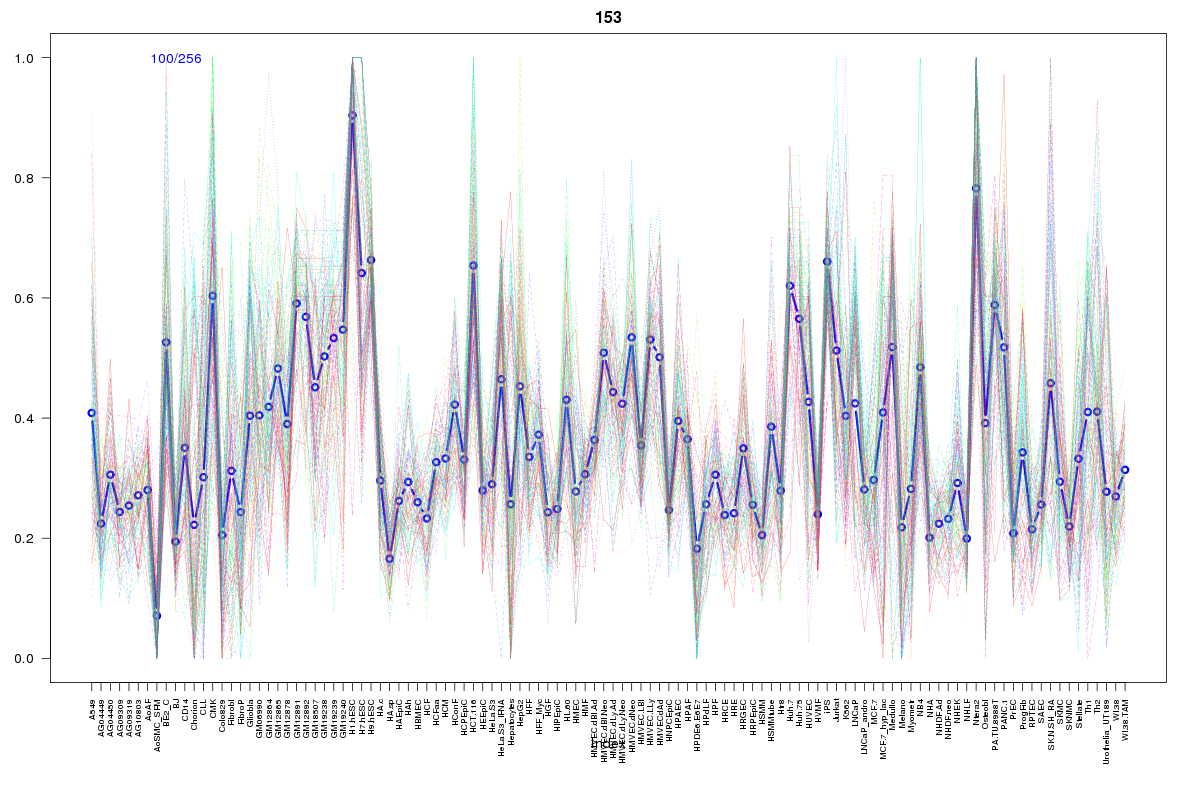 | 153 | 1 |
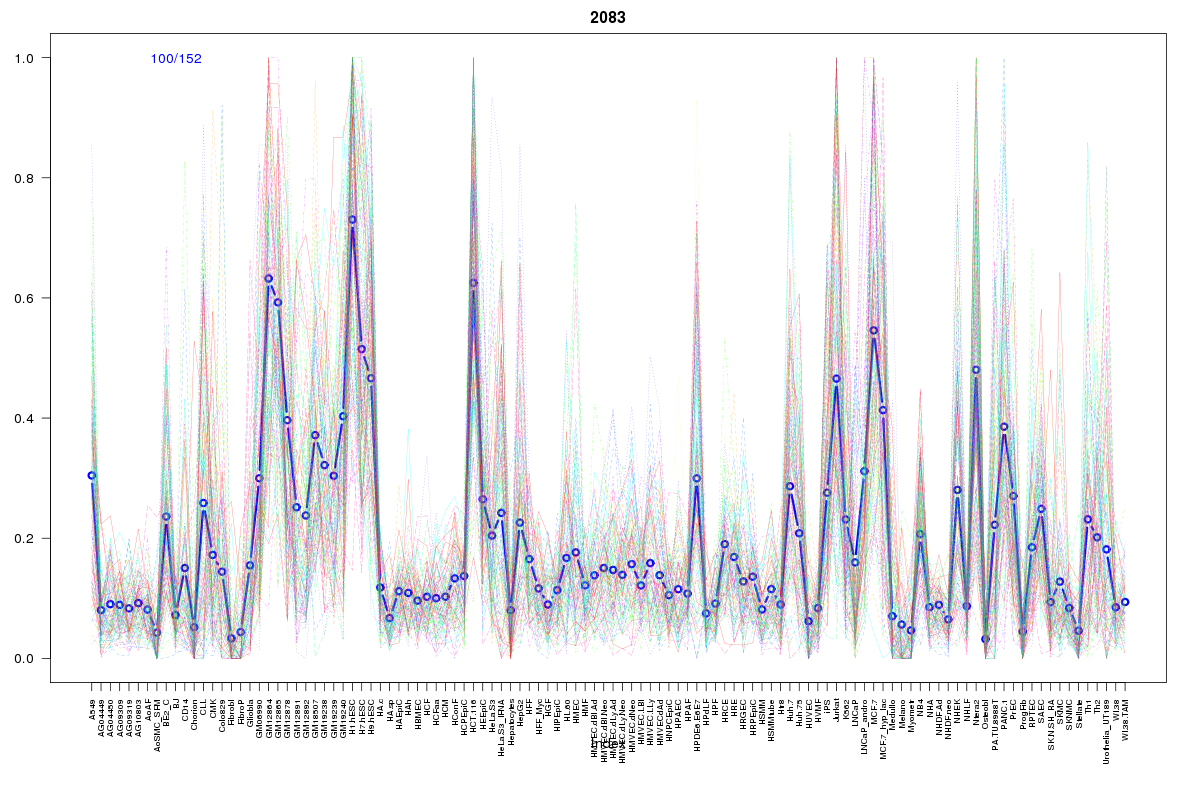 | 2083 | 1 |
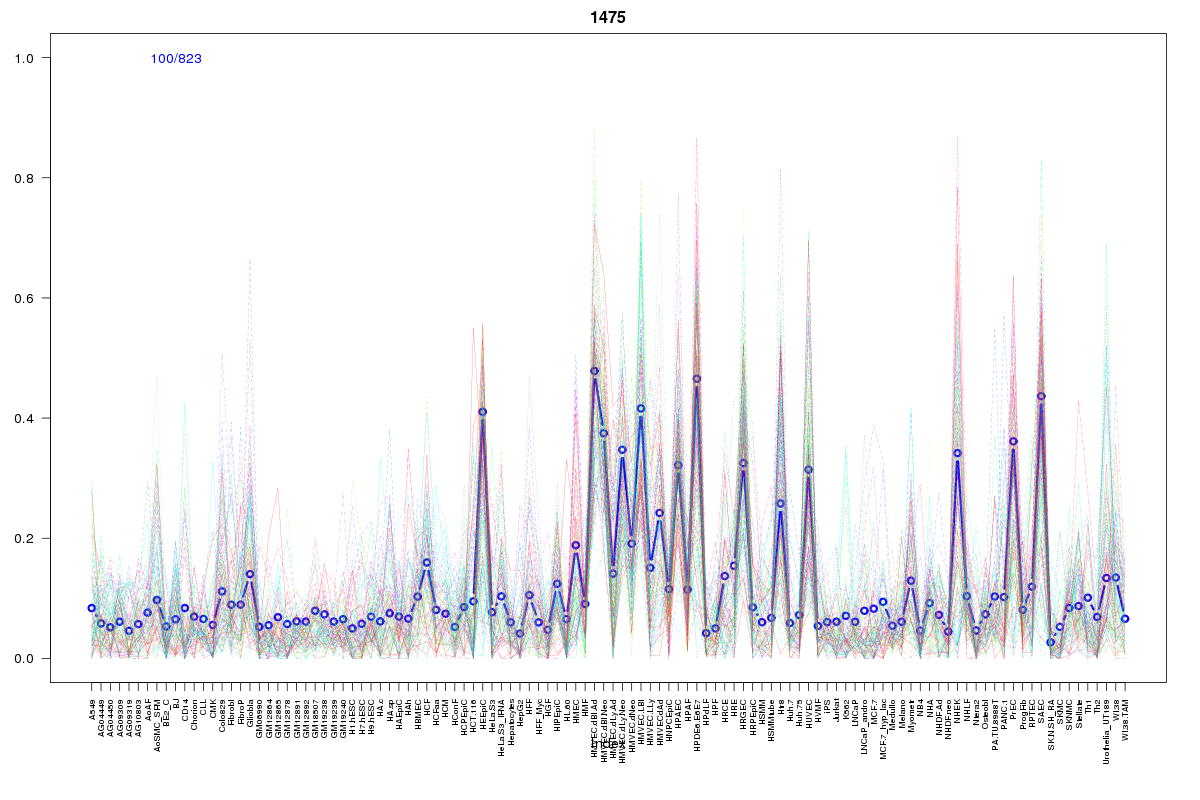 | 1475 | 1 |
 | 881 | 1 |
 | 739 | 1 |
 | 1115 | 1 |
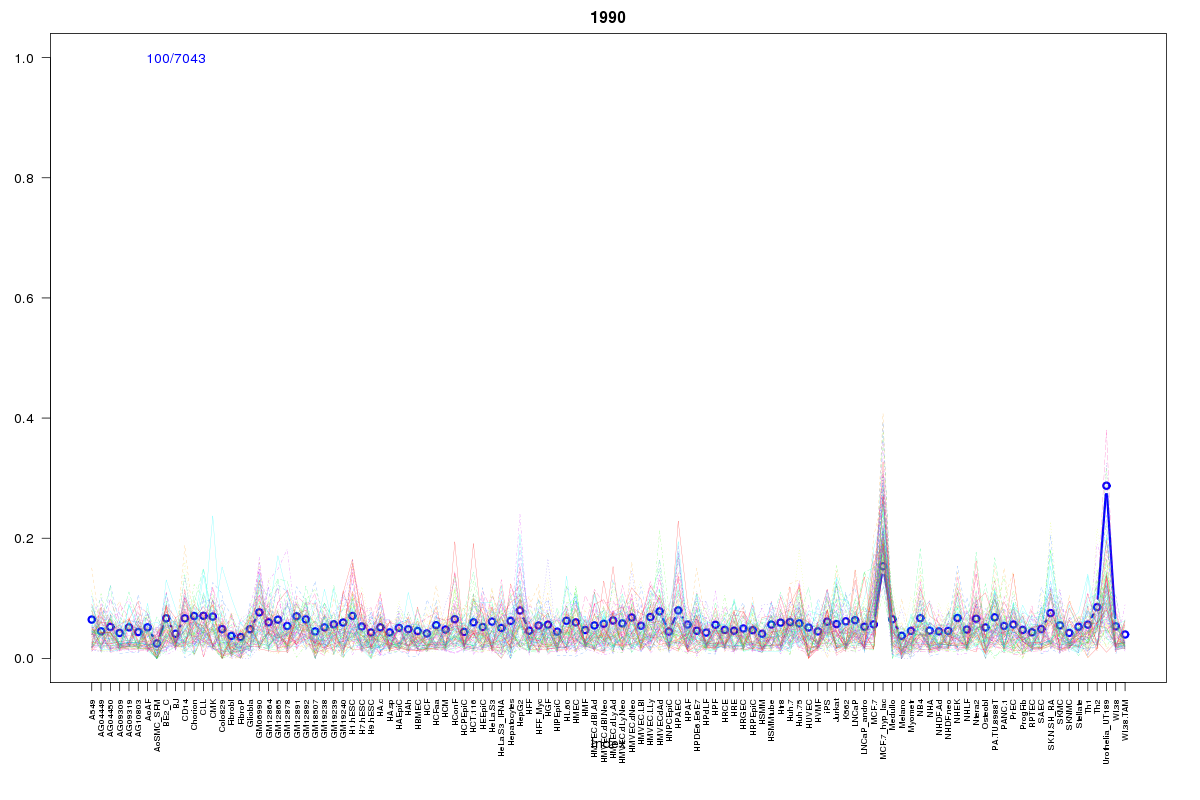 | 1990 | 1 |
 | 687 | 1 |
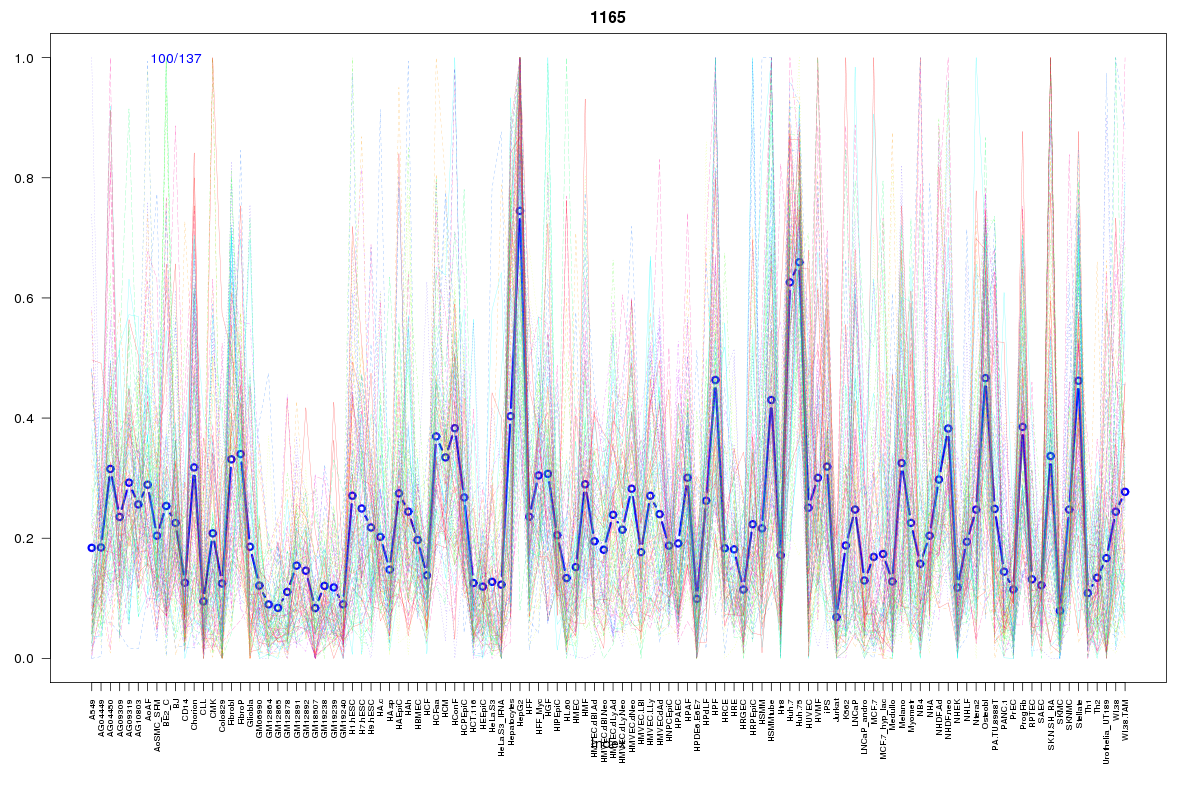 | 1165 | 1 |
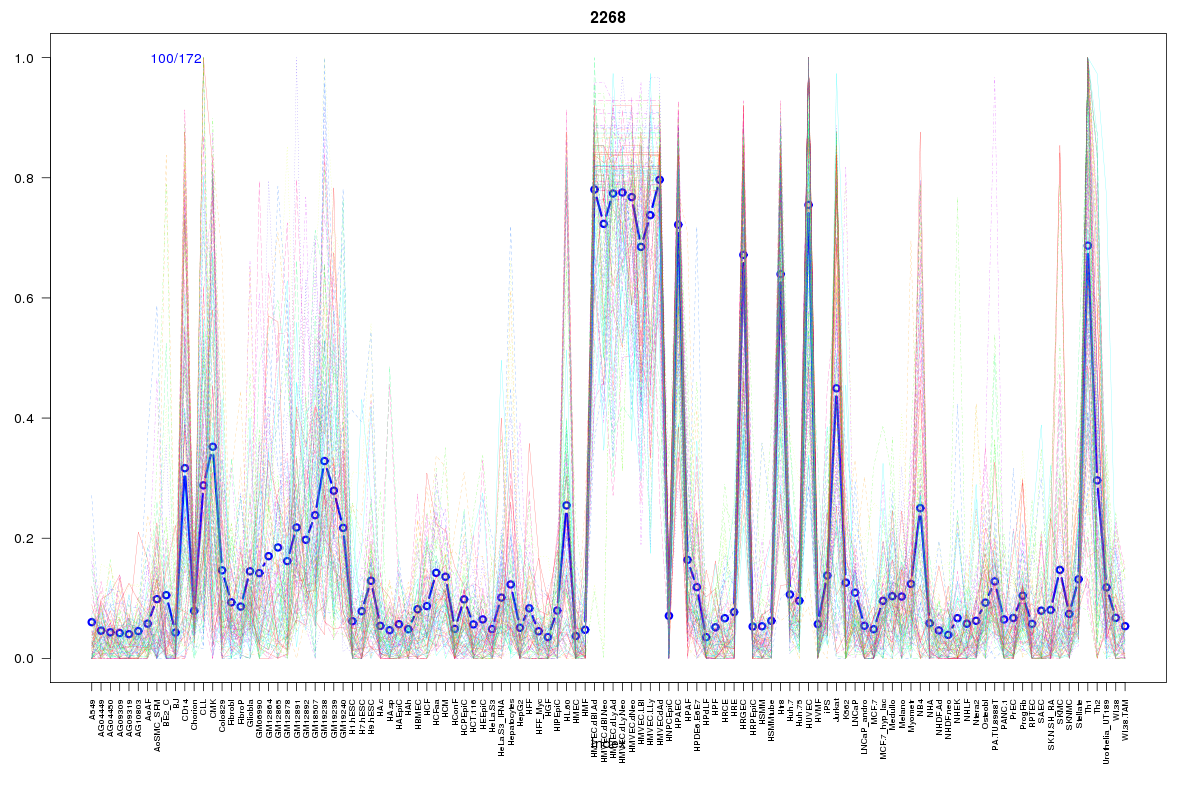 | 2268 | 1 |
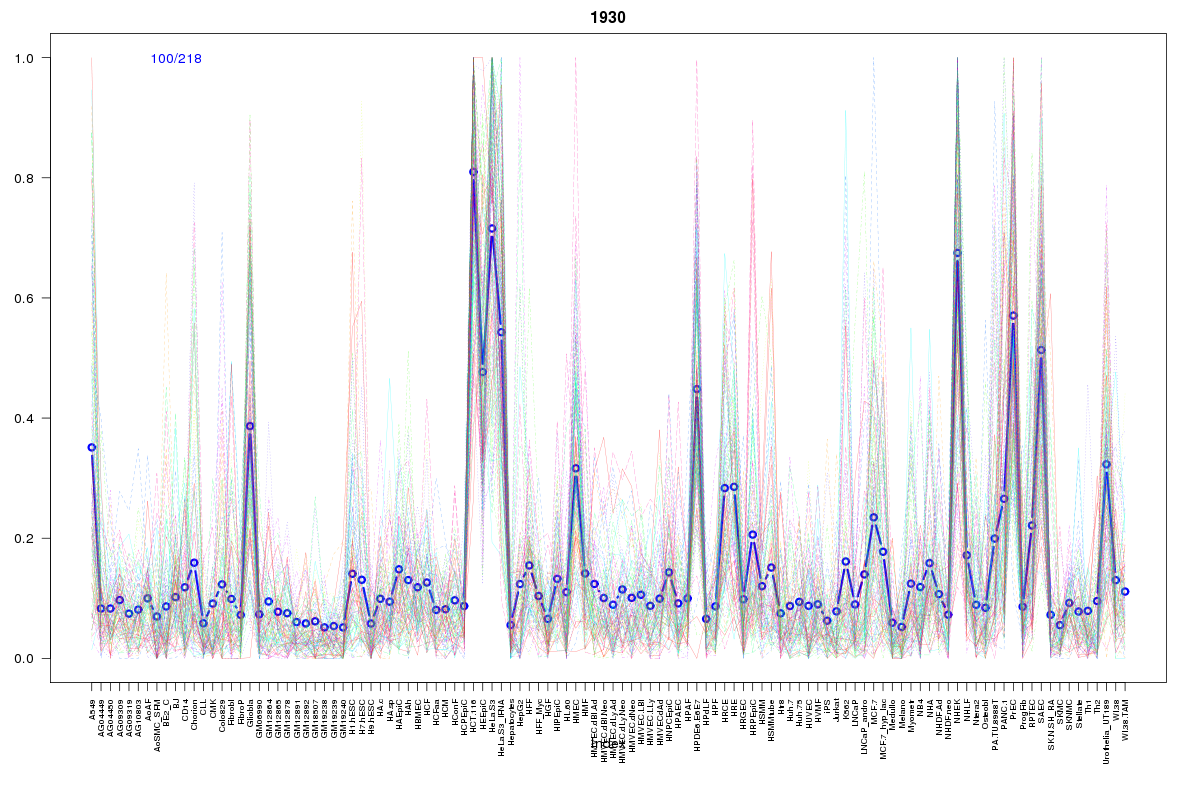 | 1930 | 1 |
Resources
BED file downloads
Connects to 64 DHS sitesTop 10 Correlated DHS Sites
p-values indiciate significant higher or lower correlation| Location | Cluster | P-value |
|---|---|---|
| chr9:130526520-130526670 | 156 | 0.002 |
| chr9:130524740-130524890 | 790 | 0.003 |
| chr9:130397100-130397250 | 507 | 0.005 |
| chr9:130568020-130568170 | 153 | 0.005 |
| chr9:130396440-130396590 | 991 | 0.006 |
| chr9:130524580-130524730 | 790 | 0.006 |
| chr9:130497845-130497995 | 1409 | 0.006 |
| chr9:130533280-130533430 | 334 | 0.006 |
| chr9:130526240-130526390 | 794 | 0.006 |
| chr9:130532400-130532550 | 2268 | 0.007 |
| chr9:130400105-130400255 | 1777 | 0.007 |
External Databases
UCSCEnsembl (ENSG00000160404)