SOM cluster: 153
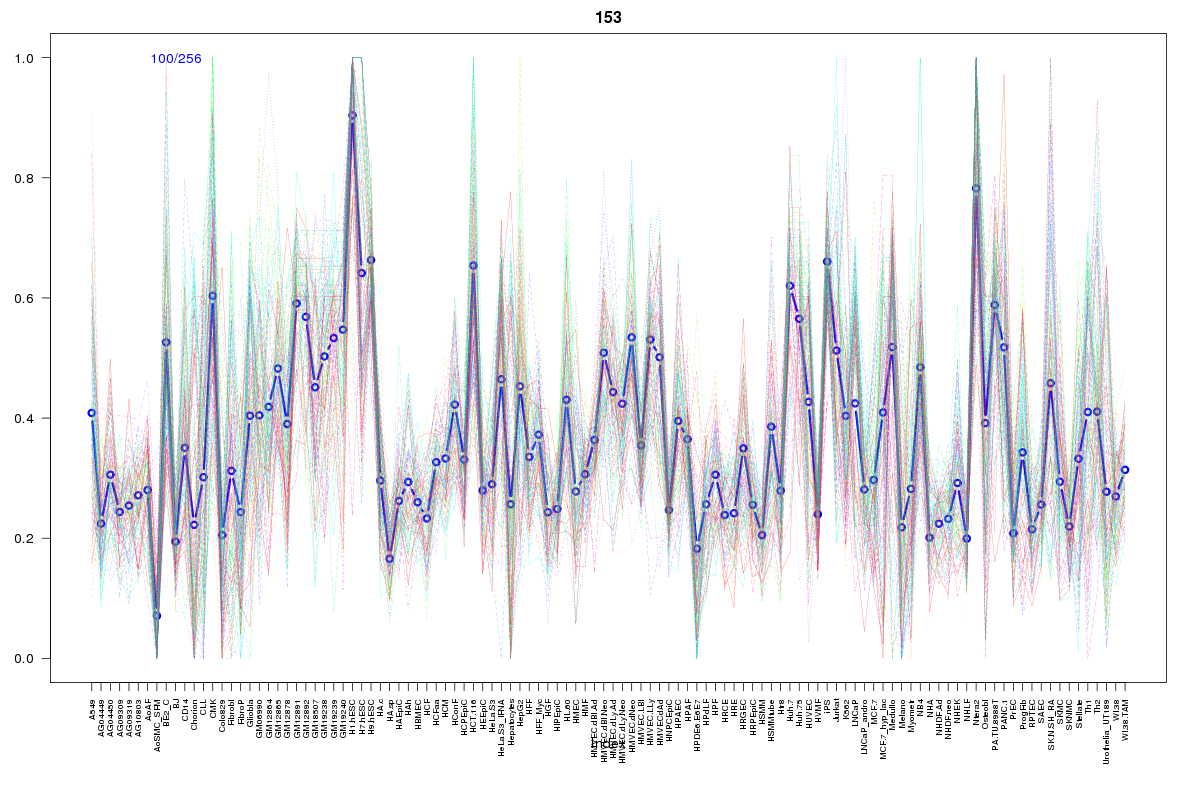
Cluster Hypersensitivity Profile

Genomic Location Trend
These plots show the distribution of the DHS sites surrounding the Transcript Start Site of the nearest gene.
Stats
Number of sites: 256Promoter: 4%
CpG-Island: 7%
Conserved: 59%
Enriched Motifs & Matches
Match Detail: [Jaspar]
|
| ||
|---|---|---|
| Sites: 86/100 | e-val: 0 | ||
| Factor | e-val(match) | DB |
| CTCF | 3.3307e-16 | JASPAR |
| INSM1 | 0.00000034145 | JASPAR |
| SP1 | 0.0012846 | JASPAR |
| MYC::MAX | 0.0059236 | JASPAR |
| Zfp423 | 0.0062406 | JASPAR |
|
| ||
| Sites: 70/100 | e-val: 0.00000000000019 | ||
| Factor | e-val(match) | DB |
| SP1 | 0.0000000071399 | JASPAR |
| Klf4 | 0.0000006142 | JASPAR |
| Tal1::Gata1 | 0.0012548 | JASPAR |
| PPARG::RXRA | 0.0013225 | JASPAR |
| INSM1 | 0.0026082 | JASPAR |
|
| ||
| Sites: 18/100 | e-val: 2.3 | ||
| Factor | e-val(match) | DB |
| SP1 | 0.00025725 | JASPAR |
| EWSR1-FLI1 | 0.00038187 | JASPAR |
| INSM1 | 0.0013218 | JASPAR |
| TFAP2A | 0.0013653 | JASPAR |
| Stat3 | 0.0075433 | JASPAR |
BED file downloads
Top 10 Example Regions
| Location | Gene Link | Dist. |
|---|---|---|
| chr11: 128718820-128718970 | TP53AIP1 | 40.71 |
| chr11: 128718820-128718970 | FLI1 | 40.71 |
| chr11: 128718820-128718970 | KCNJ1 | 40.71 |
| chr11: 128718820-128718970 | C11orf45 | 40.71 |
| chr11: 47208520-47208670 | ARFGAP2 | 43.1 |
| chr11: 47208520-47208670 | MADD | 43.1 |
| chr11: 47208520-47208670 | DDB2 | 43.1 |
| chr16: 11499525-11499675 | RMI2 | 44.76 |
| chrX: 119021700-119021850 | NKAP | 50.19 |
| chrX: 119021700-119021850 | UPF3B | 50.19 |