SOM cluster: 884
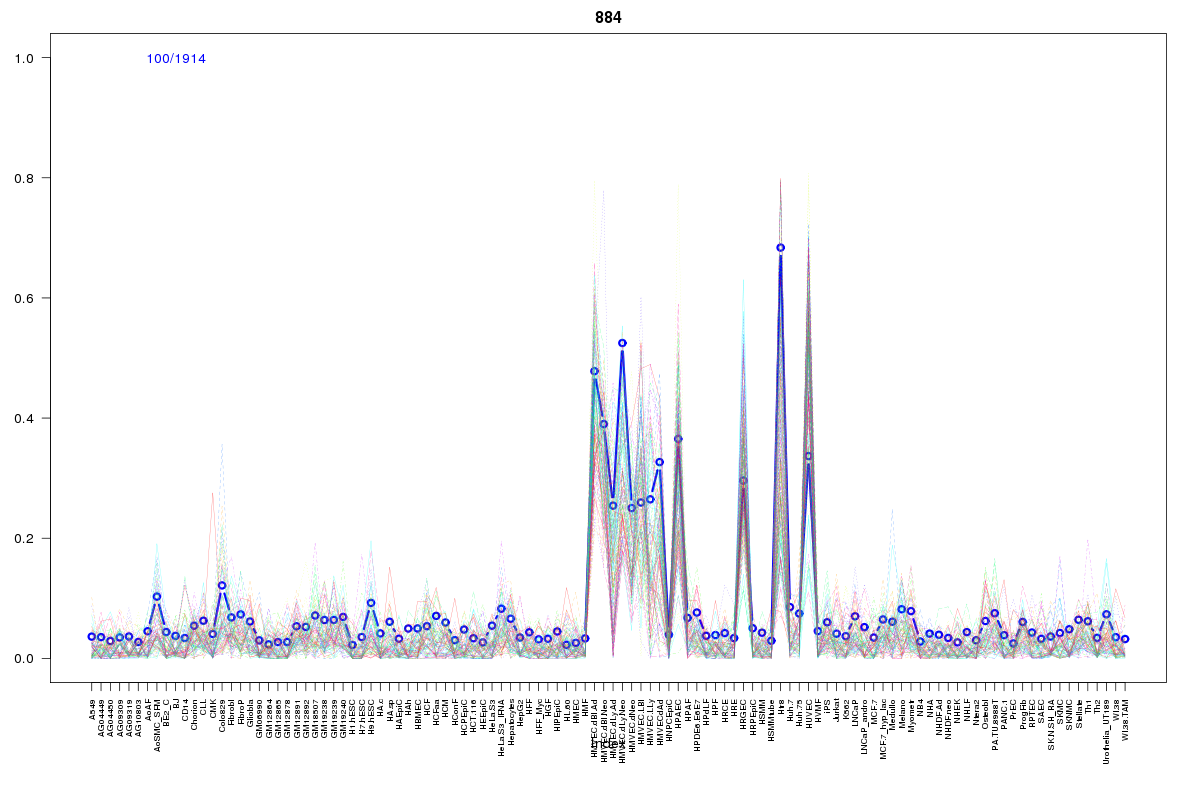
Cluster Hypersensitivity Profile

Genomic Location Trend
These plots show the distribution of the DHS sites surrounding the Transcript Start Site of the nearest gene.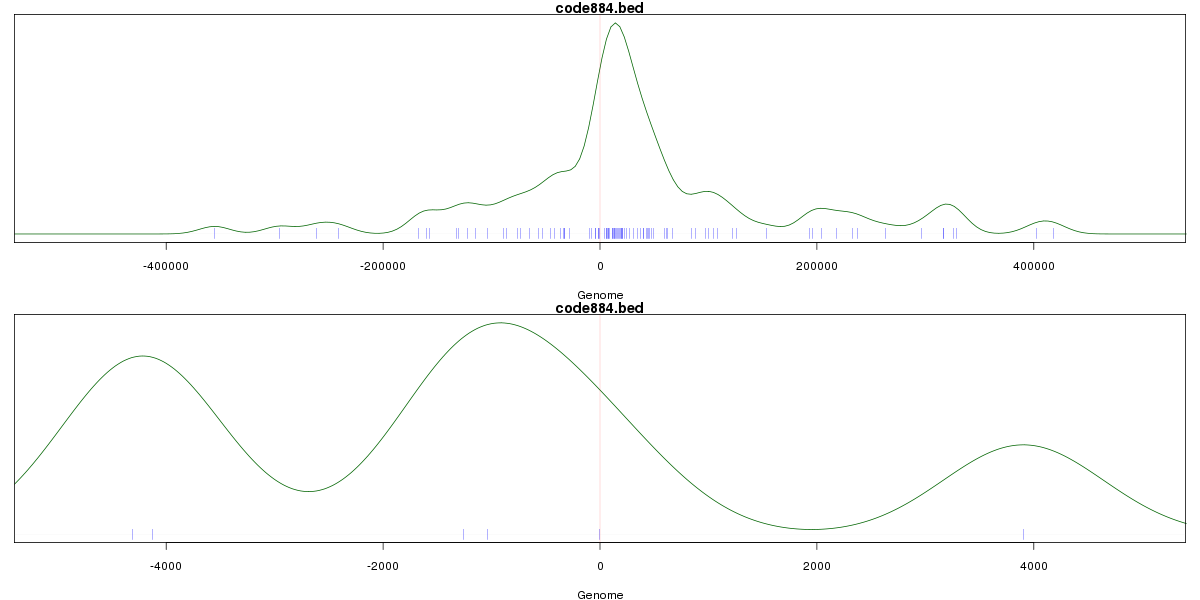
Stats
Number of sites: 1914Promoter: 3%
CpG-Island: 0%
Conserved: 36%
Enriched Motifs & Matches
Match Detail: [Jaspar]
|
| ||
|---|---|---|
| Sites: 14/100 | e-val: 1.1 | ||
| Factor | e-val(match) | DB |
| HNF1B | 0.000061333 | JASPAR |
| FOXF2 | 0.00013234 | JASPAR |
| MEF2A | 0.00020264 | JASPAR |
| Lhx3 | 0.00083309 | JASPAR |
| Prrx2 | 0.0023033 | JASPAR |
|
| ||
| Sites: 23/100 | e-val: 0.000004 | ||
| Factor | e-val(match) | DB |
| FEV | 0.0000000028732 | JASPAR |
| SPI1 | 0.000058834 | JASPAR |
| ELF5 | 0.00013981 | JASPAR |
| ELK4 | 0.00020155 | JASPAR |
| SPIB | 0.00032594 | JASPAR |
|
| ||
| Sites: 19/100 | e-val: 1.1 | ||
| Factor | e-val(match) | DB |
| Foxd3 | 0.00023345 | JASPAR |
| Foxq1 | 0.0002993 | JASPAR |
| Sox5 | 0.00049492 | JASPAR |
| SOX9 | 0.00060805 | JASPAR |
| SRY | 0.00064997 | JASPAR |
BED file downloads
Top 10 Example Regions
| Location | Gene Link | Dist. |
|---|---|---|
| chr10: 15212225-15212375 | PPIAP30 | 25.29 |
| chr10: 15212225-15212375 | FAM171A1 | 25.29 |
| chr10: 15212225-15212375 | NMT2 | 25.29 |
| chr10: 15212225-15212375 | C10orf111 | 25.29 |
| chr8: 17459540-17459690 | MTUS1 | 37.33 |
| chr4: 87999460-87999610 | AFF1 | 37.49 |
| chr4: 87999460-87999610 | KLHL8 | 37.49 |
| chr12: 26880000-26880150 | ITPR2 | 42.46 |
| chr8: 8990580-8990730 | RP11-10A14.5 | 43.62 |
| chr8: 8990580-8990730 | RP11-10A14.3 | 43.62 |