SOM cluster: 2268
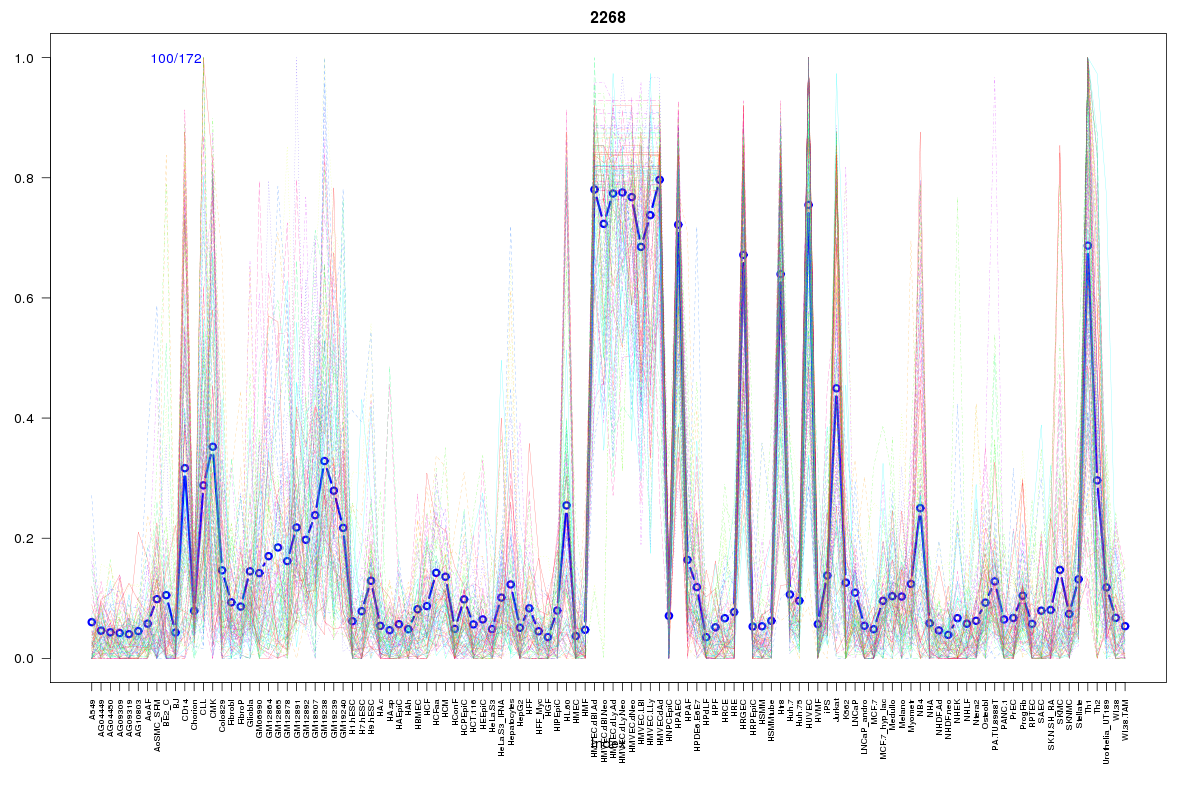
Cluster Hypersensitivity Profile

Genomic Location Trend
These plots show the distribution of the DHS sites surrounding the Transcript Start Site of the nearest gene.
Stats
Number of sites: 172Promoter: 7%
CpG-Island: 0%
Conserved: 61%
Enriched Motifs & Matches
Match Detail: [Jaspar]
|
| ||
|---|---|---|
| Sites: 88/100 | e-val: 0 | ||
| Factor | e-val(match) | DB |
| FEV | 0.000000092525 | JASPAR |
| SPIB | 0.0000029467 | JASPAR |
| Stat3 | 0.000026559 | JASPAR |
| ELK4 | 0.000029632 | JASPAR |
| SPI1 | 0.000060231 | JASPAR |
|
| ||
| Sites: 50/100 | e-val: 0.0000034 | ||
| Factor | e-val(match) | DB |
| FEV | 0.0000000025853 | JASPAR |
| SPI1 | 0.00000003618 | JASPAR |
| ELF5 | 0.000022598 | JASPAR |
| GABPA | 0.000027122 | JASPAR |
| ELK4 | 0.000046132 | JASPAR |
BED file downloads
Top 10 Example Regions
| Location | Gene Link | Dist. |
|---|---|---|
| chr10: 14549300-14549450 | FAM107B | 41.84 |
| chr3: 50119900-50120050 | RBM5 | 47.32 |
| chr11: 72194780-72194930 | PDE2A | 56.28 |
| chr2: 161934200-161934350 | TANK | 57.44 |
| chr9: 139433620-139433770 | C9orf163 | 59.75 |
| chr7: 150452740-150452890 | RP5-1051J4.6 | 60.34 |
| chr17: 76815140-76815290 | CYTH1 | 61.09 |
| chr9: 140281860-140282010 | EXD3 | 62.07 |
| chr9: 130532400-130532550 | ENG | 65.62 |
| chr9: 130532400-130532550 | TOR2A | 65.62 |