SOM cluster: 401
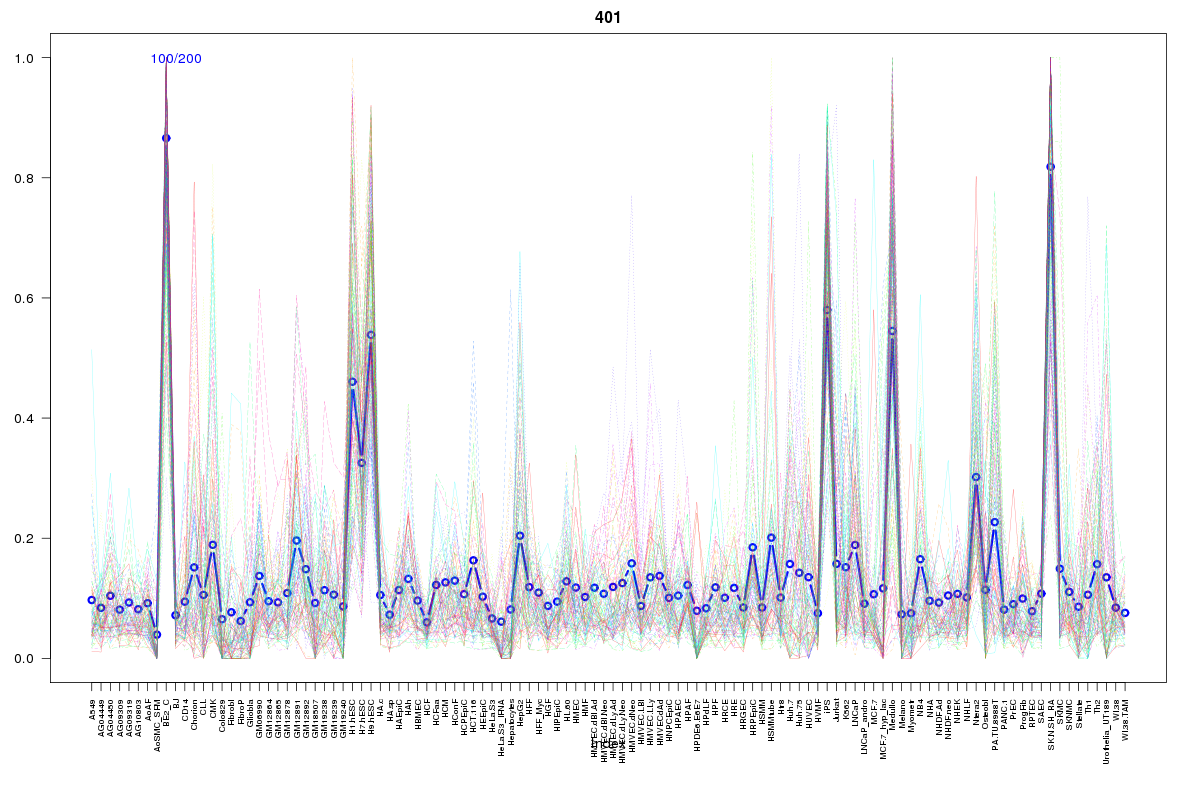
Cluster Hypersensitivity Profile

Genomic Location Trend
These plots show the distribution of the DHS sites surrounding the Transcript Start Site of the nearest gene.
Stats
Number of sites: 200Promoter: 27%
CpG-Island: 35%
Conserved: 73%
Enriched Motifs & Matches
Match Detail: [Jaspar]
|
| ||
|---|---|---|
| Sites: 88/100 | e-val: 0 | ||
| Factor | e-val(match) | DB |
| SP1 | 0.0000000000041239 | JASPAR |
| RREB1 | 0.00036772 | JASPAR |
| Klf4 | 0.00048417 | JASPAR |
| Pax4 | 0.0010437 | JASPAR |
| Egr1 | 0.0011673 | JASPAR |
|
| ||
| Sites: 100/100 | e-val: 2.79993e-41 | ||
| Factor | e-val(match) | DB |
| SP1 | 0.00000017426 | JASPAR |
| EWSR1-FLI1 | 0.000085685 | JASPAR |
| Klf4 | 0.020983 | JASPAR |
| PLAG1 | 0.025019 | JASPAR |
| INSM1 | 0.033936 | JASPAR |
|
| ||
| Sites: 35/100 | e-val: 0.00000086 | ||
| Factor | e-val(match) | DB |
| TLX1::NFIC | 0.0022954 | JASPAR |
| TFAP2A | 0.0023285 | JASPAR |
| Zfx | 0.0069252 | JASPAR |
| PLAG1 | 0.0074908 | JASPAR |
| EBF1 | 0.040887 | JASPAR |
|
| ||
| Sites: 30/100 | e-val: 2.3 | ||
| Factor | e-val(match) | DB |
| Klf4 | 0.002928 | JASPAR |
| SP1 | 0.0077487 | JASPAR |
| Egr1 | 0.016714 | JASPAR |
| RREB1 | 0.023703 | JASPAR |
| INSM1 | 0.055696 | JASPAR |
BED file downloads
Top 10 Example Regions
| Location | Gene Link | Dist. |
|---|---|---|
| chr19: 13024000-13024150 | MAST1 | 50.88 |
| chr17: 7344000-7344150 | TMEM95 | 51.71 |
| chr17: 7344000-7344150 | C17orf74 | 51.71 |
| chr17: 7344000-7344150 | FGF11 | 51.71 |
| chr17: 7344000-7344150 | TMEM256-PLSCR3 | 51.71 |
| chr17: 7344000-7344150 | ZBTB4 | 51.71 |
| chr17: 7344000-7344150 | KCTD11 | 51.71 |
| chr1: 204328700-204328850 | PLEKHA6 | 51.75 |
| chr19: 51109605-51109755 | LRRC4B | 54.05 |
| chr19: 51109605-51109755 | SYT3 | 54.05 |