SOM cluster: 790
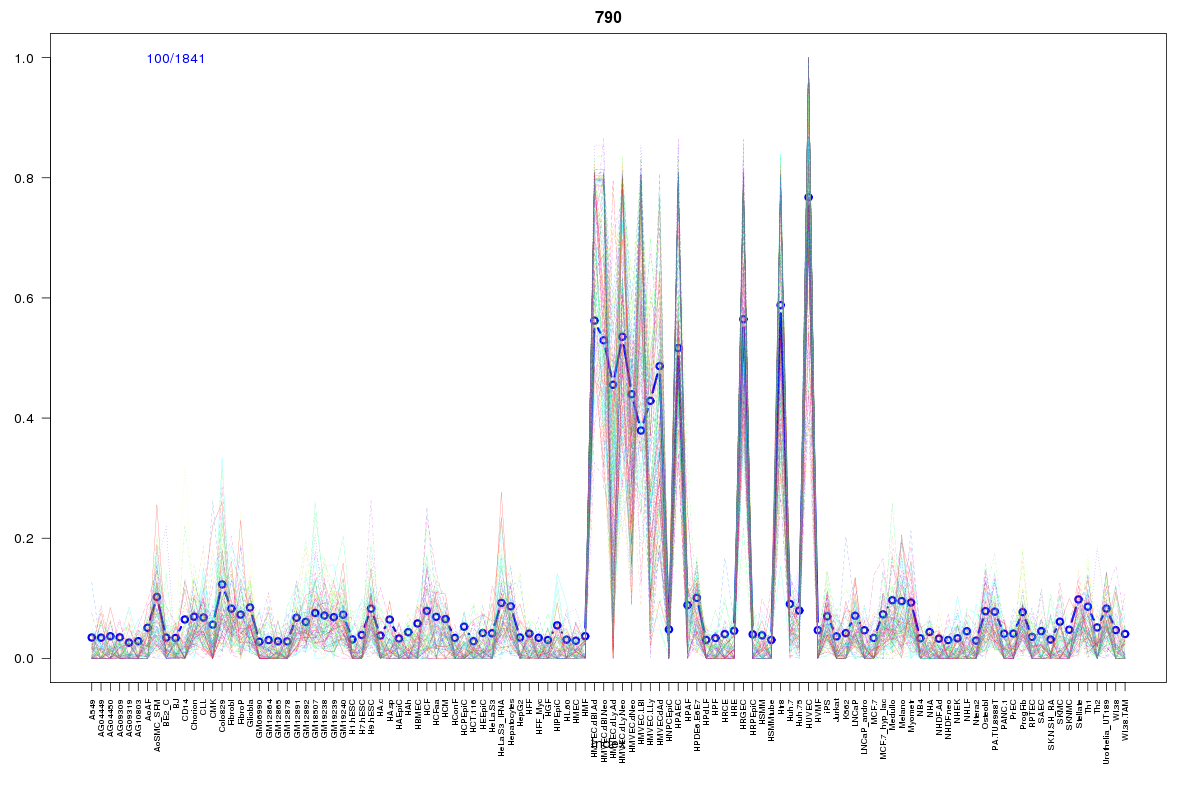
Cluster Hypersensitivity Profile

Genomic Location Trend
These plots show the distribution of the DHS sites surrounding the Transcript Start Site of the nearest gene.
Stats
Number of sites: 1841Promoter: 2%
CpG-Island: 0%
Conserved: 33%
Enriched Motifs & Matches
Match Detail: [Jaspar]
|
| ||
|---|---|---|
| Sites: 59/100 | e-val: 1.7e-25 | ||
| Factor | e-val(match) | DB |
| FEV | 0.000000034302 | JASPAR |
| SPI1 | 0.0000024446 | JASPAR |
| ELF5 | 0.0000027838 | JASPAR |
| RELA | 0.00010789 | JASPAR |
| NR3C1 | 0.00027663 | JASPAR |
|
| ||
| Sites: 19/100 | e-val: 0.000064 | ||
| Factor | e-val(match) | DB |
| Foxd3 | 0.0000000034347 | JASPAR |
| Foxq1 | 0.0000010099 | JASPAR |
| SRY | 0.000020523 | JASPAR |
| Sox5 | 0.000031498 | JASPAR |
| FOXI1 | 0.00028572 | JASPAR |
BED file downloads
Top 10 Example Regions
| Location | Gene Link | Dist. |
|---|---|---|
| chr3: 171394720-171394870 | PLD1 | 36.97 |
| chr8: 17464040-17464190 | MTUS1 | 41.32 |
| chr2: 128417160-128417310 | LIMS2 | 42.67 |
| chr2: 128417160-128417310 | GPR17 | 42.67 |
| chr1: 169640180-169640330 | SELE | 44.51 |
| chr1: 169640180-169640330 | SELP | 44.51 |
| chr9: 116715740-116715890 | ZNF618 | 46.51 |
| chr13: 28910420-28910570 | FLT1 | 46.73 |
| chr8: 89189960-89190110 | MMP16 | 47.21 |
| chr1: 66731440-66731590 | PDE4B | 47.62 |