SOM cluster: 1704
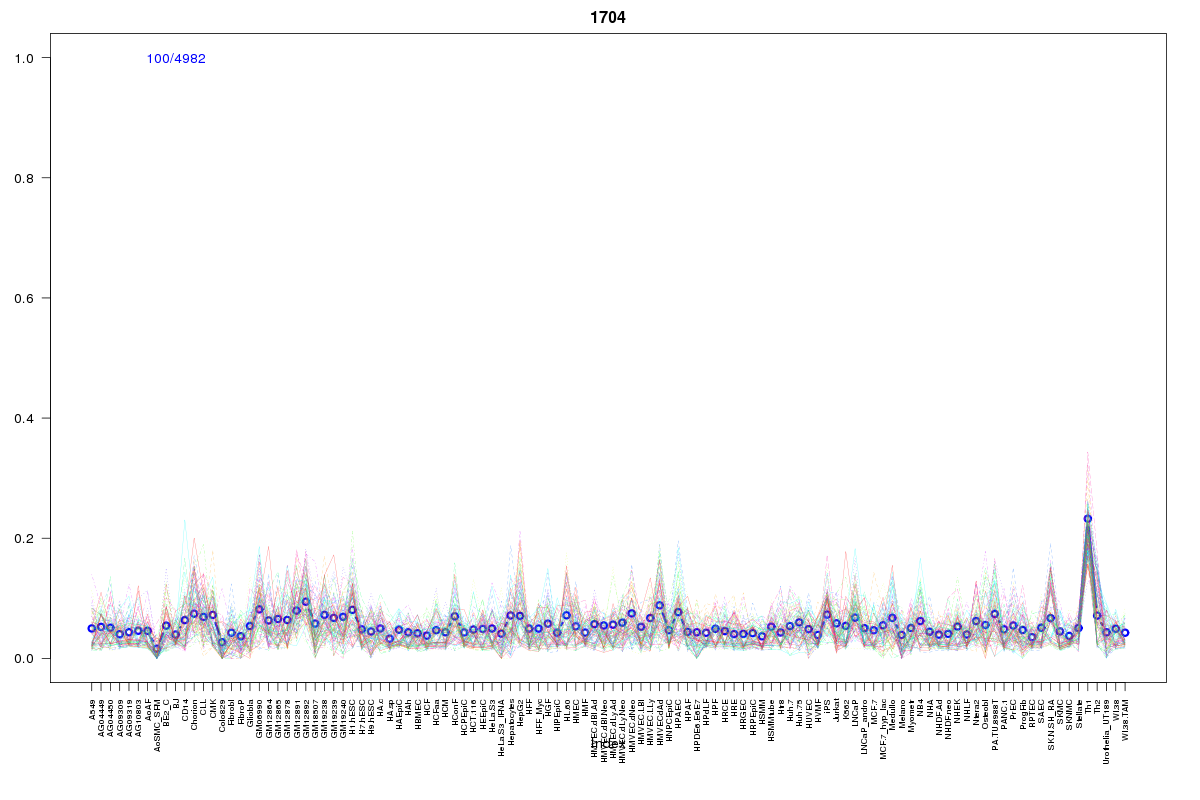
Cluster Hypersensitivity Profile

Genomic Location Trend
These plots show the distribution of the DHS sites surrounding the Transcript Start Site of the nearest gene.
Stats
Number of sites: 4982Promoter: 1%
CpG-Island: 8%
Conserved: 32%
Enriched Motifs & Matches
Match Detail: [Jaspar]
|
| ||
|---|---|---|
| Sites: 92/100 | e-val: 5.3e-32 | ||
| Factor | e-val(match) | DB |
| PLAG1 | 0.0000028914 | JASPAR |
| SP1 | 0.0000030021 | JASPAR |
| INSM1 | 0.000030684 | JASPAR |
| ESR1 | 0.00069342 | JASPAR |
| RREB1 | 0.00097028 | JASPAR |
|
| ||
| Sites: 30/100 | e-val: 0.0000000001 | ||
| Factor | e-val(match) | DB |
| PLAG1 | 0.0000075639 | JASPAR |
| PPARG::RXRA | 0.0019486 | JASPAR |
| INSM1 | 0.0023077 | JASPAR |
| SP1 | 0.0053465 | JASPAR |
| Zfx | 0.0068048 | JASPAR |
|
| ||
| Sites: 40/100 | e-val: 0.0002 | ||
| Factor | e-val(match) | DB |
| Myf | 0.00017968 | JASPAR |
| SPIB | 0.0032007 | JASPAR |
| NHLH1 | 0.013984 | JASPAR |
| ZEB1 | 0.016387 | JASPAR |
| SPI1 | 0.028936 | JASPAR |
|
| ||
| Sites: 67/100 | e-val: 0.000000021 | ||
| Factor | e-val(match) | DB |
| PLAG1 | 0.00032113 | JASPAR |
| EBF1 | 0.00034983 | JASPAR |
| TFAP2A | 0.00049542 | JASPAR |
| CTCF | 0.0006631 | JASPAR |
| Zfx | 0.00075719 | JASPAR |
BED file downloads
Top 10 Example Regions
| Location | Gene Link | Dist. |
|---|---|---|
| chr1: 151108485-151108635 | LYSMD1 | 13.02 |
| chr1: 151134265-151134415 | PSMD4 | 13.32 |
| chr1: 151134265-151134415 | TNFAIP8L2 | 13.32 |
| chr1: 151134265-151134415 | SCNM1 | 13.32 |
| chr13: 99098820-99098970 | FARP1-AS1 | 36.21 |
| chr8: 144562125-144562275 | MAFA | 37.38 |
| chr1: 45268845-45268995 | PTCH2 | 39.87 |
| chr1: 53794665-53794815 | MAGOH | 40.28 |
| chr7: 55552100-55552250 | VOPP1 | 40.81 |
| chr11: 47194865-47195015 | ARFGAP2 | 42.5 |