Gene: EPT1
chr2: 26531414-26596374Expression Profile
(log scale)
Graphical Connections
Distribution of linked clusters:
You may find it interesting if many of the connected DHS sites belong to the same cluster.| Cluster Profile | Cluster ID | Number of DHS sites in this cluster |
|---|---|---|
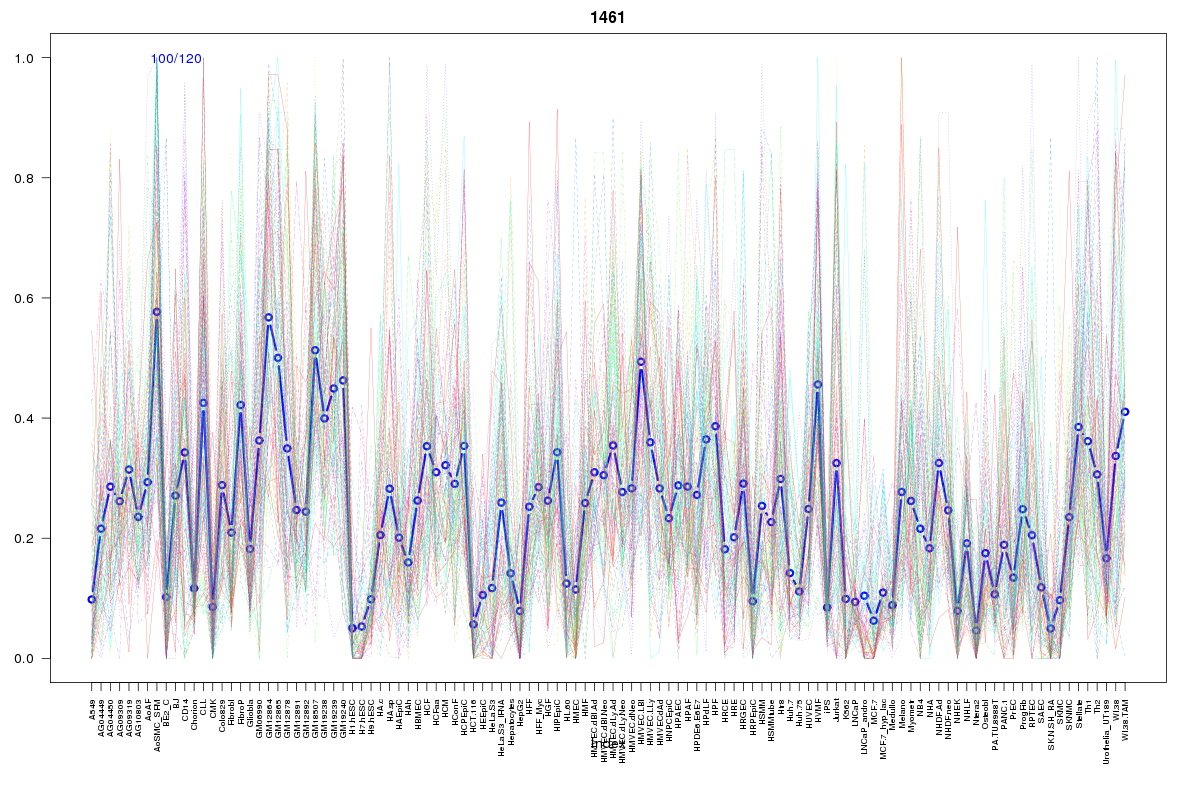 | 1461 | 2 |
 | 2110 | 2 |
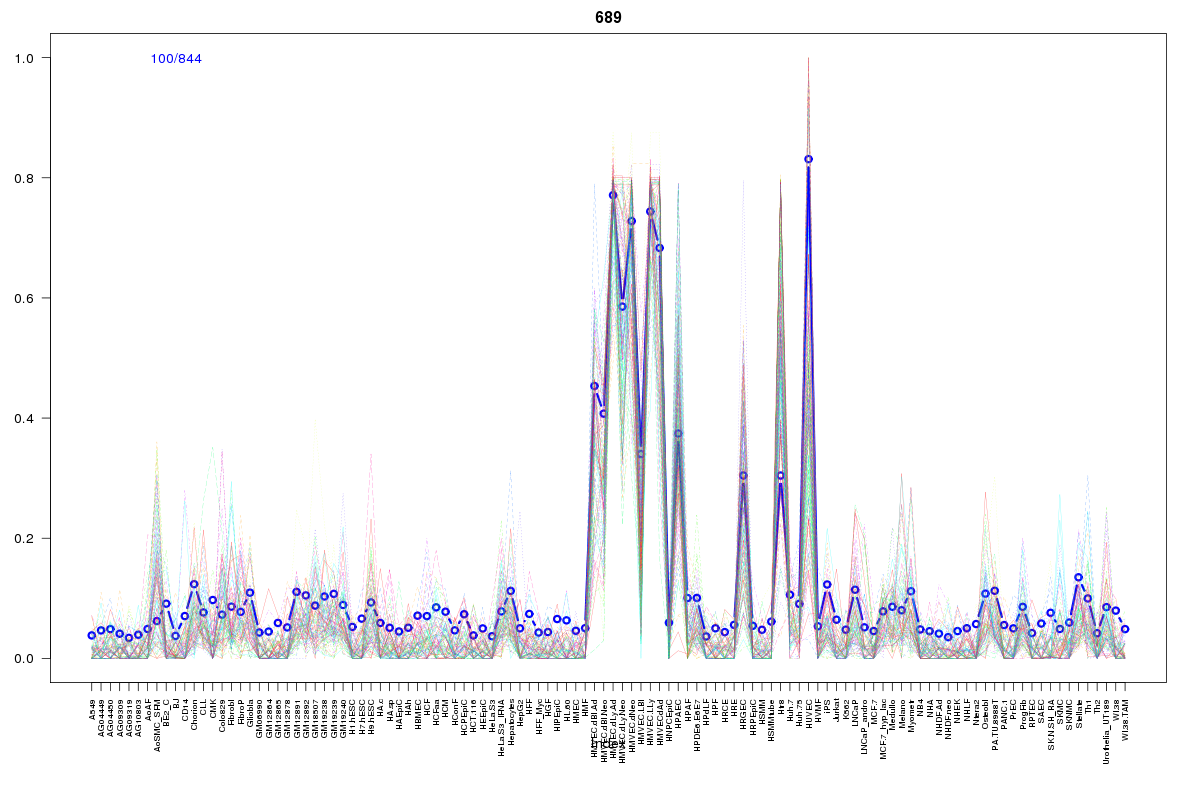 | 689 | 1 |
 | 2055 | 1 |
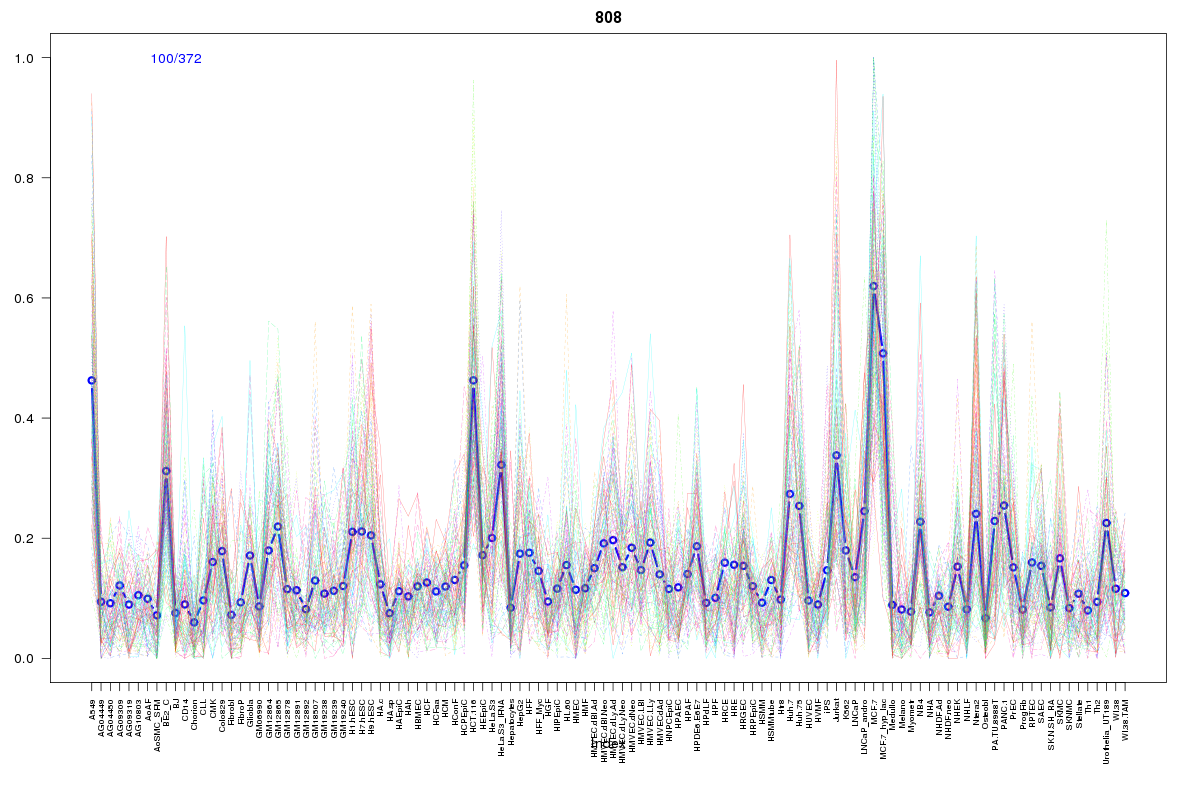 | 808 | 1 |
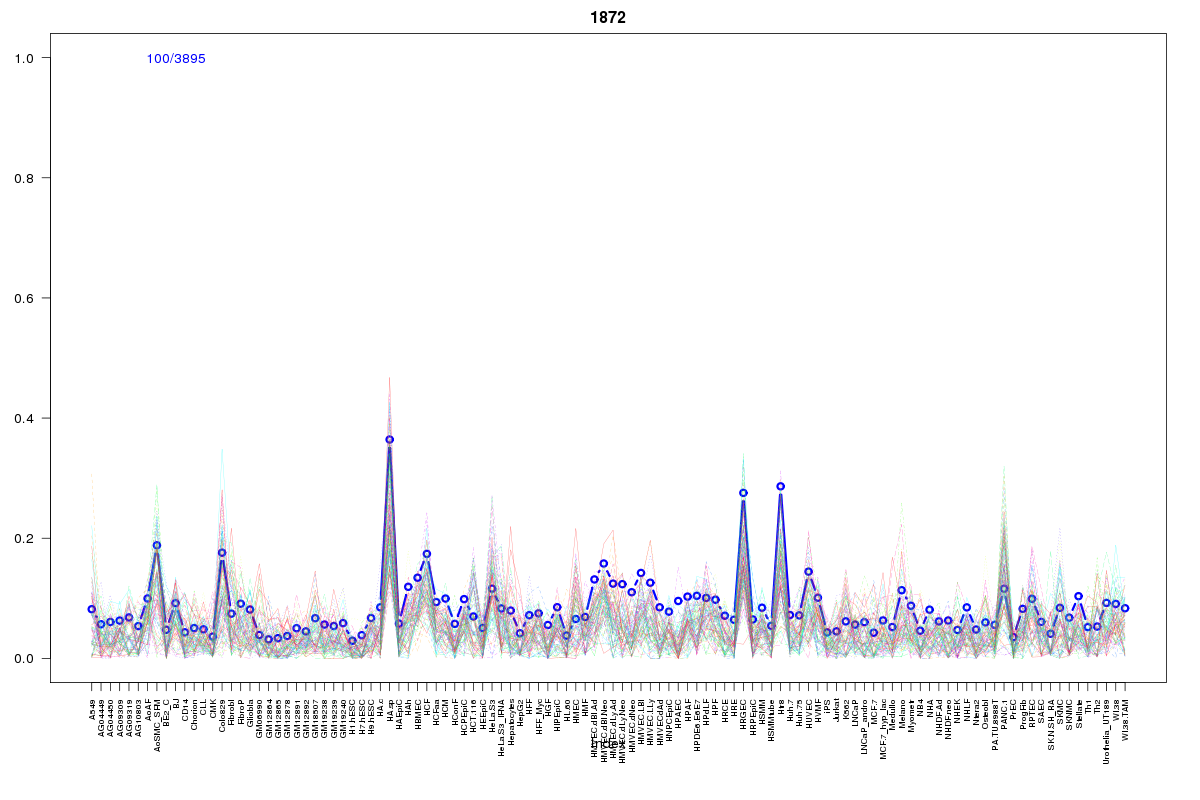 | 1872 | 1 |
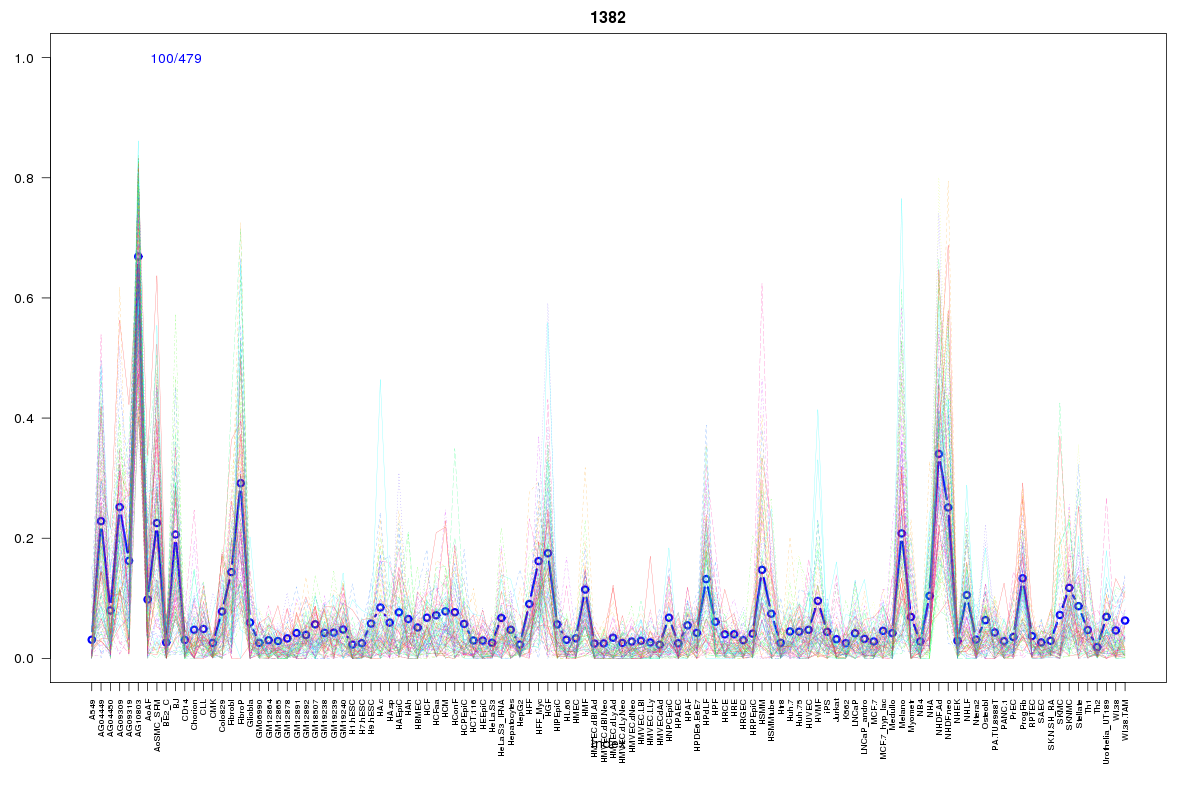 | 1382 | 1 |
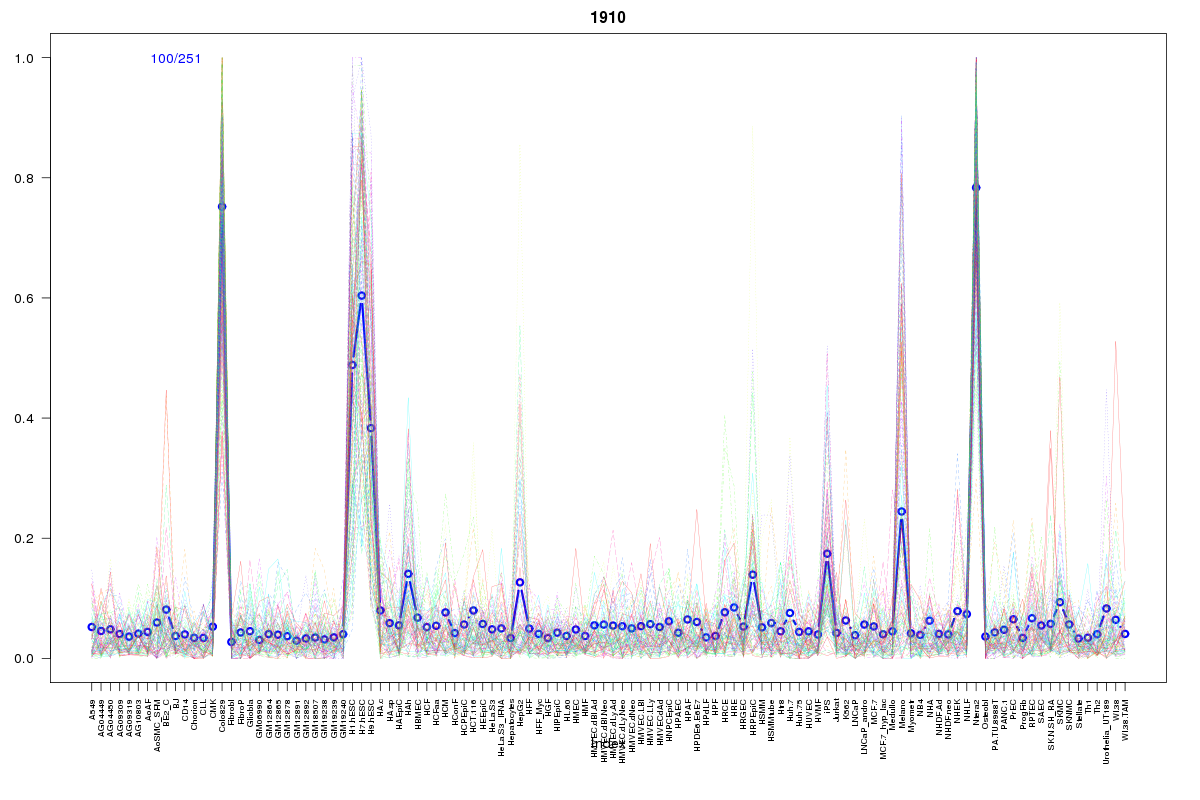 | 1910 | 1 |
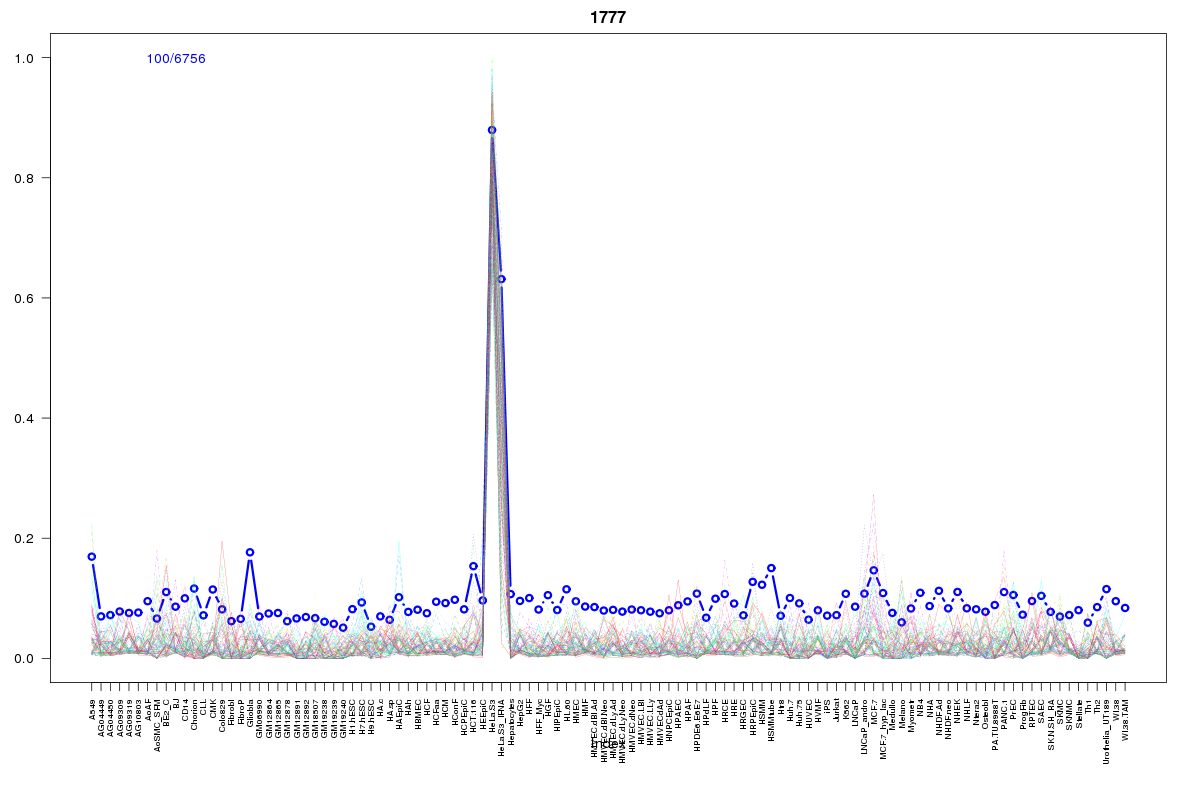 | 1777 | 1 |
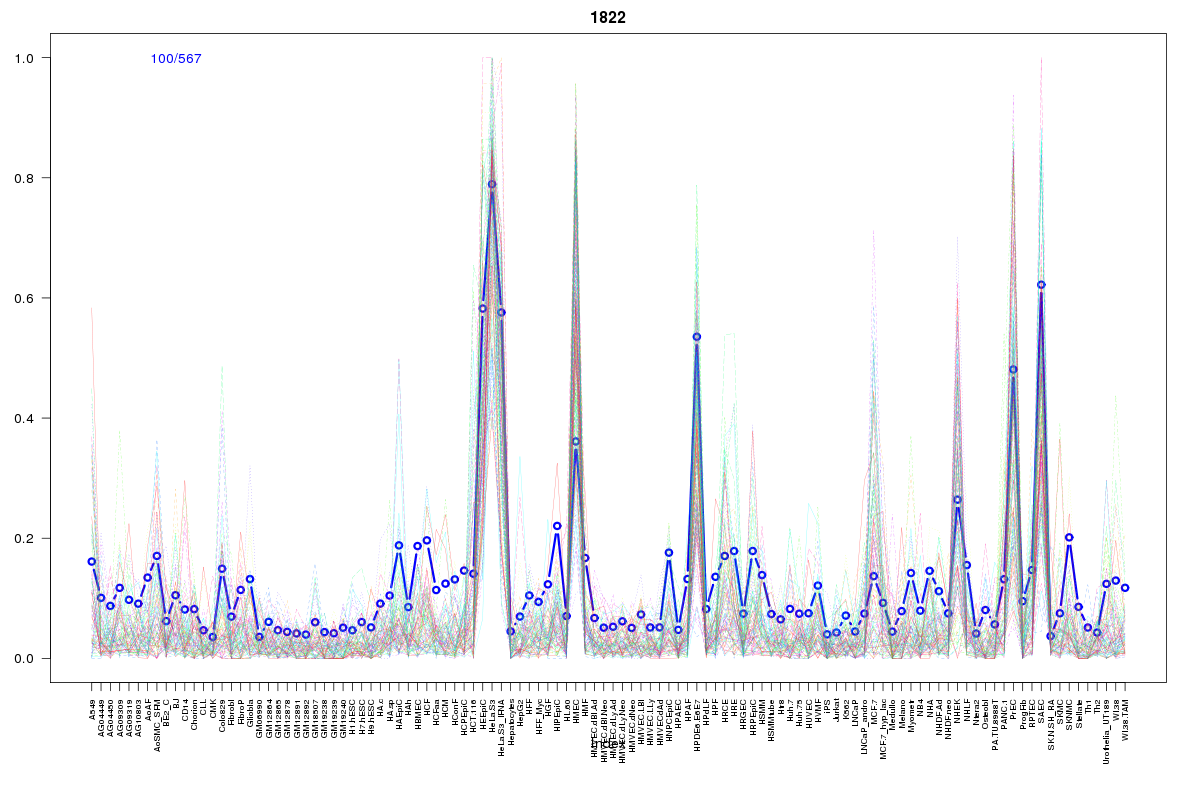 | 1822 | 1 |
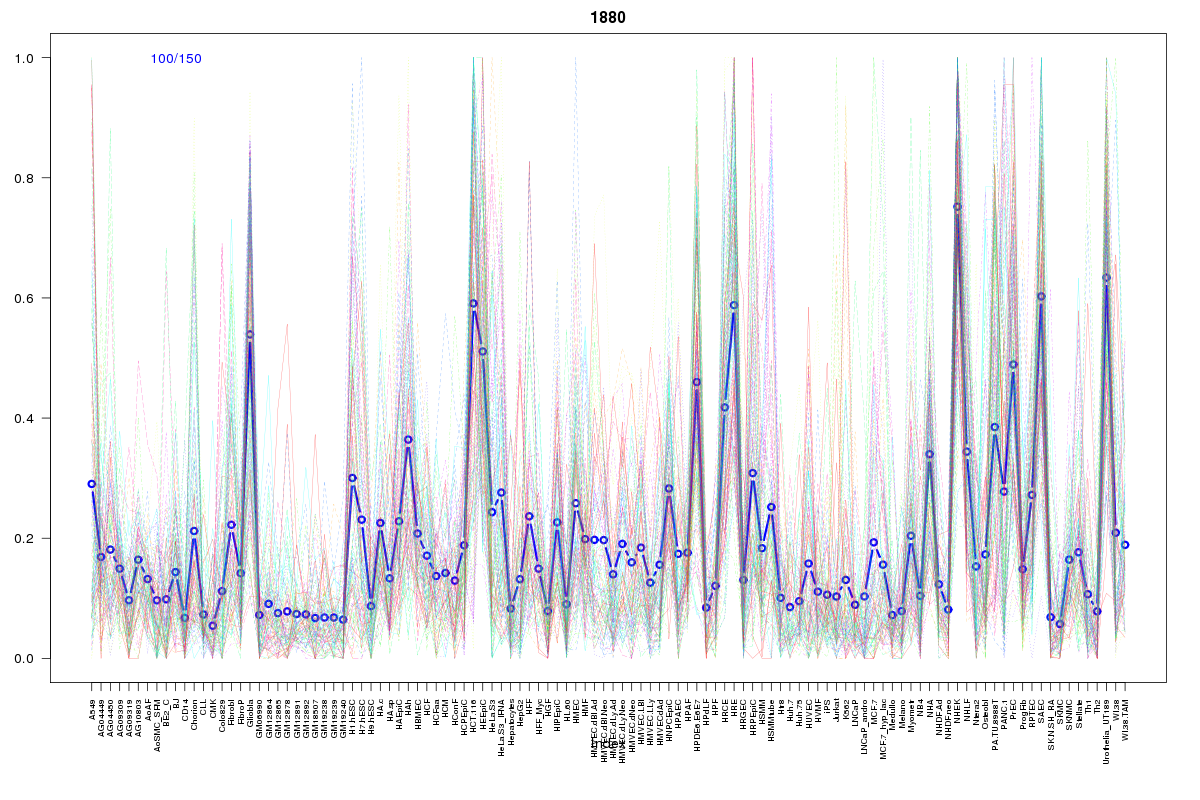 | 1880 | 1 |
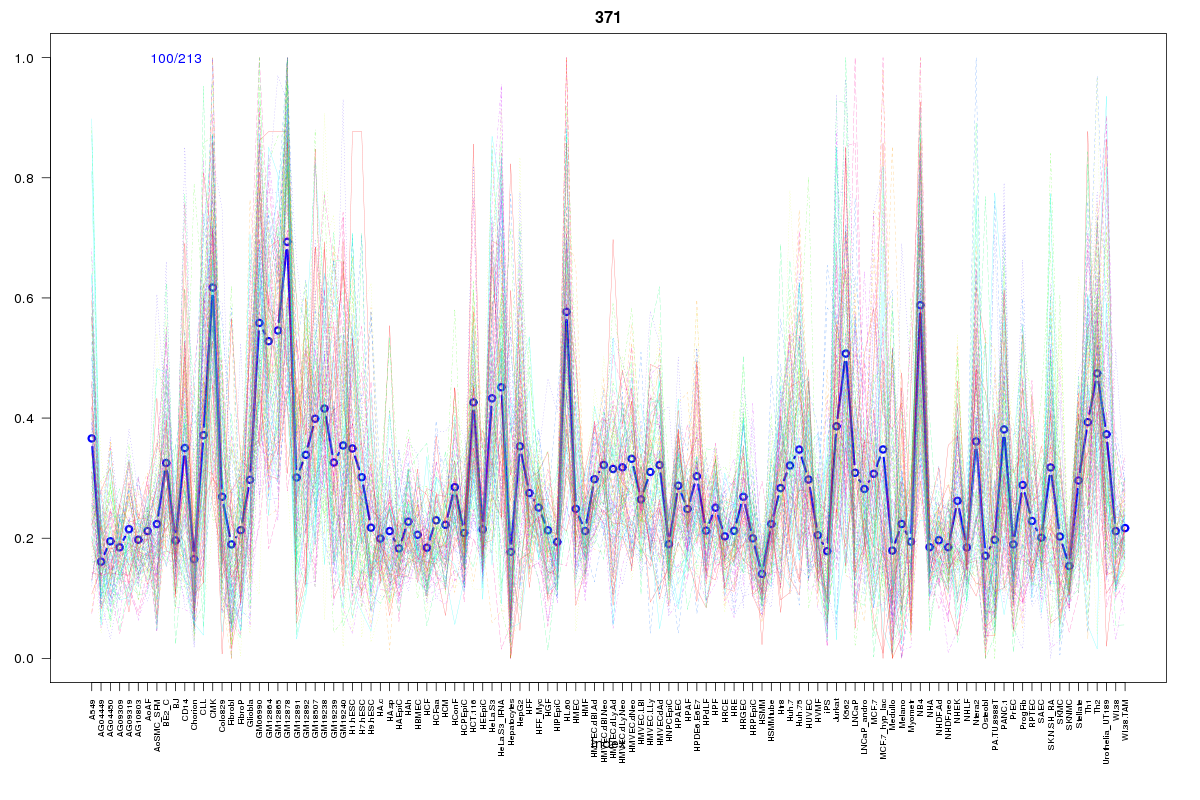 | 371 | 1 |
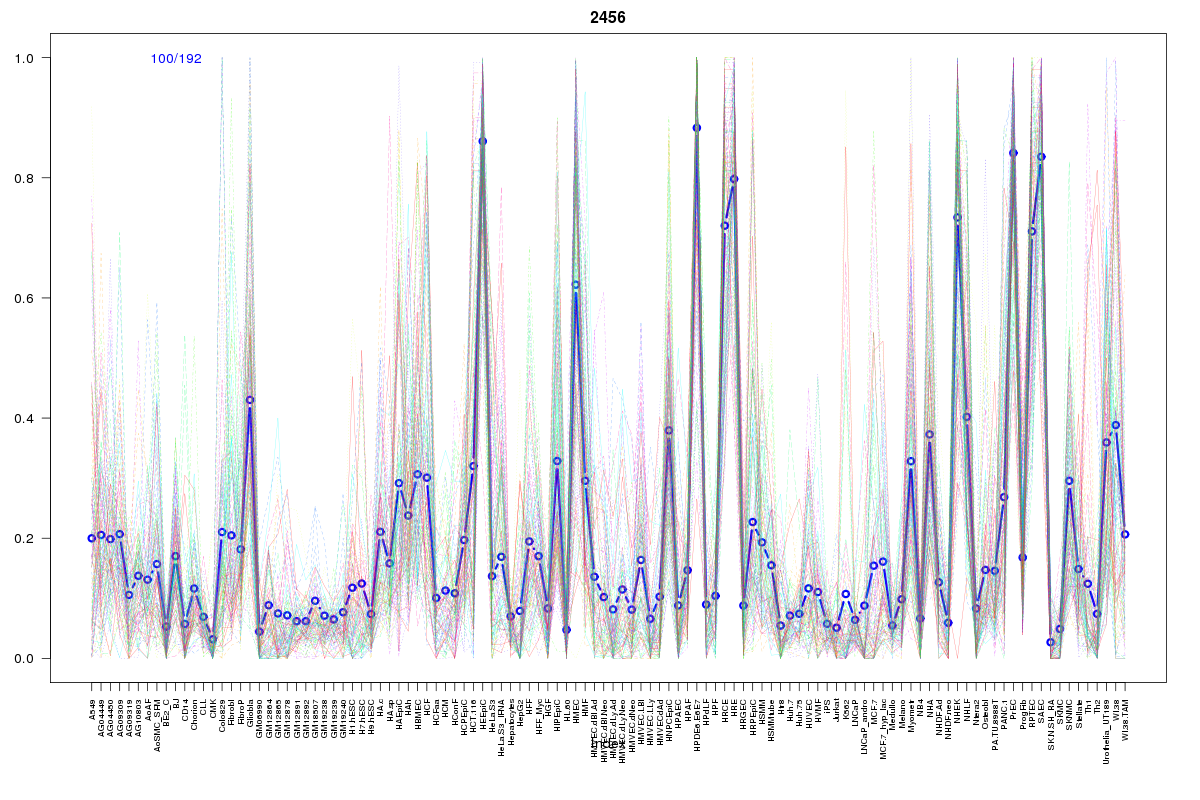 | 2456 | 1 |
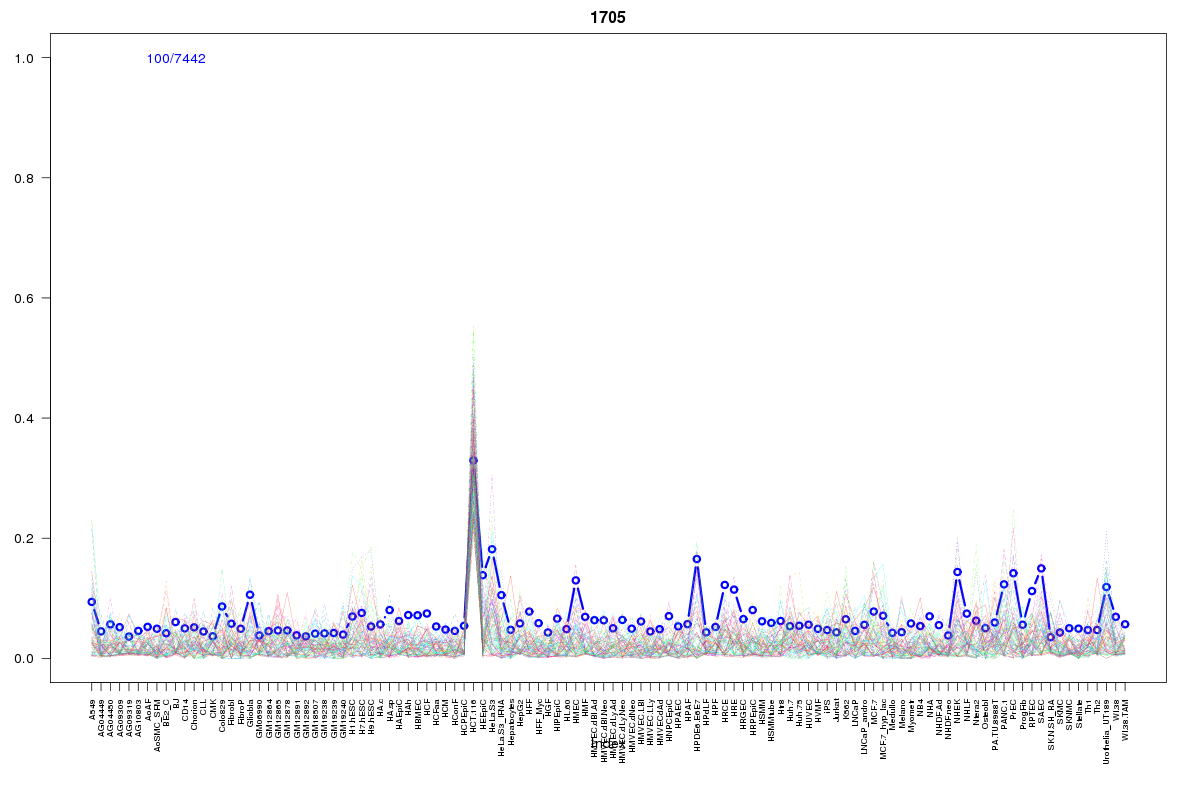 | 1705 | 1 |
 | 2468 | 1 |
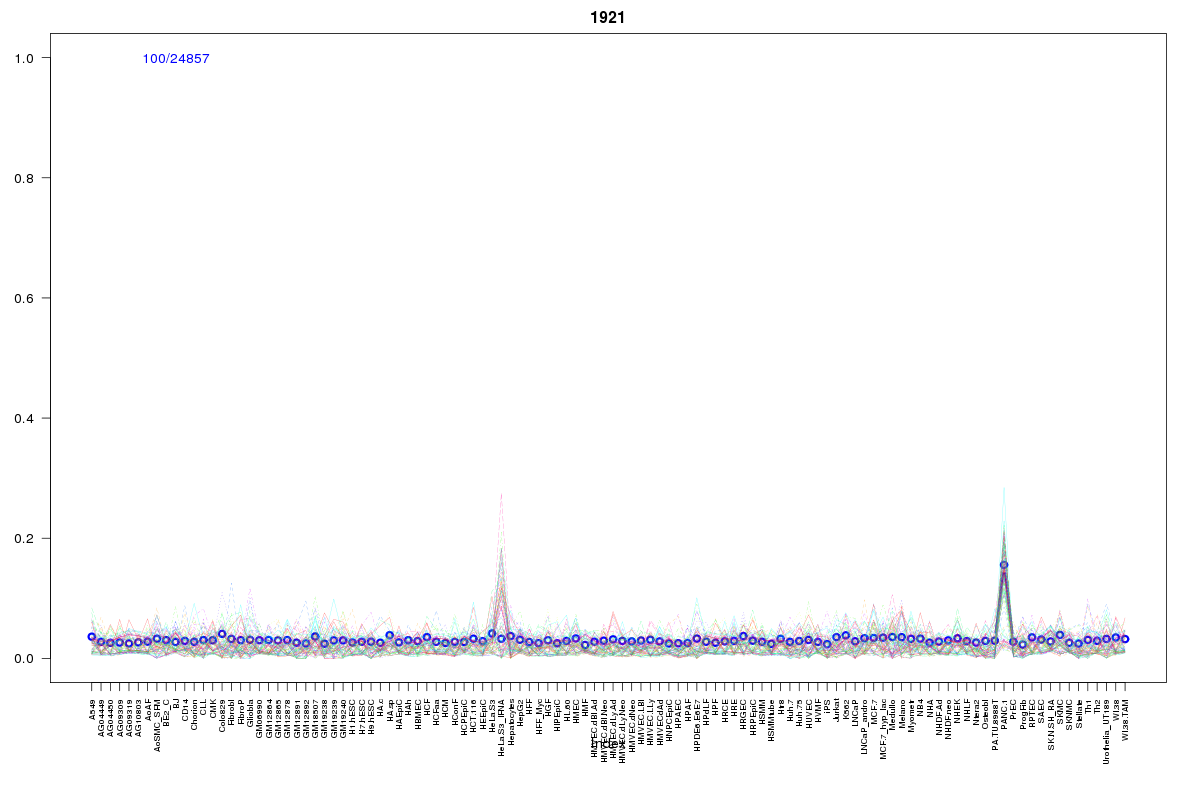 | 1921 | 1 |
 | 946 | 1 |
 | 2186 | 1 |
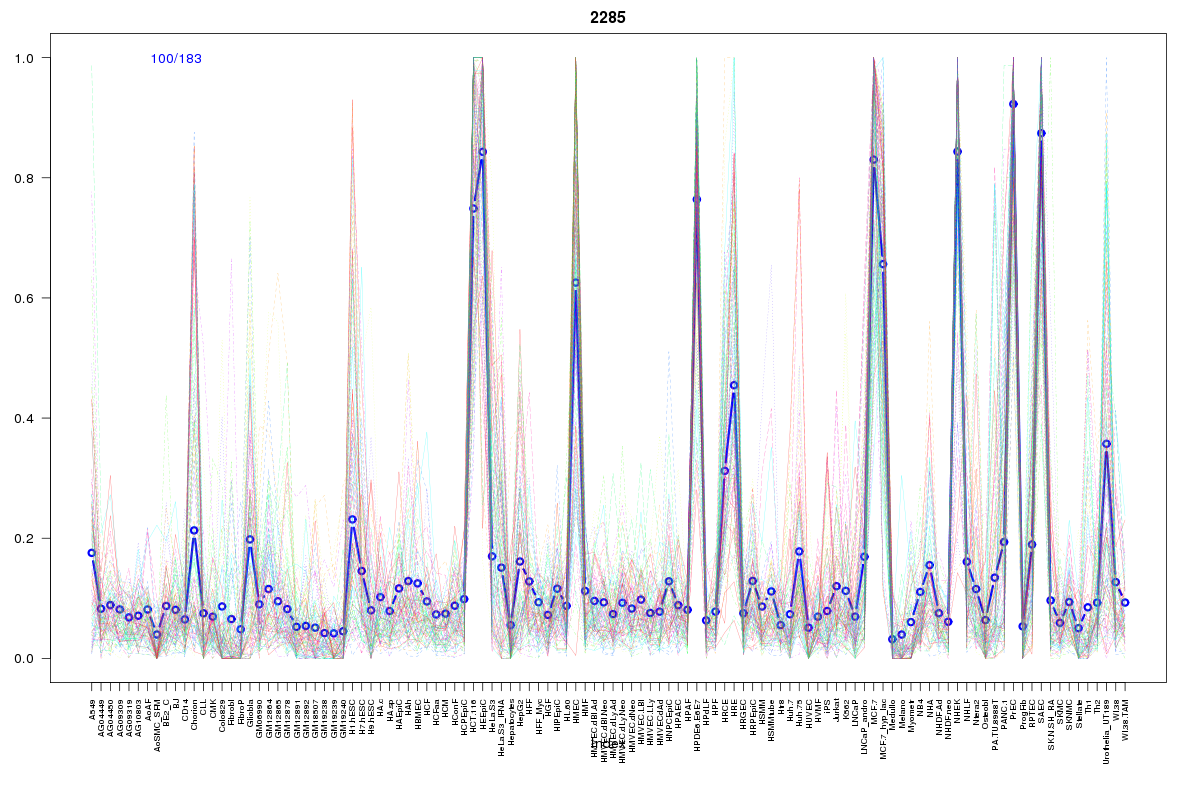 | 2285 | 1 |
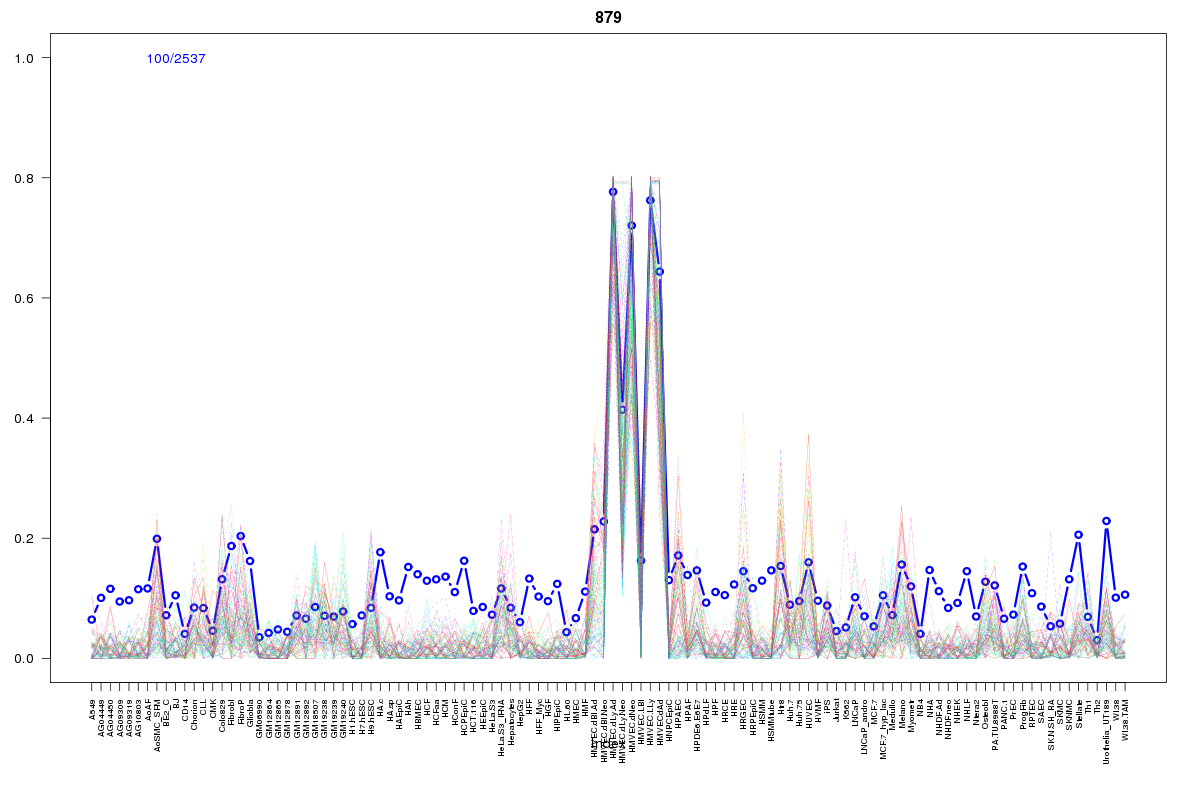 | 879 | 1 |
Resources
BED file downloads
Connects to 22 DHS sitesTop 10 Correlated DHS Sites
p-values indiciate significant higher or lower correlation| Location | Cluster | P-value |
|---|---|---|
| chr2:26565900-26566050 | 1822 | 0.002 |
| chr2:26539105-26539255 | 808 | 0.003 |
| chr2:26607220-26607370 | 2468 | 0.004 |
| chr2:26575900-26576050 | 2456 | 0.004 |
| chr2:26569580-26569730 | 371 | 0.004 |
| chr2:26565645-26565795 | 1777 | 0.004 |
| chr2:26567620-26567770 | 1880 | 0.004 |
| chr2:26552800-26552950 | 1872 | 0.007 |
| chr2:26658025-26658175 | 2186 | 0.019 |
| chr2:26515660-26515810 | 2285 | 0.019 |
| chr2:26578720-26578870 | 1705 | 0.023 |
External Databases
UCSCEnsembl (ENSG00000138018)