SOM cluster: 1461
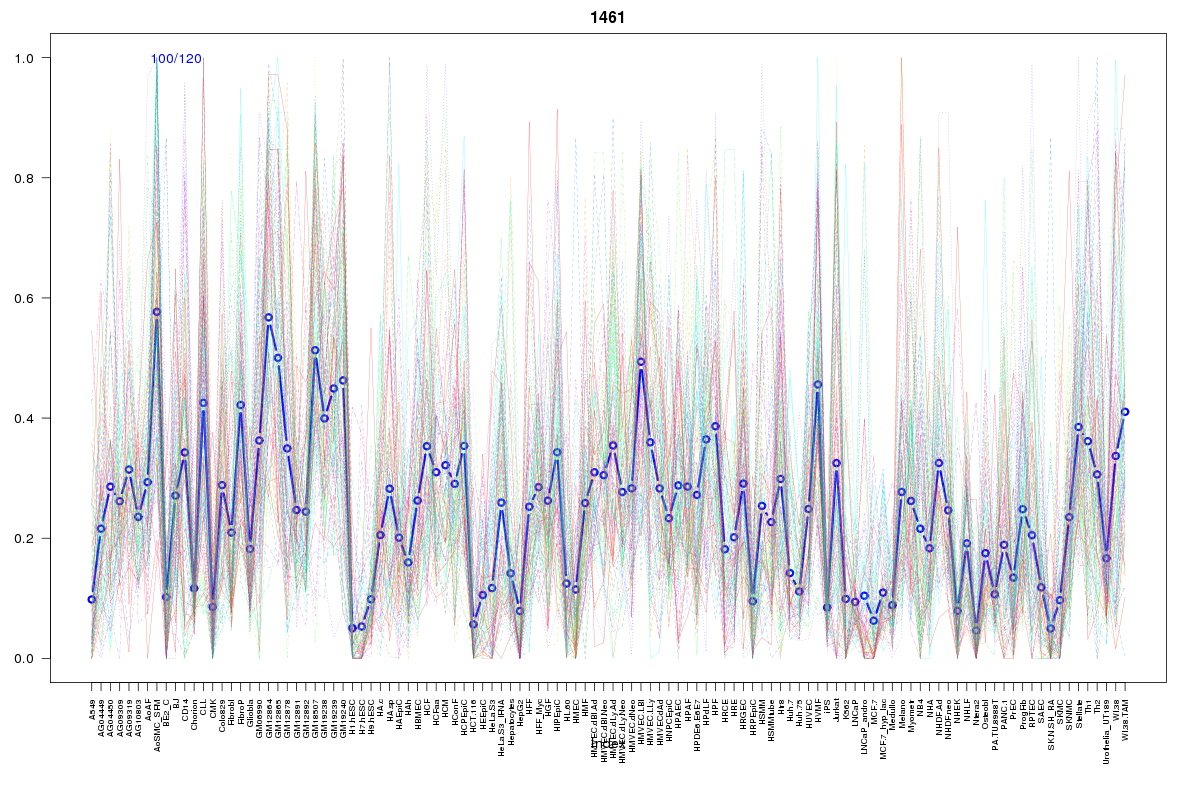
Cluster Hypersensitivity Profile

Genomic Location Trend
These plots show the distribution of the DHS sites surrounding the Transcript Start Site of the nearest gene.
Stats
Number of sites: 120Promoter: 9%
CpG-Island: 2%
Conserved: 51%
Enriched Motifs & Matches
Match Detail: [Jaspar]
|
| ||
|---|---|---|
| Sites: 56/100 | e-val: 0 | ||
| Factor | e-val(match) | DB |
| IRF1 | 0.000000000000037081 | JASPAR |
| IRF2 | 0.000000000011531 | JASPAR |
| SPI1 | 0.010938 | JASPAR |
| RORA_1 | 0.037632 | JASPAR |
| ELK4 | 0.054986 | JASPAR |
|
| ||
| Sites: 25/100 | e-val: 0.33 | ||
| Factor | e-val(match) | DB |
| FOXI1 | 0.0000067607 | JASPAR |
| Foxd3 | 0.000010166 | JASPAR |
| Foxq1 | 0.000051836 | JASPAR |
| ARID3A | 0.0031503 | JASPAR |
| FOXA1 | 0.0060854 | JASPAR |
BED file downloads
Top 10 Example Regions
| Location | Gene Link | Dist. |
|---|---|---|
| chr1: 172150120-172150270 | DNM3 | 34.34 |
| chr3: 148760880-148761030 | UBQLN4P1 | 35.54 |
| chrX: 12996680-12996830 | TLR8 | 38.31 |
| chrX: 12996680-12996830 | TMSB4X | 38.31 |
| chrX: 12996680-12996830 | TLR8-AS1 | 38.31 |
| chr8: 74903740-74903890 | LY96 | 40.1 |
| chr2: 198702880-198703030 | AC011997.1 | 64.54 |
| chr19: 10609240-10609390 | PDE4A | 66.87 |
| chr19: 10609240-10609390 | AP1M2 | 66.87 |
| chr1: 89594560-89594710 | GBP1 | 67.36 |