SOM cluster: 689
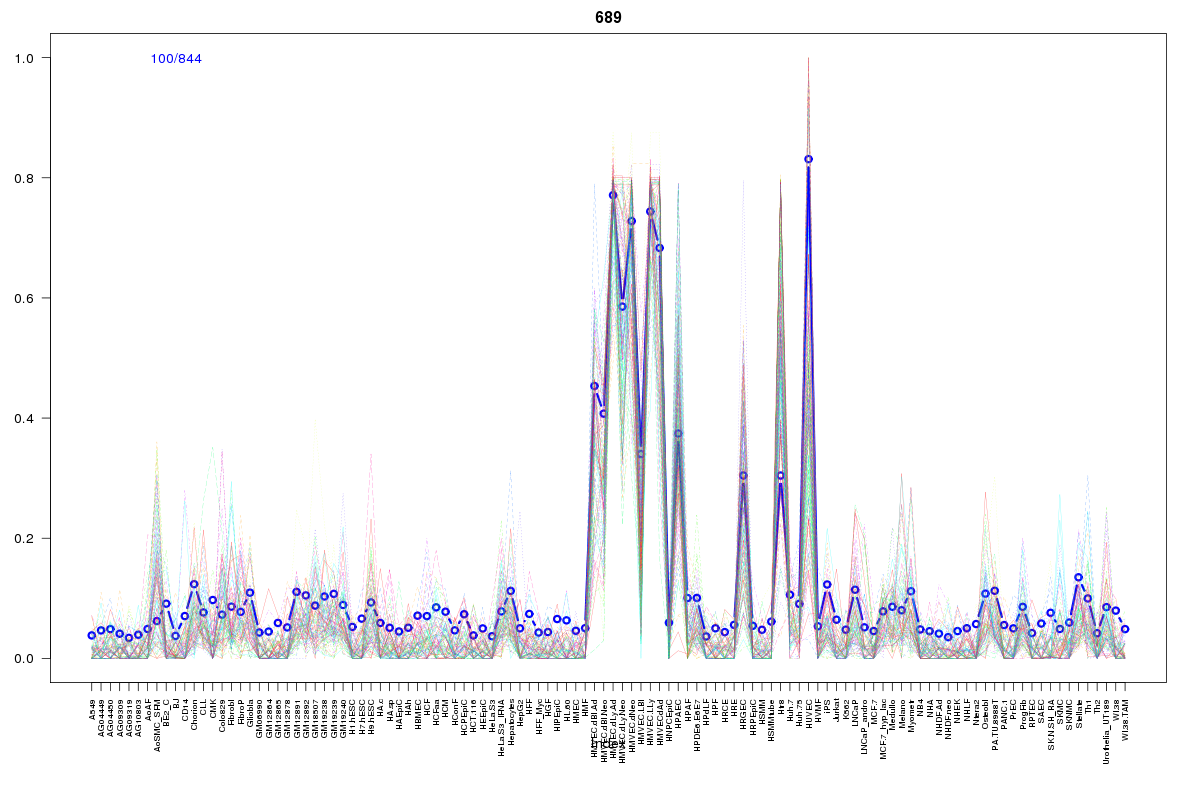
Cluster Hypersensitivity Profile

Genomic Location Trend
These plots show the distribution of the DHS sites surrounding the Transcript Start Site of the nearest gene.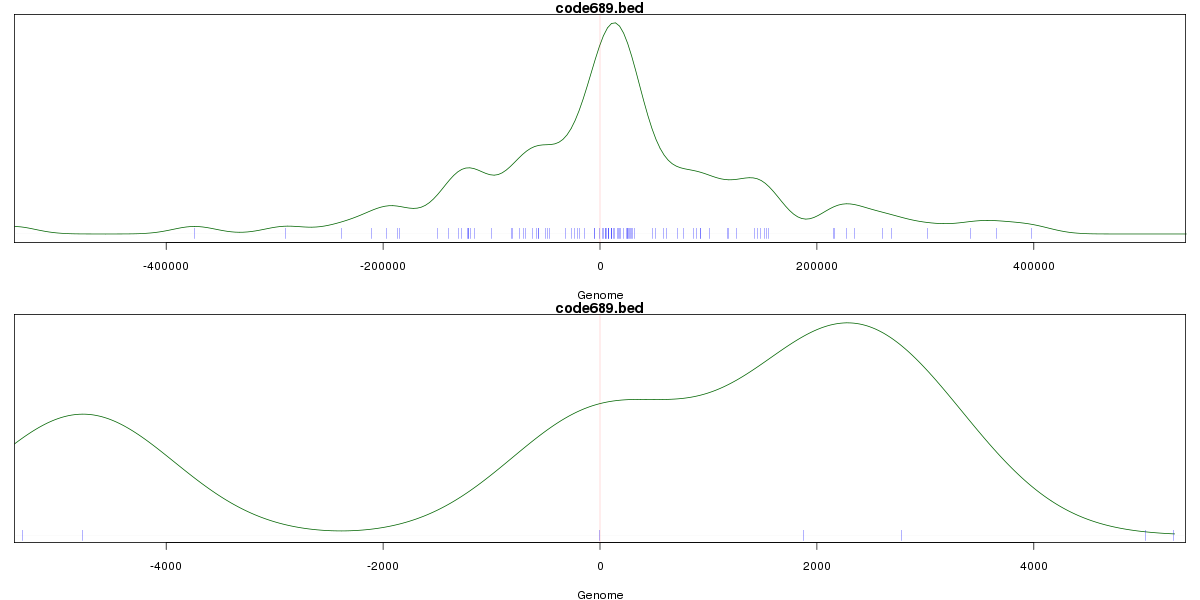
Stats
Number of sites: 844Promoter: 1%
CpG-Island: 0%
Conserved: 35%
Enriched Motifs & Matches
Match Detail: [Jaspar]
|
| ||
|---|---|---|
| Sites: 43/100 | e-val: 0.000000053 | ||
| Factor | e-val(match) | DB |
| Foxd3 | 0.00000010709 | JASPAR |
| Foxq1 | 0.0000047364 | JASPAR |
| FOXF2 | 0.000008421 | JASPAR |
| SRY | 0.000050951 | JASPAR |
| Sox5 | 0.00026555 | JASPAR |
|
| ||
| Sites: 37/100 | e-val: 8.9e-19 | ||
| Factor | e-val(match) | DB |
| FEV | 0.000001706 | JASPAR |
| SPIB | 0.0000072833 | JASPAR |
| Stat3 | 0.001287 | JASPAR |
| ELK4 | 0.0032712 | JASPAR |
| SPI1 | 0.003331 | JASPAR |
BED file downloads
Top 10 Example Regions
| Location | Gene Link | Dist. |
|---|---|---|
| chr7: 39752460-39752610 | RALA | 24.73 |
| chr15: 95869940-95870090 | CTD-2536I1.1 | 40.35 |
| chr4: 40925685-40925835 | Y_RNA | 44.55 |
| chr4: 2895520-2895670 | GRK4 | 46.65 |
| chr4: 2895520-2895670 | NOP14-AS1 | 46.65 |
| chr8: 38623260-38623410 | TACC1 | 50.02 |
| chr8: 38623260-38623410 | Y_RNA | 50.02 |
| chr8: 38623260-38623410 | RP11-723D22.2 | 50.02 |
| chr9: 34024580-34024730 | UBAP2 | 50.09 |
| chr8: 79450340-79450490 | PKIA | 50.71 |