SOM cluster: 2456
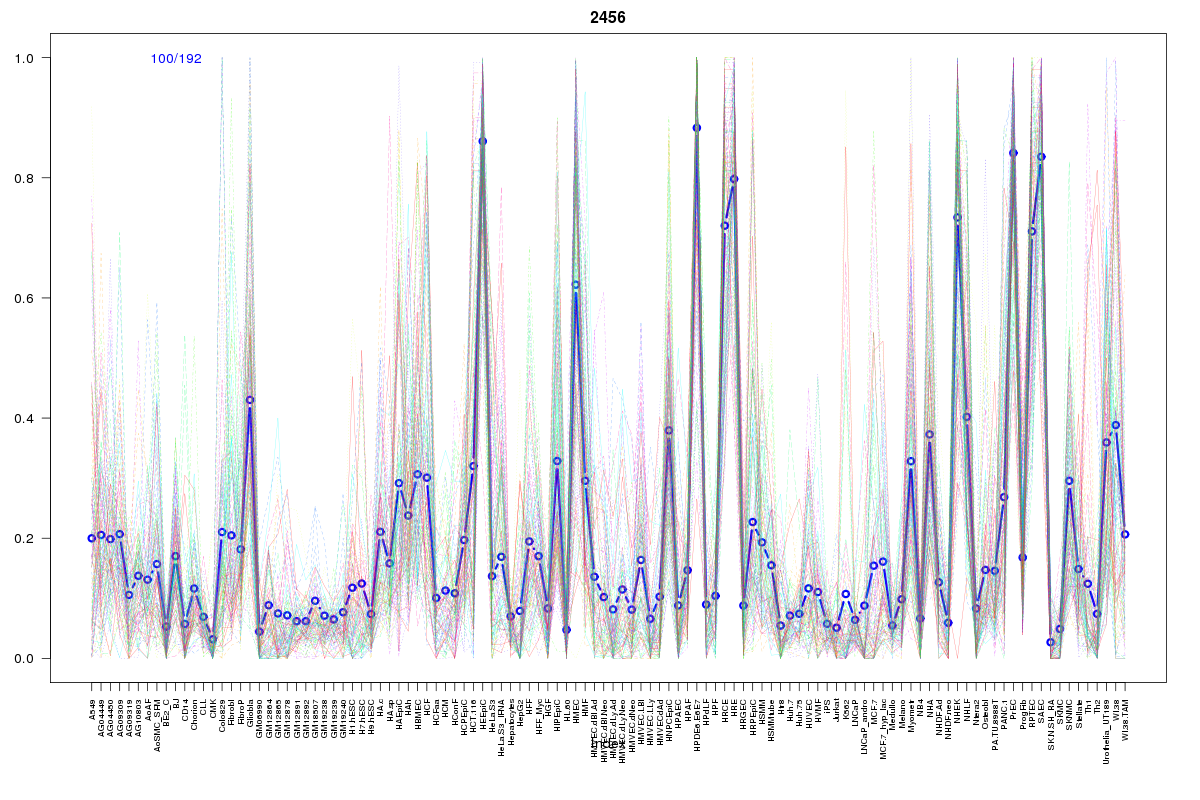
Cluster Hypersensitivity Profile

Genomic Location Trend
These plots show the distribution of the DHS sites surrounding the Transcript Start Site of the nearest gene.
Stats
Number of sites: 192Promoter: 0%
CpG-Island: 0%
Conserved: 33%
Enriched Motifs & Matches
Match Detail: [Jaspar]
|
| ||
|---|---|---|
| Sites: 58/100 | e-val: 3.5e-31 | ||
| Factor | e-val(match) | DB |
| NFE2L2 | 0.000000000020567 | JASPAR |
| AP1 | 0.0000000058116 | JASPAR |
| PPARG | 0.0061012 | JASPAR |
| NFE2L1::MafG | 0.0061486 | JASPAR |
| Pax2 | 0.0062059 | JASPAR |
BED file downloads
Top 10 Example Regions
| Location | Gene Link | Dist. |
|---|---|---|
| chr1: 149967980-149968130 | MTMR11 | 32.64 |
| chr8: 126044140-126044290 | SQLE | 50.55 |
| chr8: 126044140-126044290 | LINC00964 | 50.55 |
| chr10: 104103960-104104110 | GBF1 | 51.28 |
| chr10: 85939160-85939310 | CDHR1 | 57.19 |
| chr10: 85939160-85939310 | C10orf99 | 57.19 |
| chr3: 150461420-150461570 | SIAH2 | 65.27 |
| chr3: 150461420-150461570 | RP11-103G8.1 | 65.27 |
| chr6: 44307760-44307910 | SLC35B2 | 72.55 |
| chr6: 44307760-44307910 | TCTE1 | 72.55 |