Gene: TARS2
chr1: 150459886-150471711Expression Profile
(log scale)
Graphical Connections
Distribution of linked clusters:
You may find it interesting if many of the connected DHS sites belong to the same cluster.| Cluster Profile | Cluster ID | Number of DHS sites in this cluster |
|---|---|---|
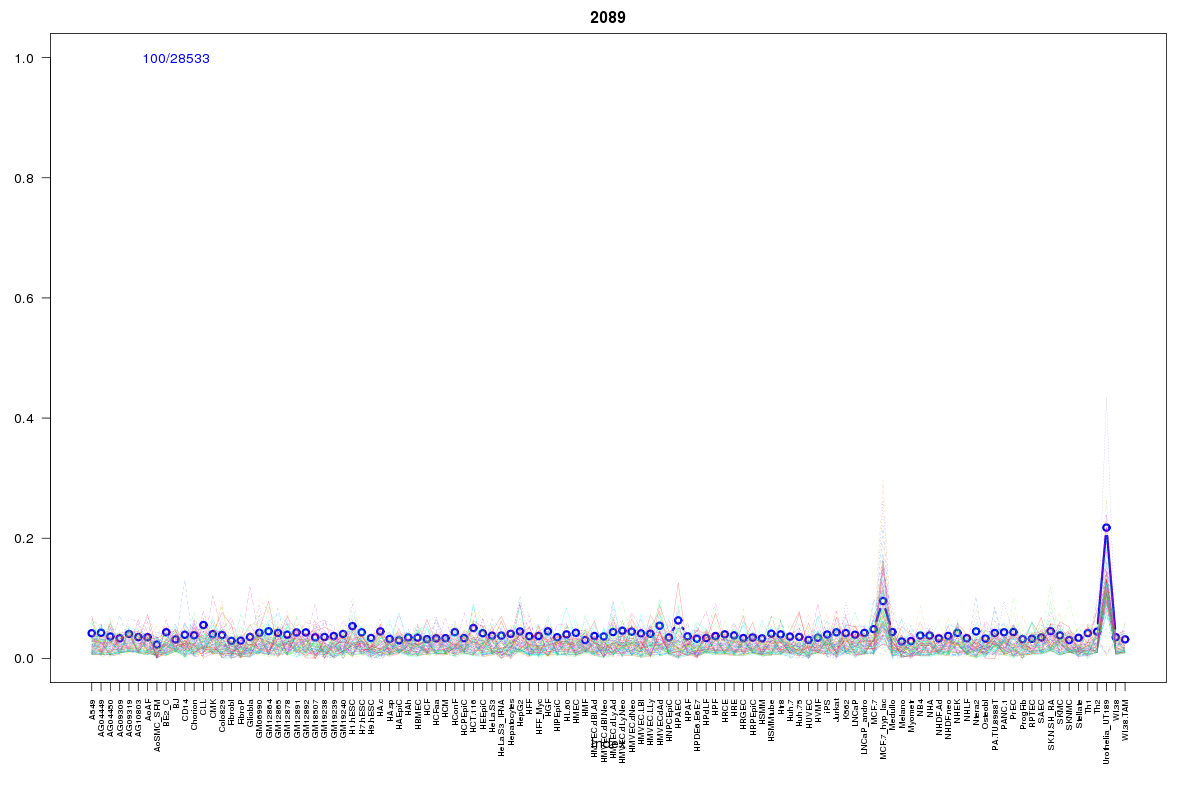 | 2089 | 2 |
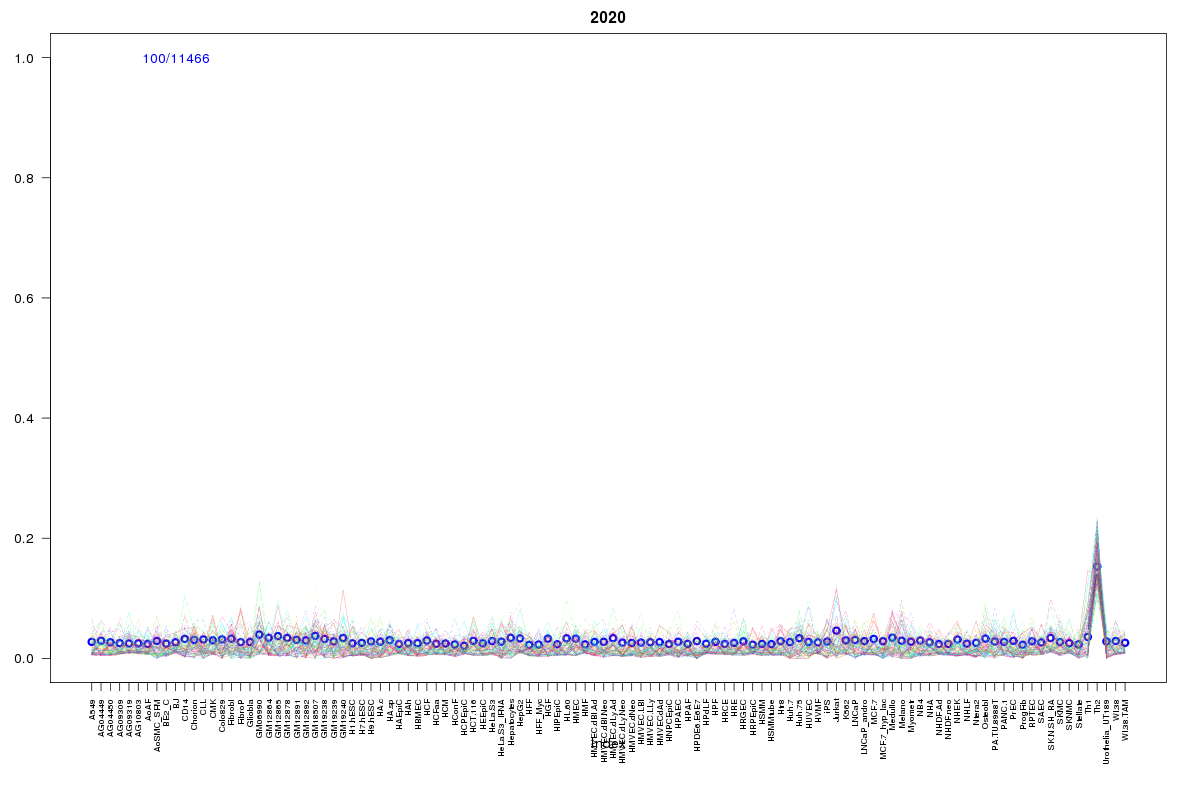 | 2020 | 1 |
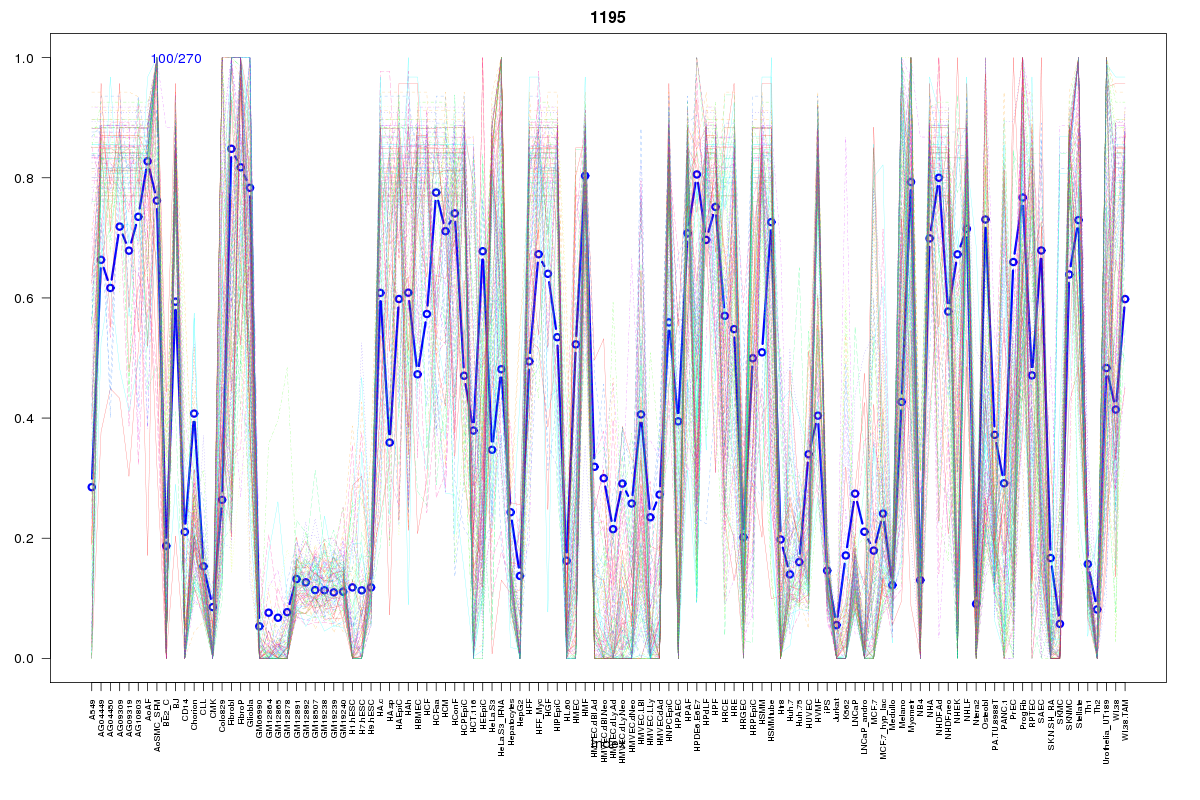 | 1195 | 1 |
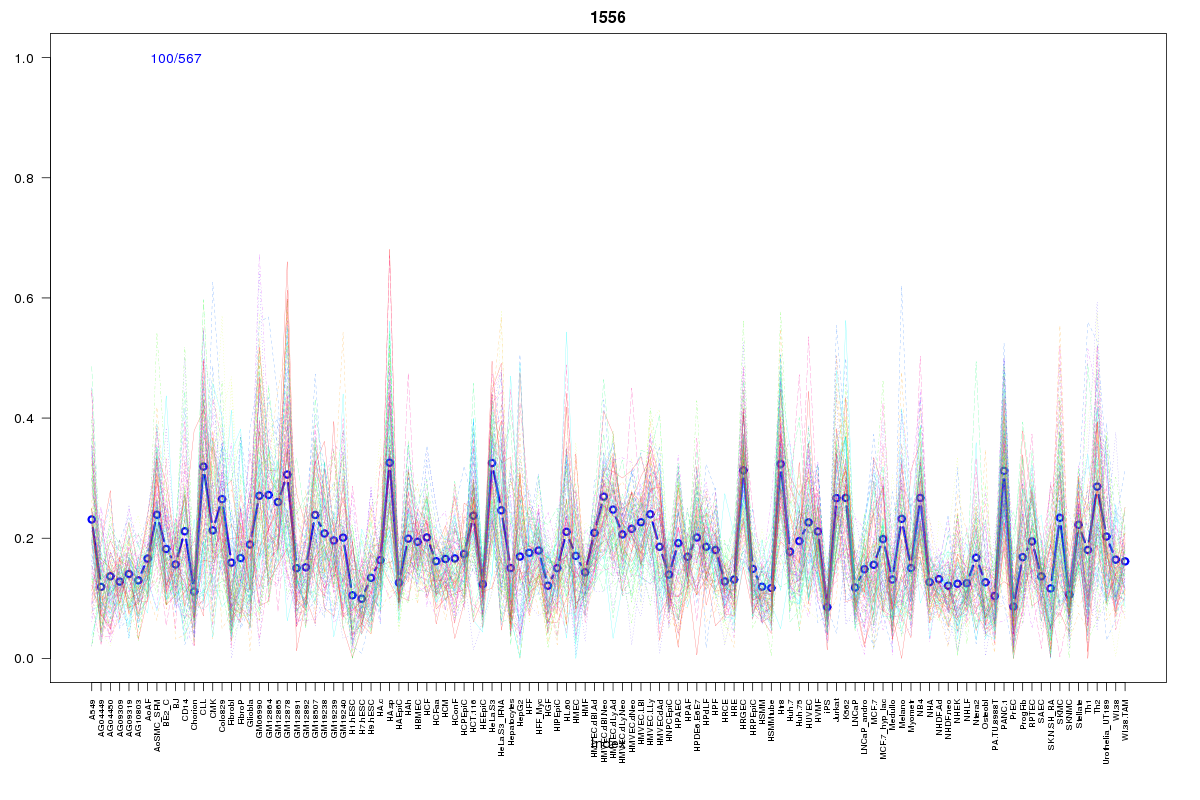 | 1556 | 1 |
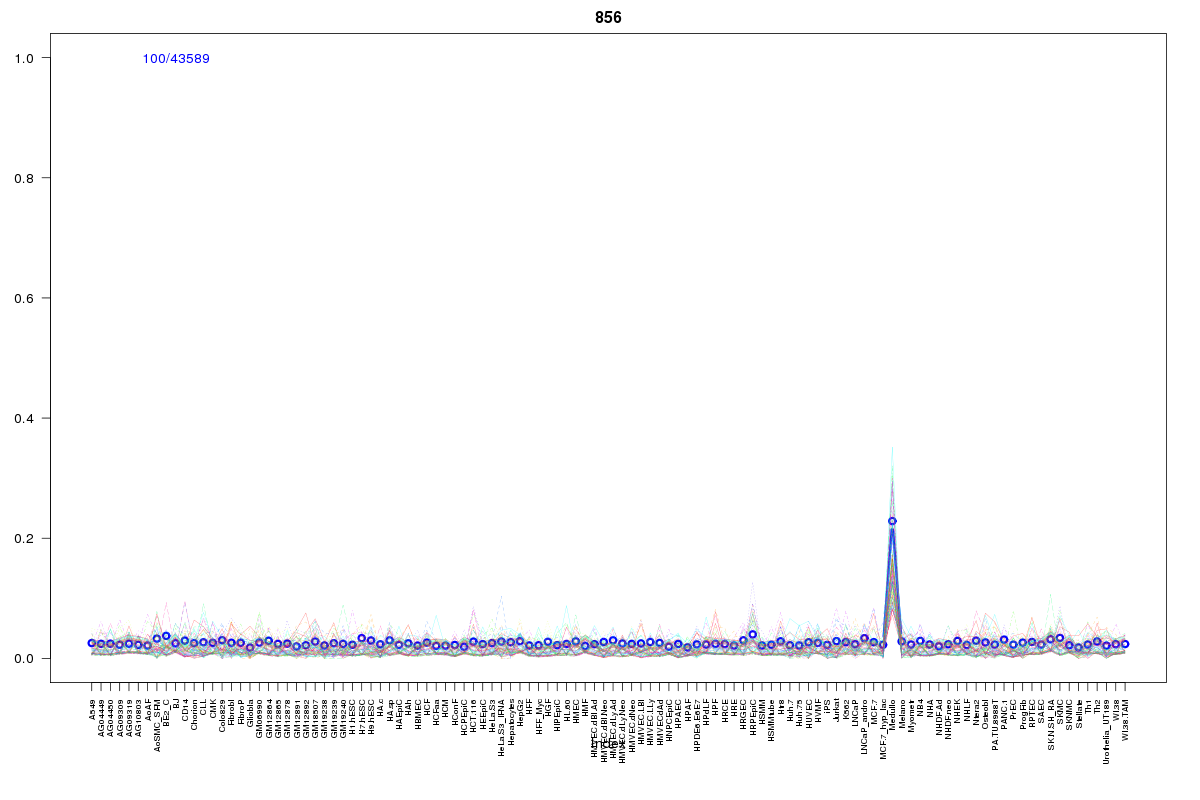 | 856 | 1 |
 | 2059 | 1 |
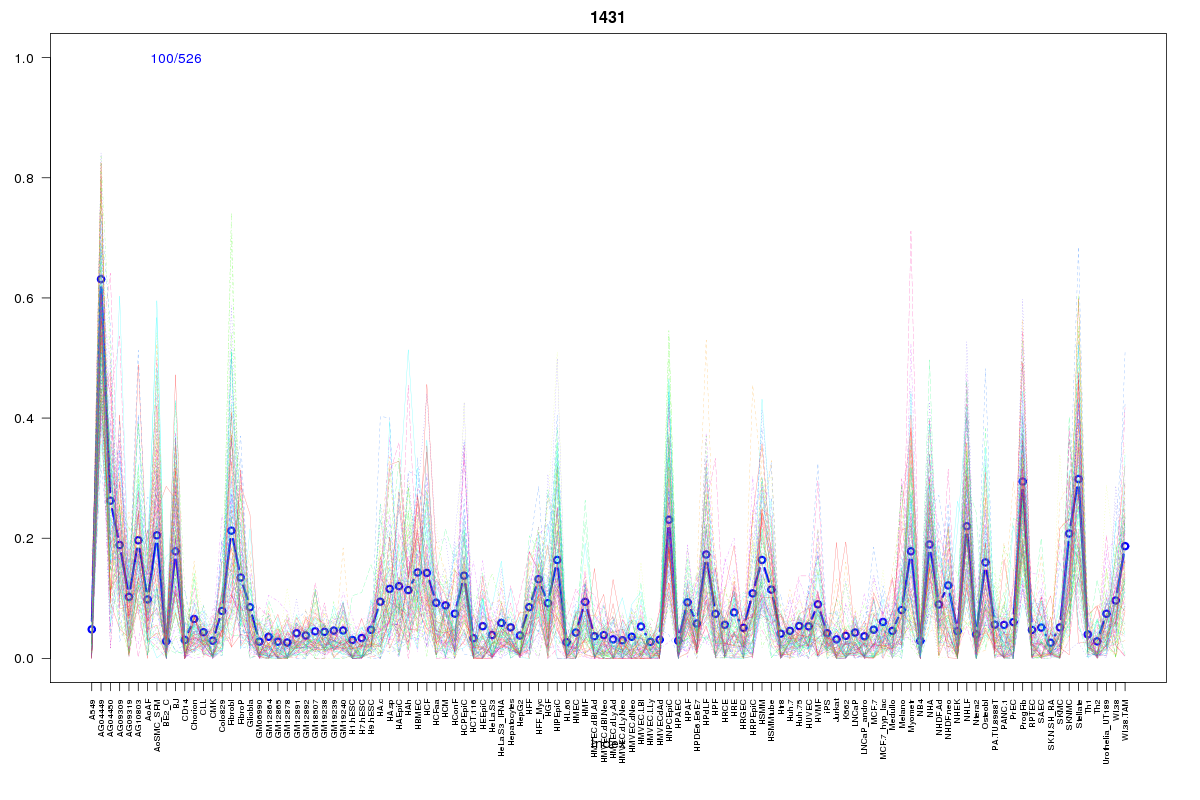 | 1431 | 1 |
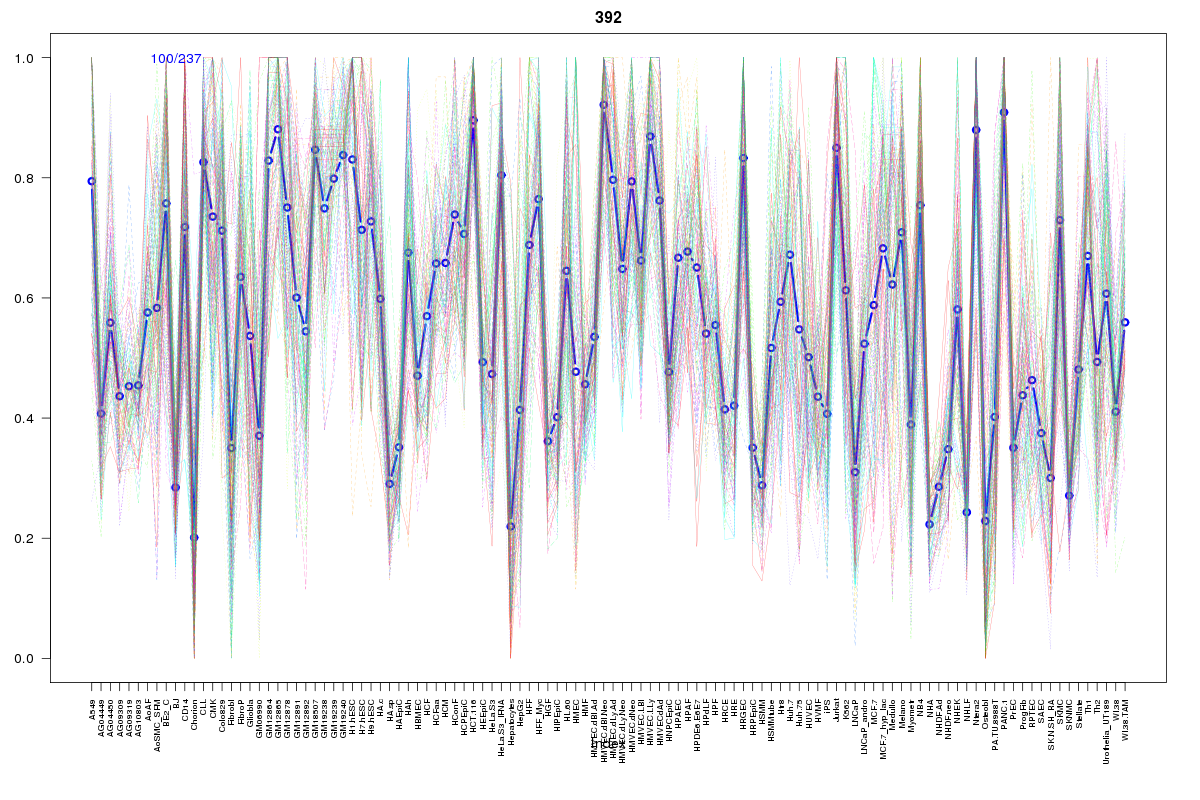 | 392 | 1 |
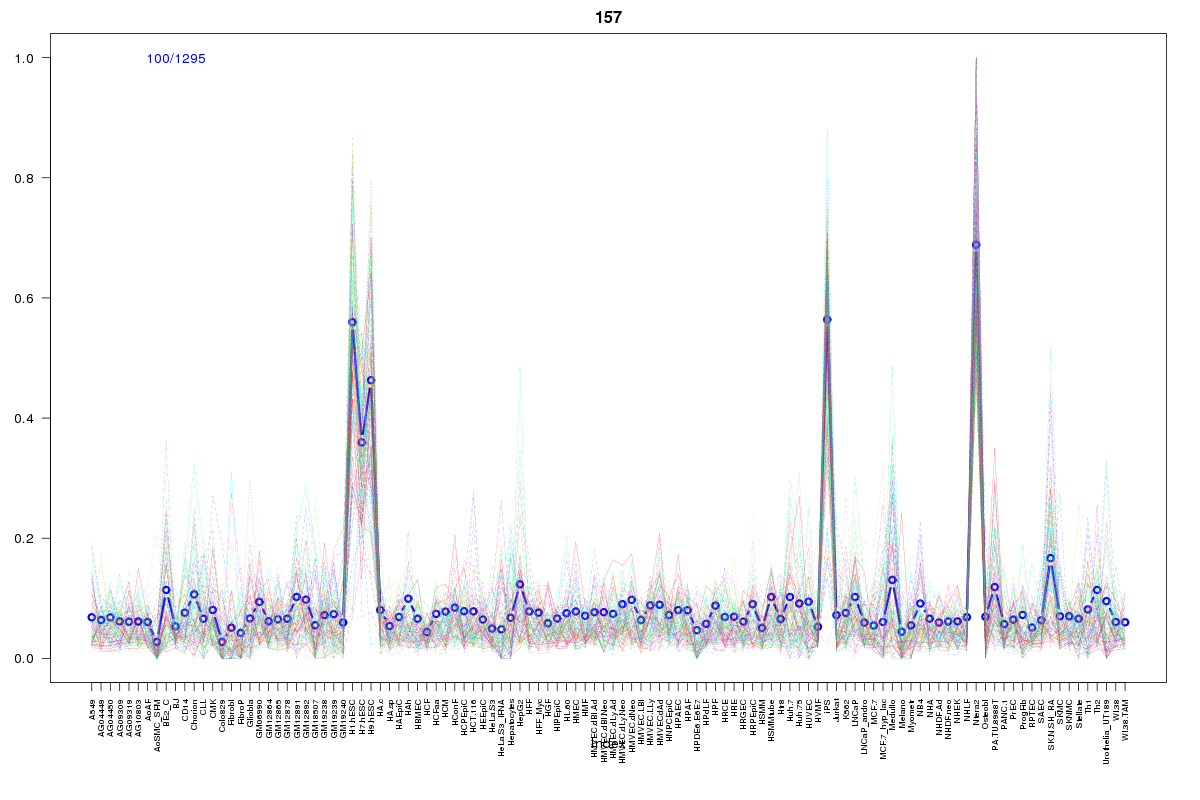 | 157 | 1 |
 | 1825 | 1 |
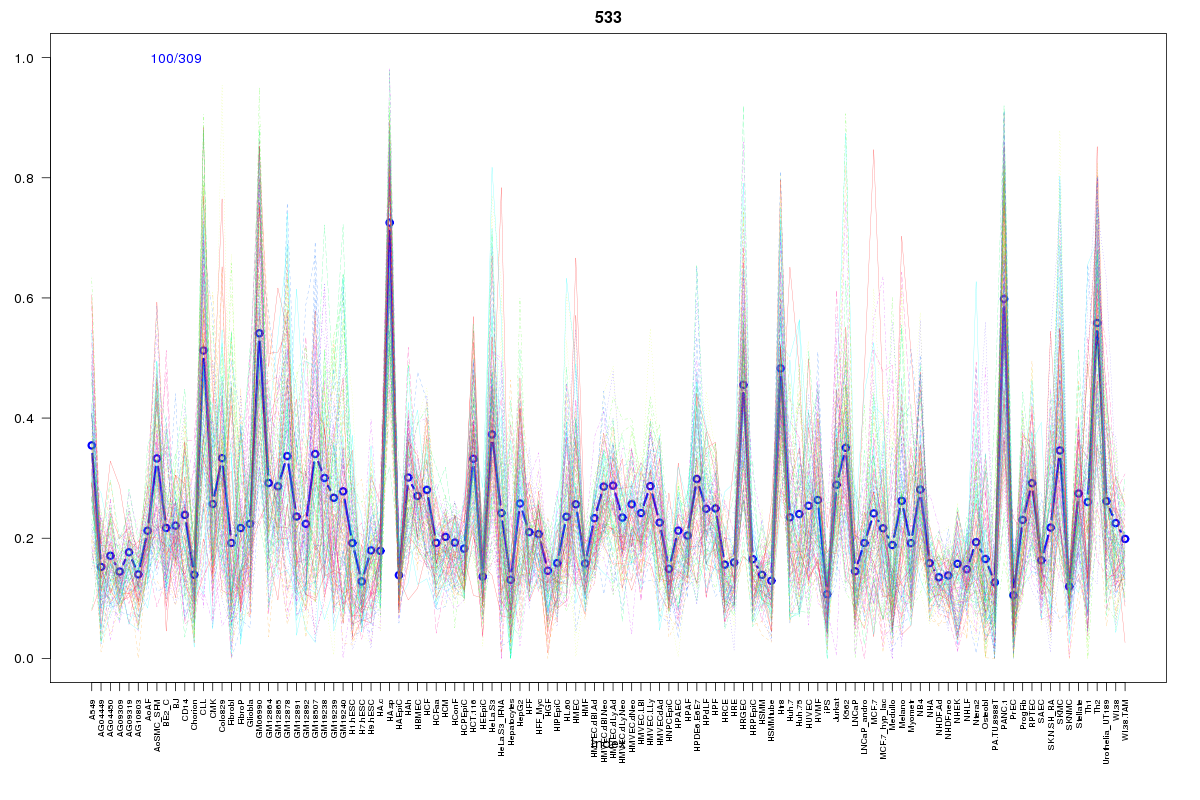 | 533 | 1 |
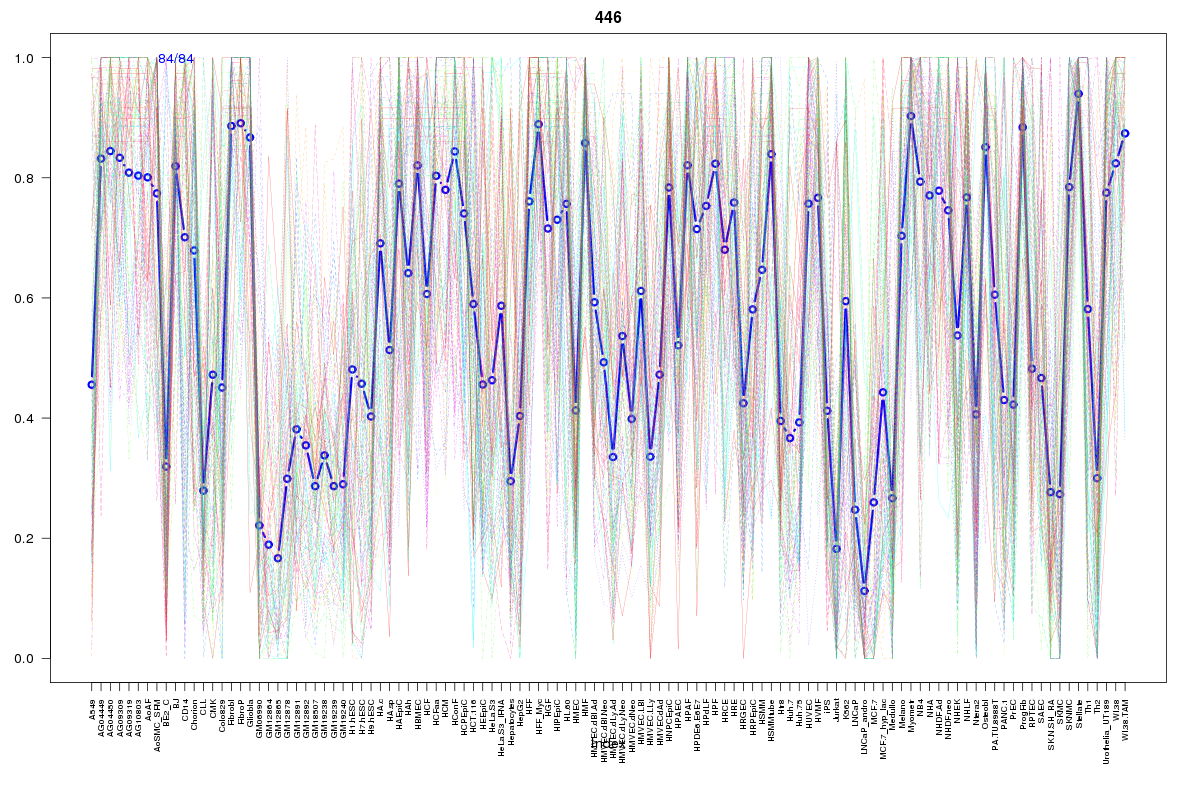 | 446 | 1 |
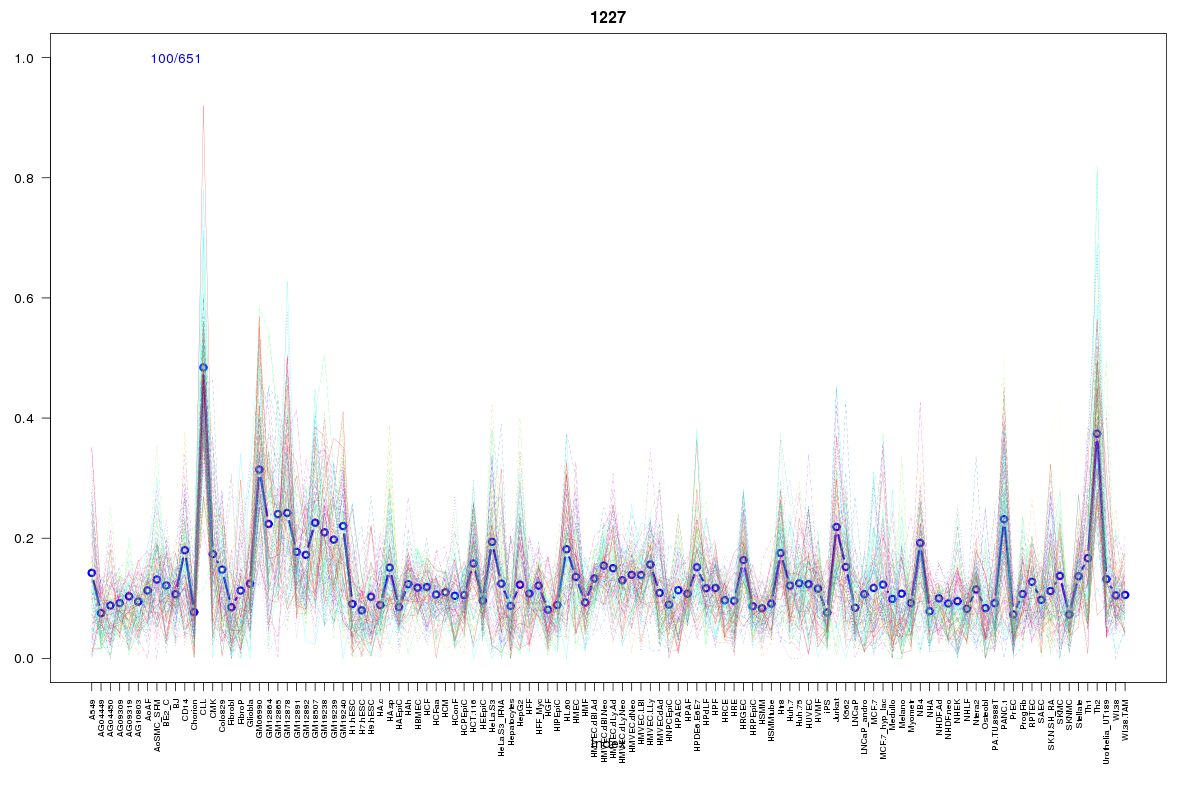 | 1227 | 1 |
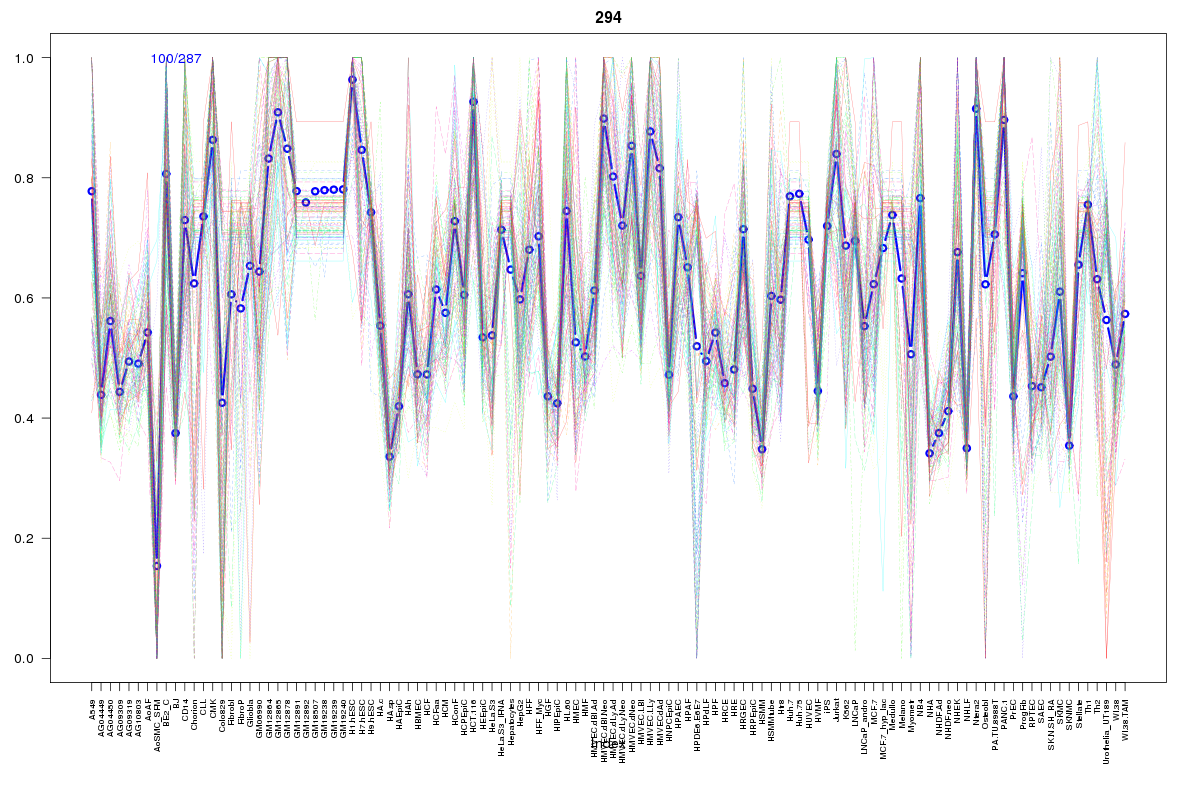 | 294 | 1 |
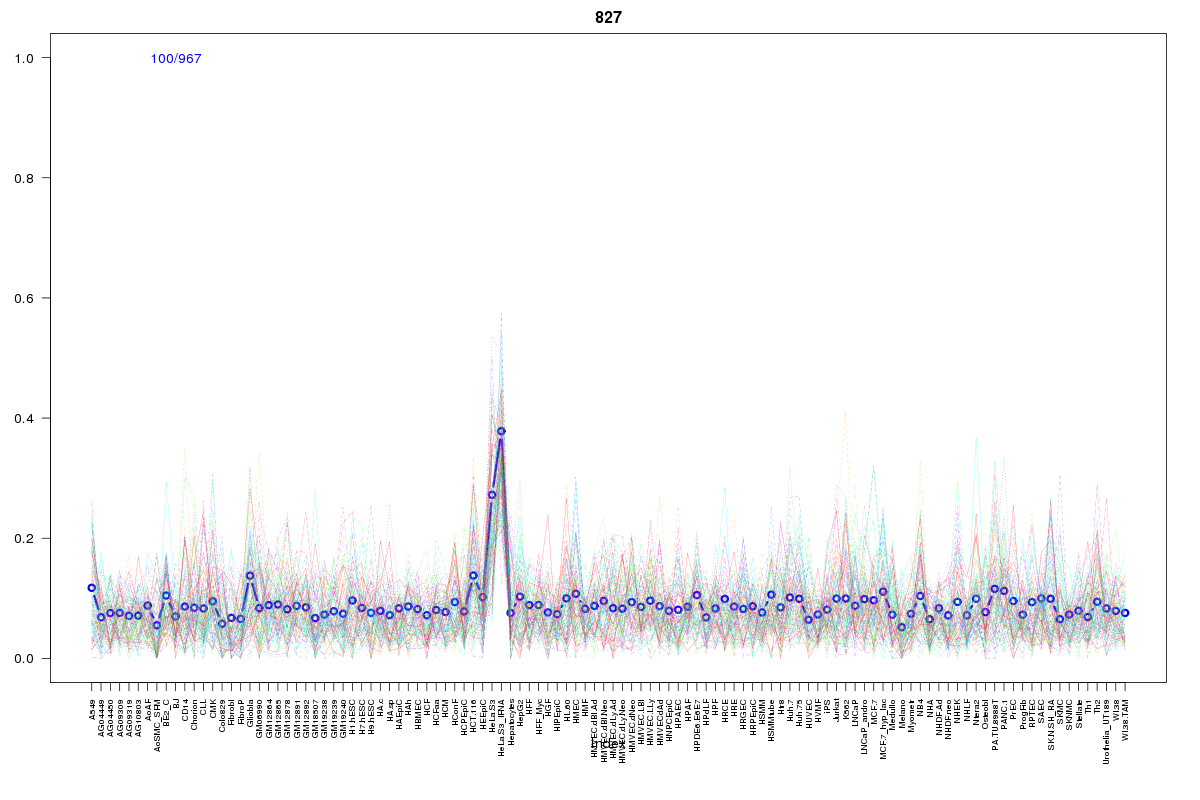 | 827 | 1 |
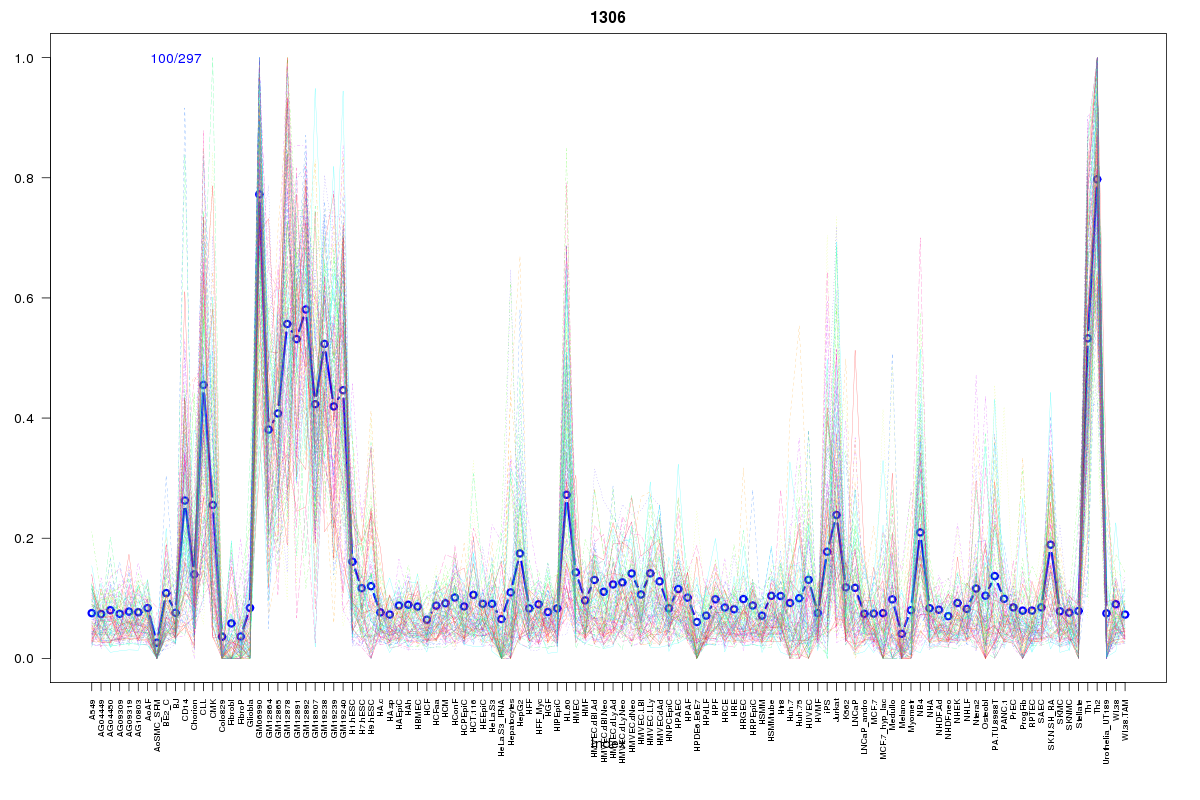 | 1306 | 1 |
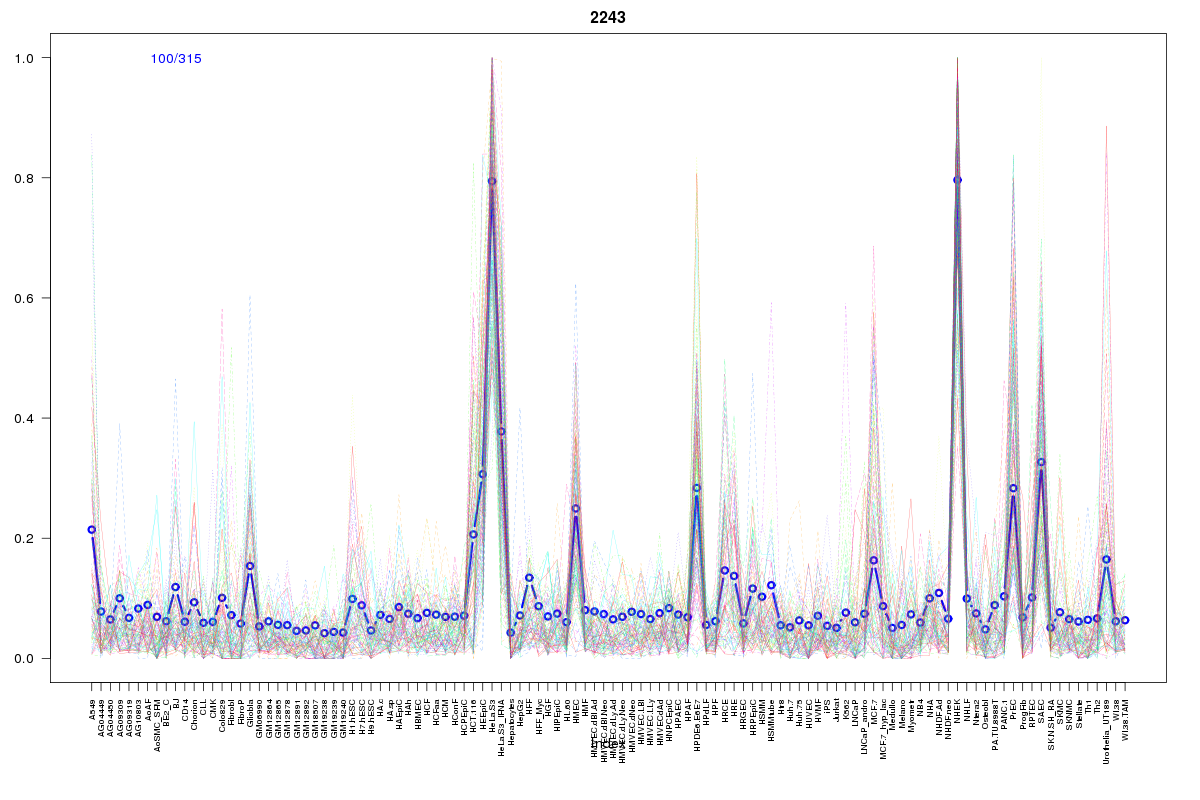 | 2243 | 1 |
 | 2062 | 1 |
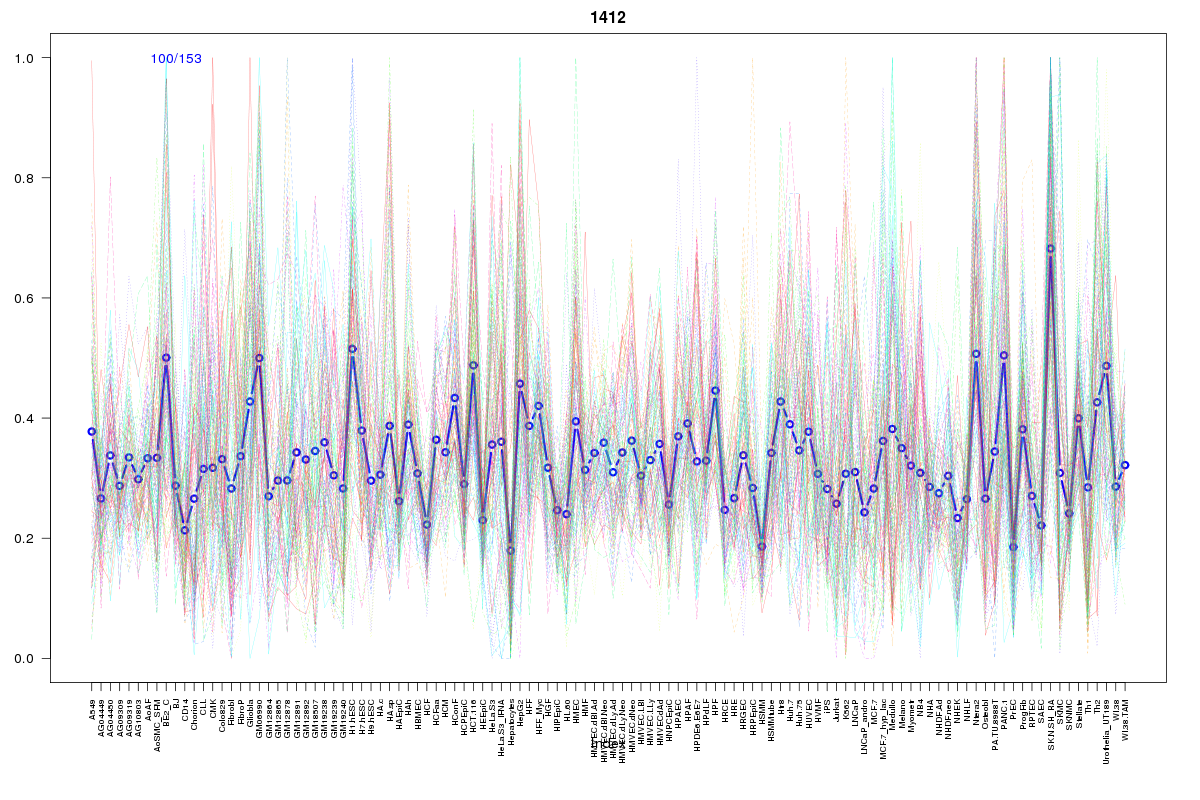 | 1412 | 1 |
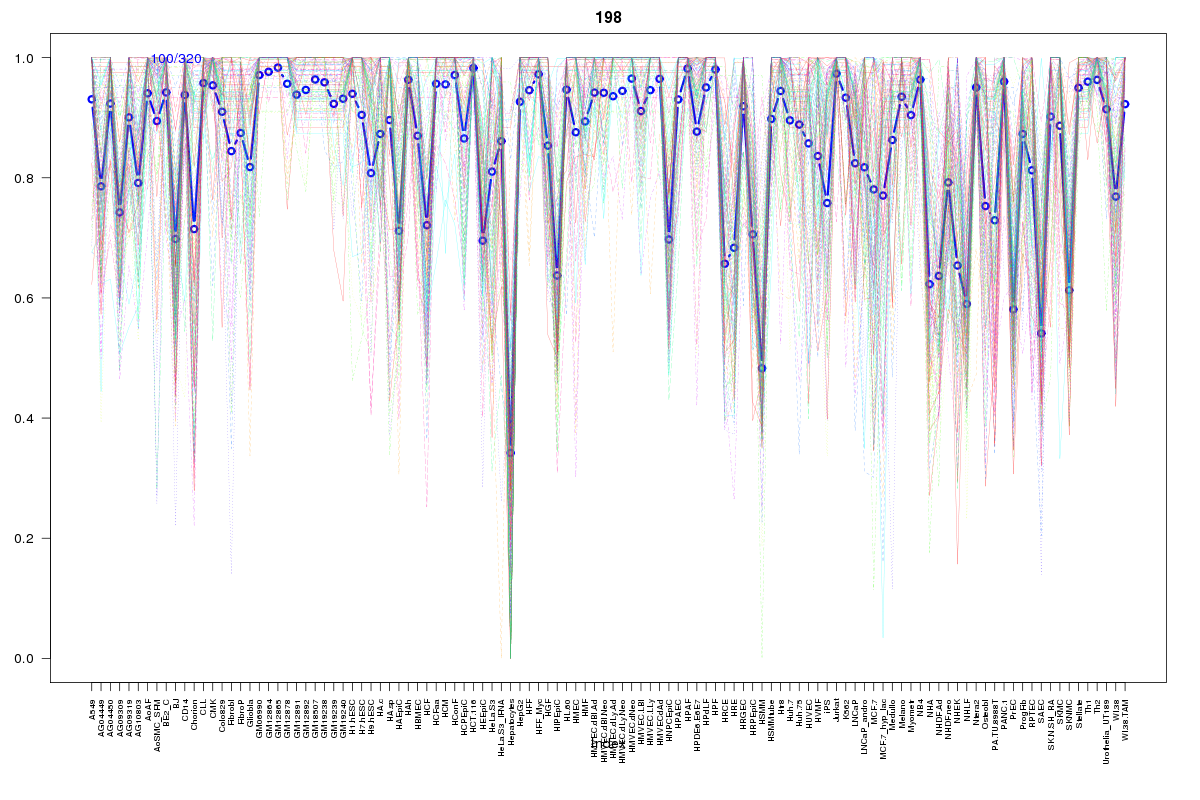 | 198 | 1 |
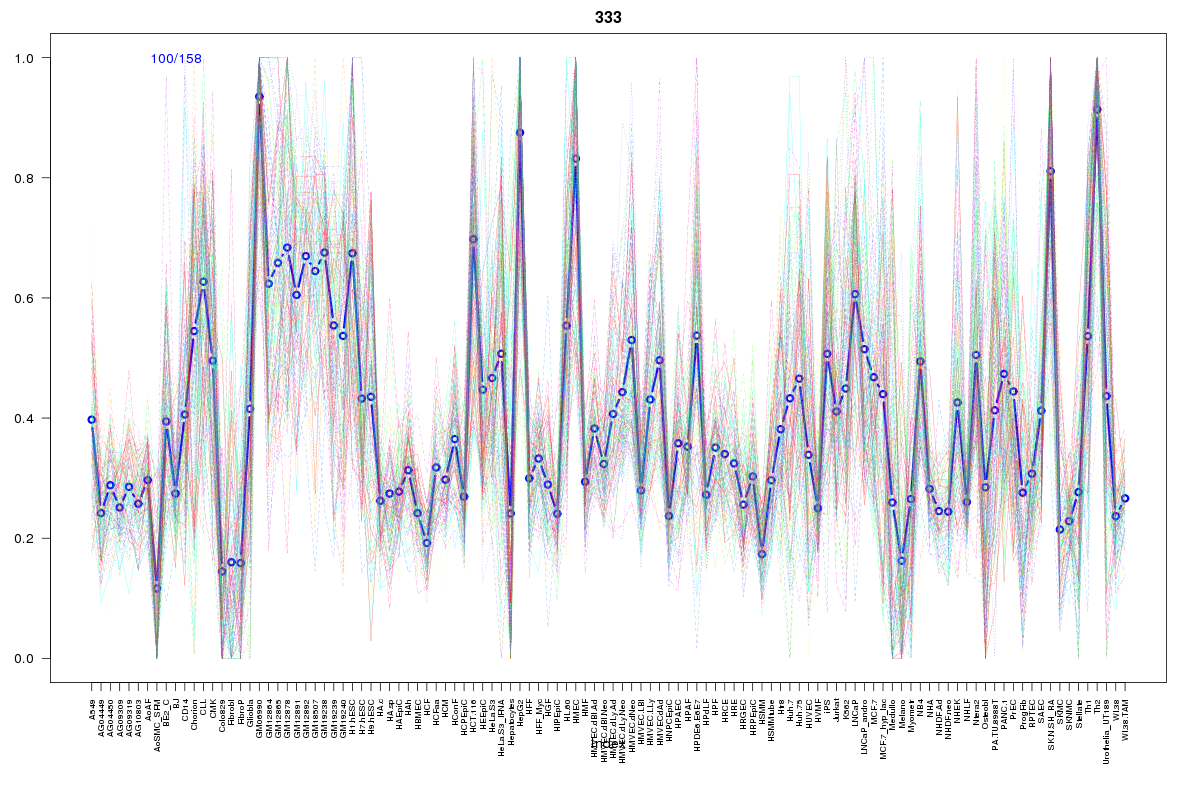 | 333 | 1 |
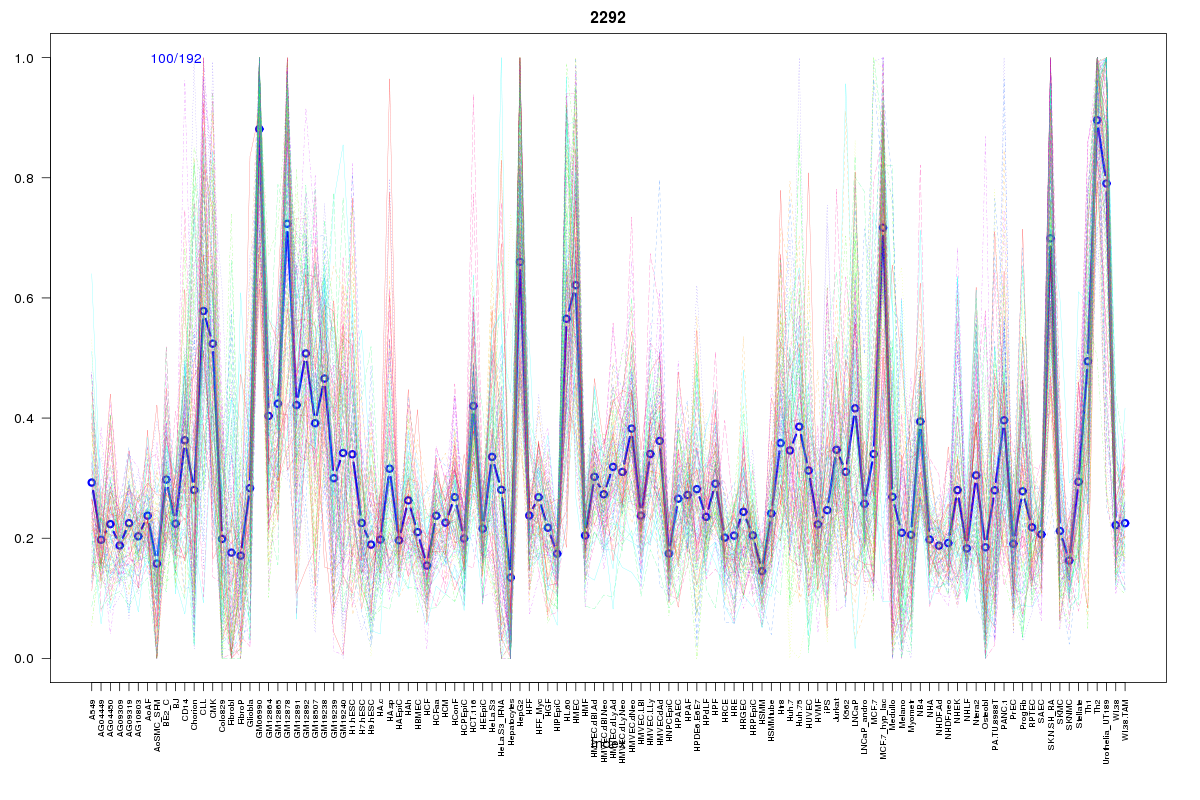 | 2292 | 1 |
 | 309 | 1 |
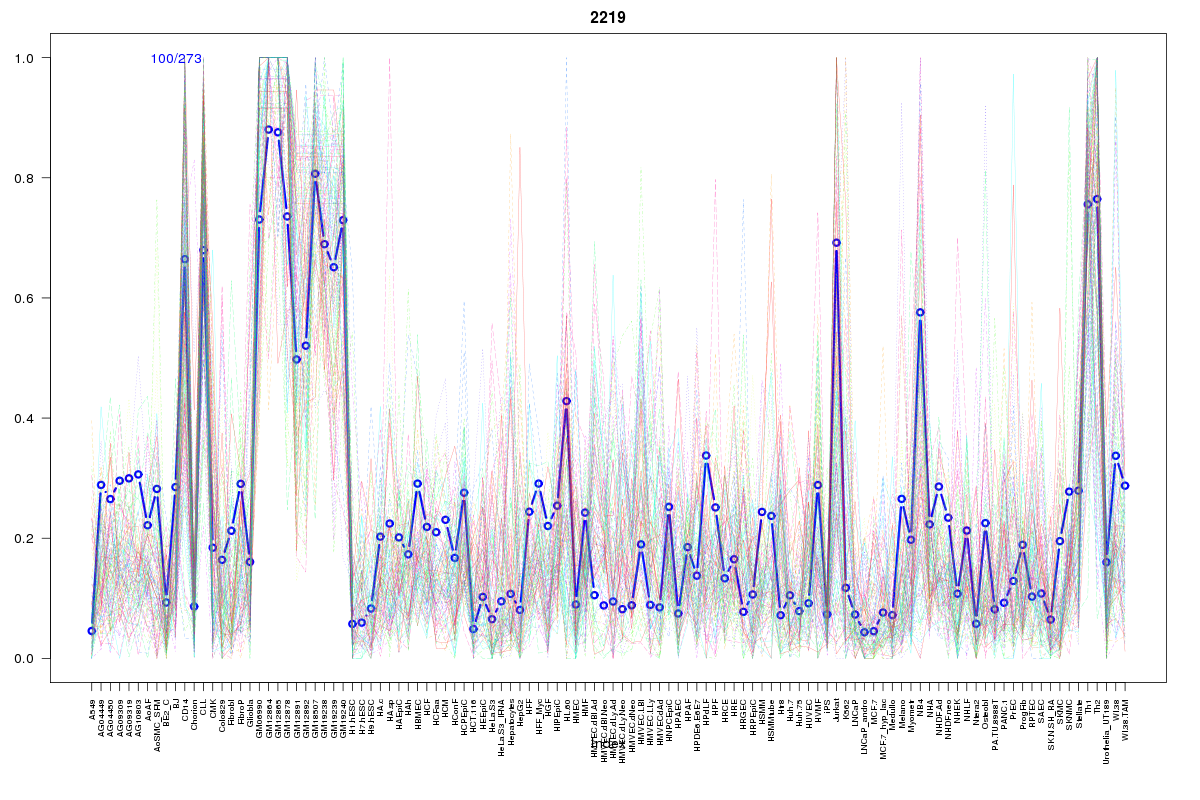 | 2219 | 1 |
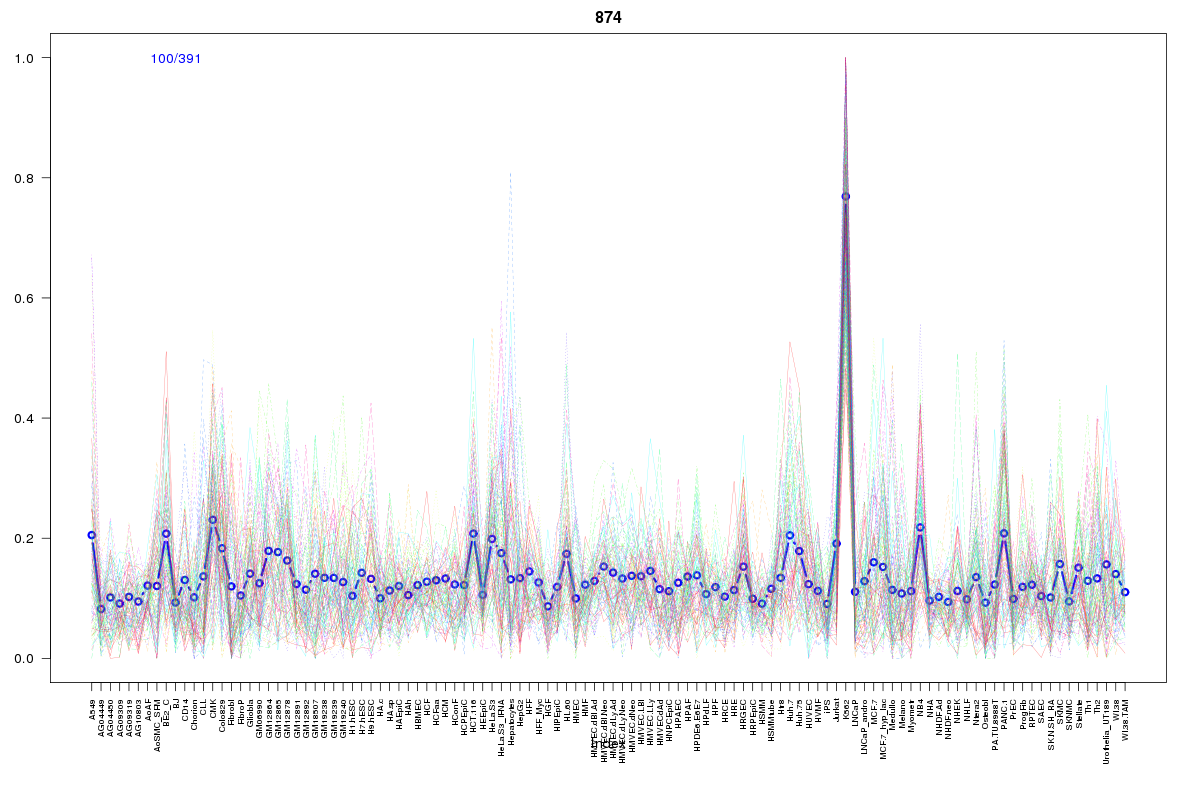 | 874 | 1 |
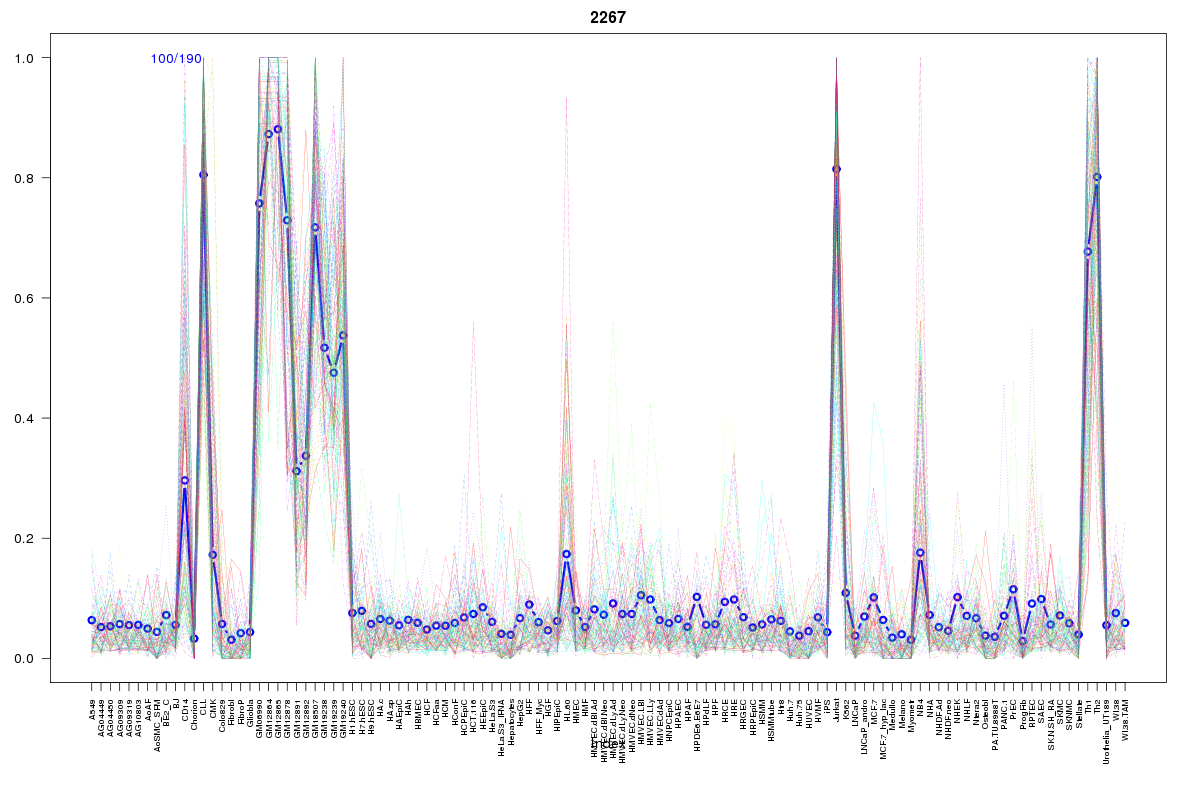 | 2267 | 1 |
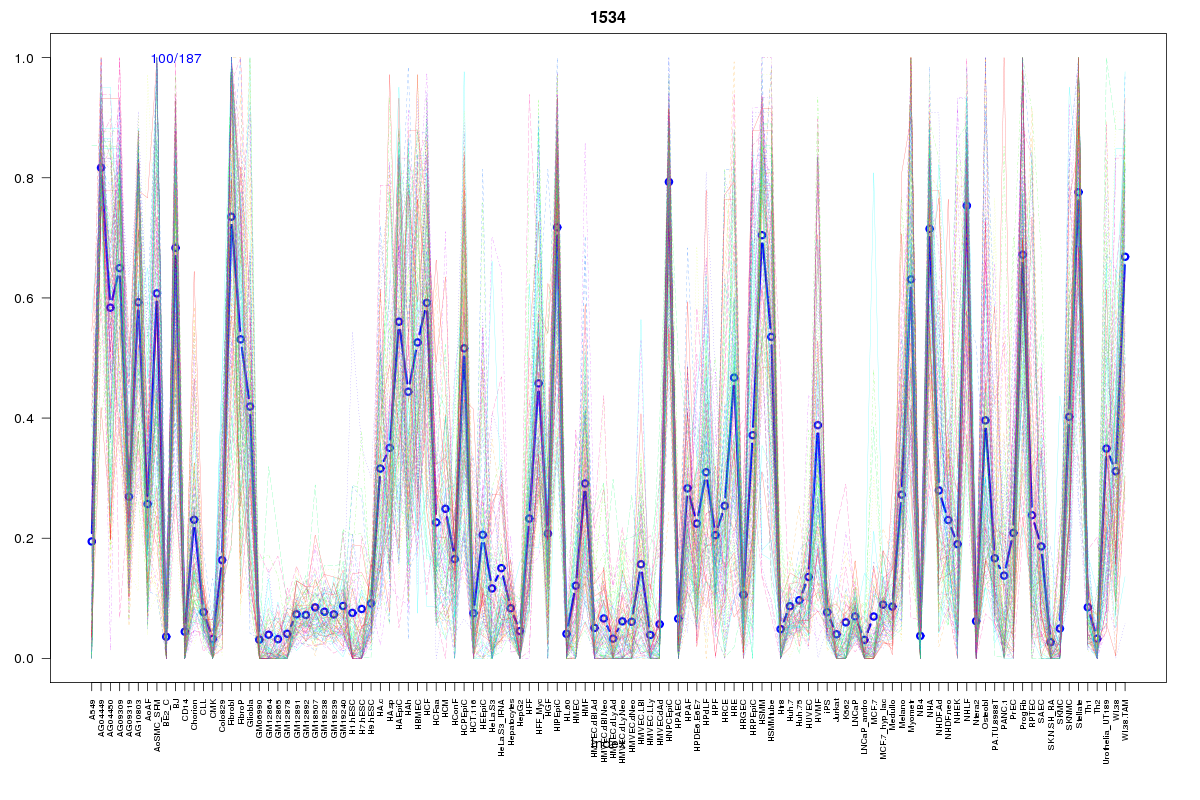 | 1534 | 1 |
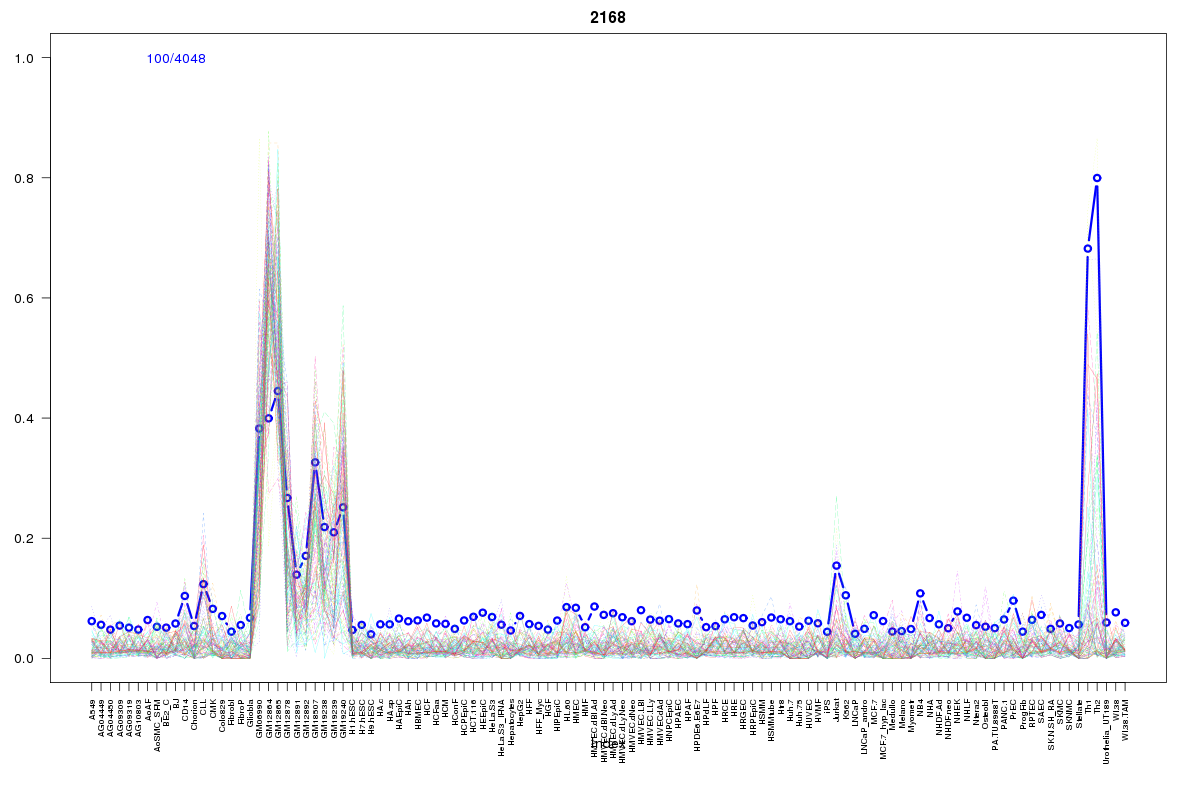 | 2168 | 1 |
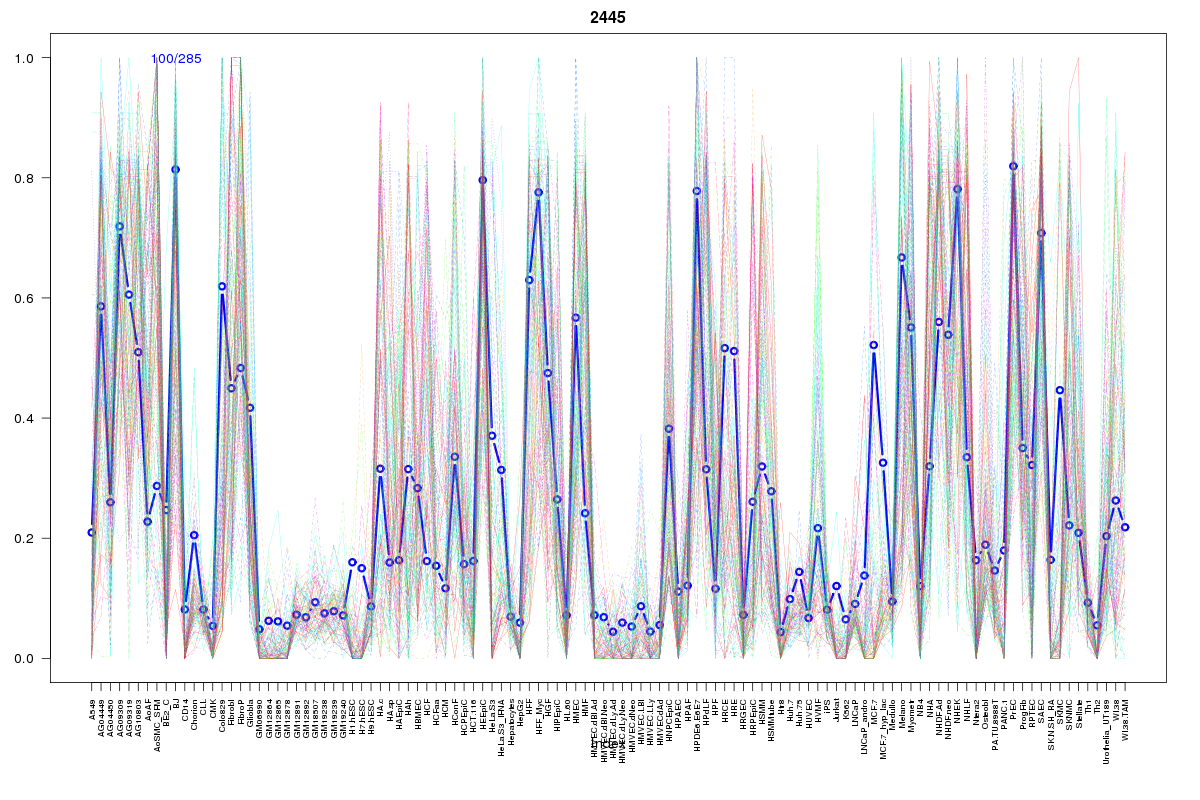 | 2445 | 1 |
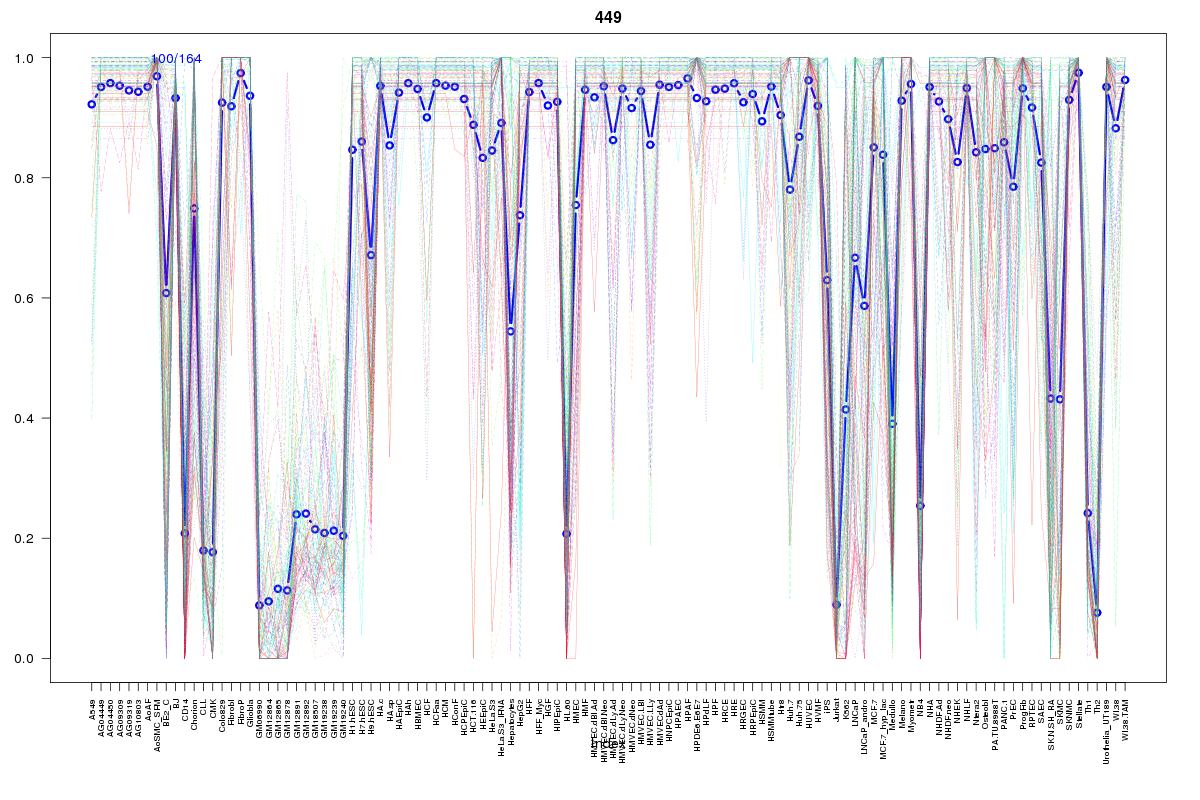 | 449 | 1 |
 | 416 | 1 |
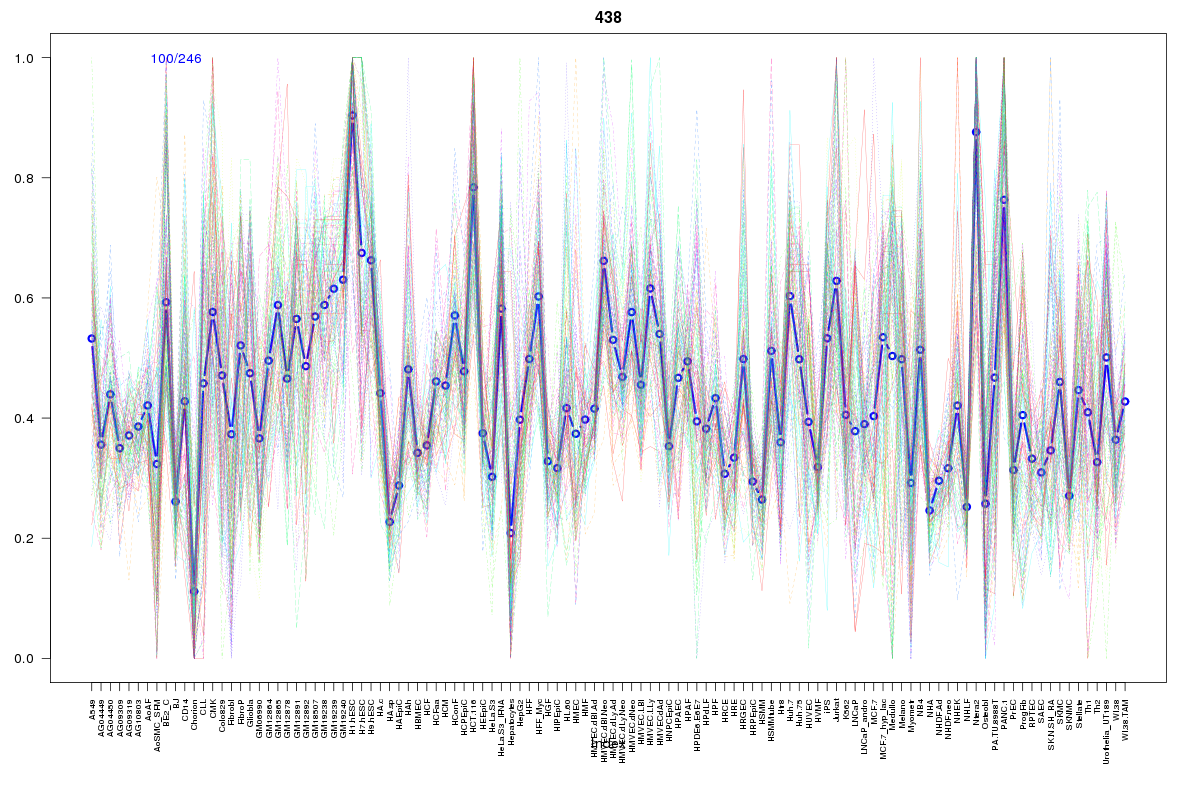 | 438 | 1 |
 | 2028 | 1 |
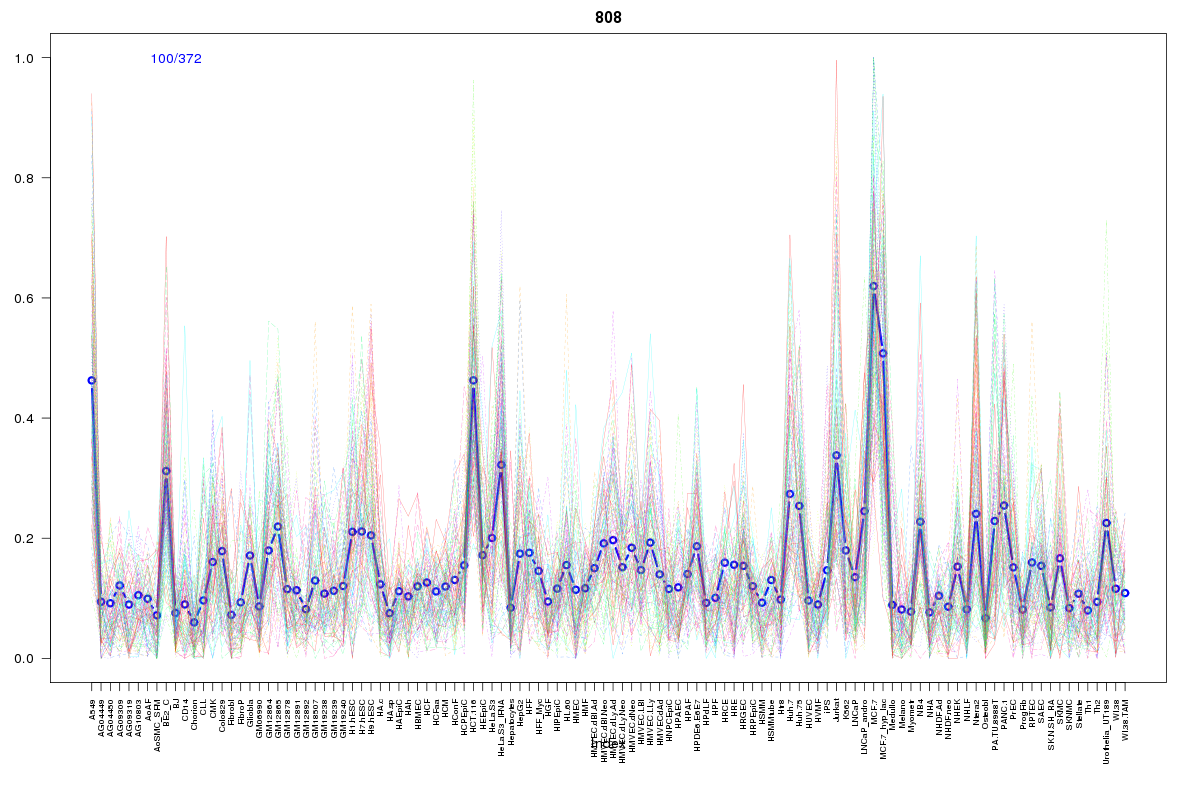 | 808 | 1 |
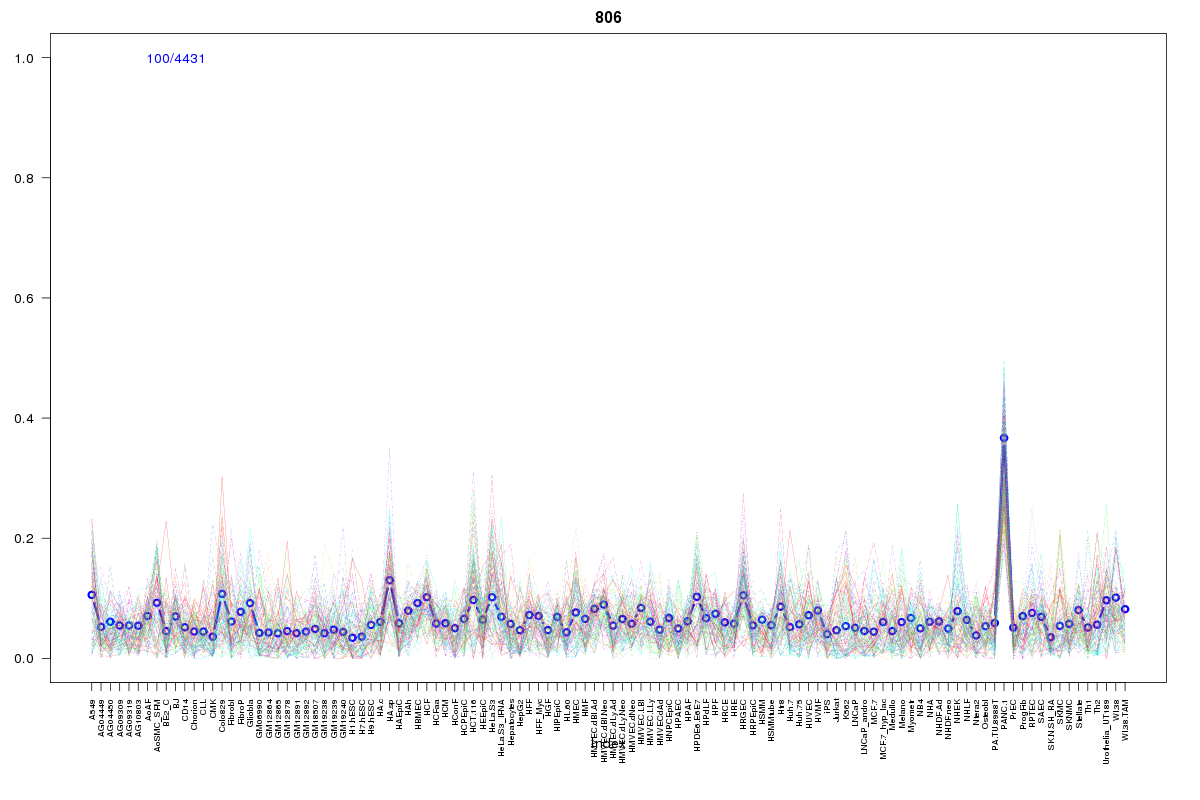 | 806 | 1 |
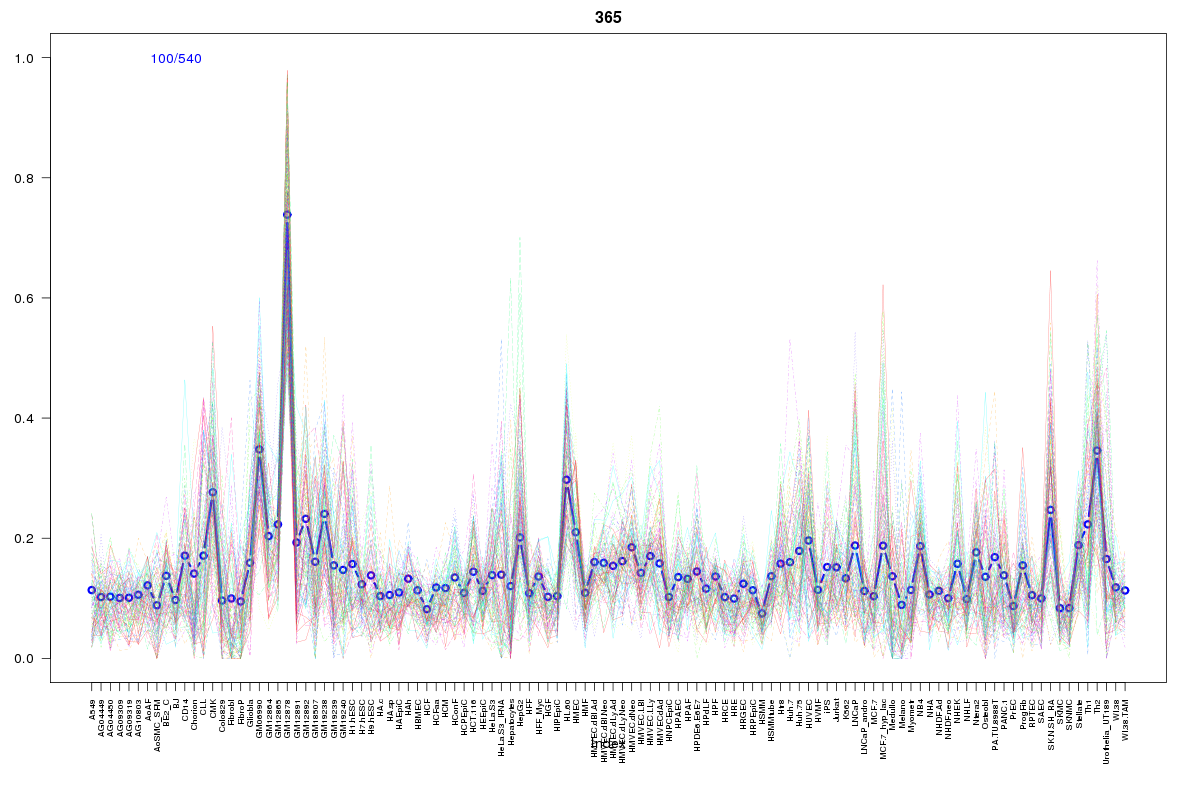 | 365 | 1 |
Resources
BED file downloads
Connects to 37 DHS sitesTop 10 Correlated DHS Sites
p-values indiciate significant higher or lower correlation| Location | Cluster | P-value |
|---|---|---|
| chr1:150505345-150505495 | 806 | 0 |
| chr1:150436940-150437090 | 392 | 0 |
| chr1:150402380-150402530 | 808 | 0.001 |
| chr1:150459485-150459635 | 533 | 0.002 |
| chr1:150485880-150486030 | 2243 | 0.002 |
| chr1:150532840-150532990 | 2062 | 0.003 |
| chr1:150532685-150532835 | 1306 | 0.003 |
| chr1:150533560-150533710 | 198 | 0.004 |
| chr1:150552505-150552655 | 1556 | 0.004 |
| chr1:150416700-150416850 | 2020 | 0.005 |
| chr1:150480145-150480295 | 827 | 0.009 |
External Databases
UCSCEnsembl (ENSG00000143374)