SOM cluster: 1195
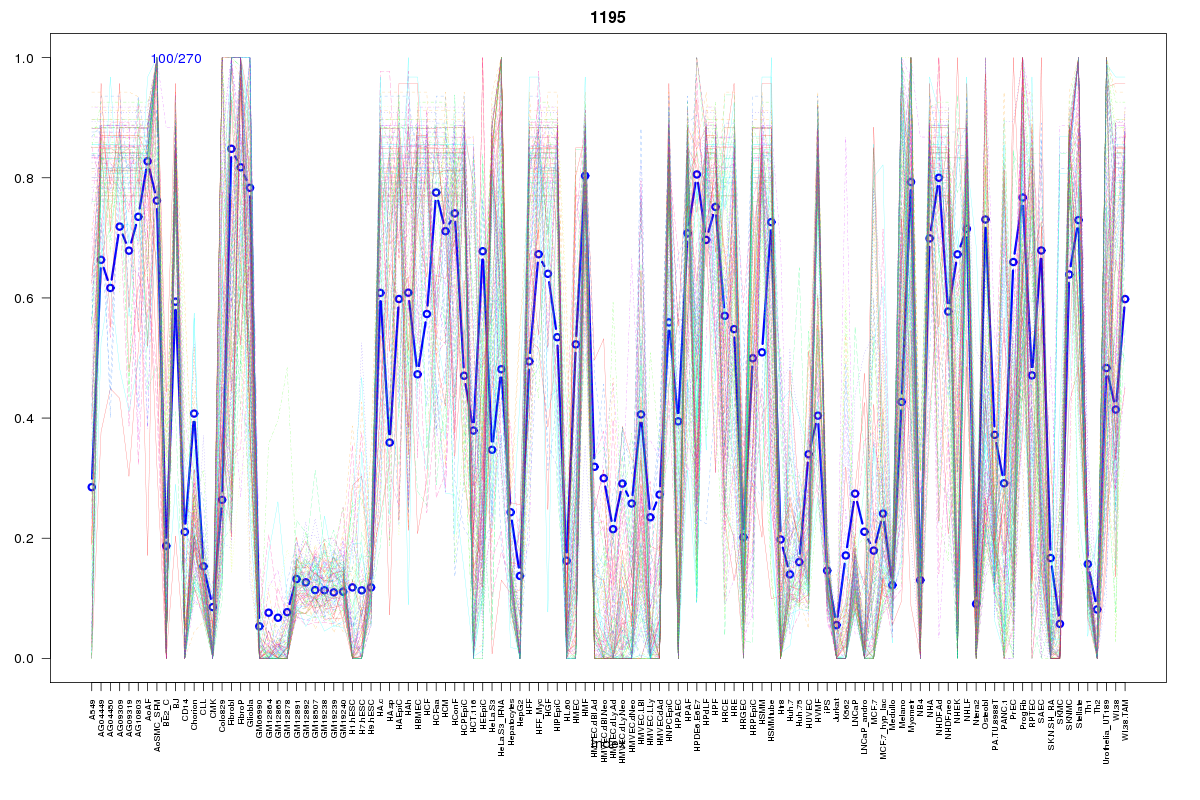
Cluster Hypersensitivity Profile

Genomic Location Trend
These plots show the distribution of the DHS sites surrounding the Transcript Start Site of the nearest gene.
Stats
Number of sites: 270Promoter: 3%
CpG-Island: 0%
Conserved: 54%
Enriched Motifs & Matches
Match Detail: [Jaspar]
|
| ||
|---|---|---|
| Sites: 45/100 | e-val: 7.7e-21 | ||
| Factor | e-val(match) | DB |
| AP1 | 0.000000000025675 | JASPAR |
| NFE2L2 | 0.0000000055424 | JASPAR |
| PPARG | 0.0036073 | JASPAR |
| NFE2L1::MafG | 0.0050681 | JASPAR |
| Foxa2 | 0.0090332 | JASPAR |
BED file downloads
Top 10 Example Regions
| Location | Gene Link | Dist. |
|---|---|---|
| chr1: 92035560-92035710 | CDC7 | 10.2 |
| chr17: 48501420-48501570 | RSAD1 | 52.43 |
| chr17: 48501420-48501570 | ACSF2 | 52.43 |
| chrX: 151139260-151139410 | GABRE | 54.1 |
| chr9: 132271900-132272050 | RP11-492E3.2 | 55.41 |
| chr9: 132271900-132272050 | LINC00963 | 55.41 |
| chr11: 1771300-1771450 | AP006285.1 | 56.55 |
| chr11: 1771300-1771450 | AC139143.2 | 56.55 |
| chr11: 1771300-1771450 | IFITM10 | 56.55 |
| chr11: 1771300-1771450 | RP11-295K3.1 | 56.55 |