SOM cluster: 2267
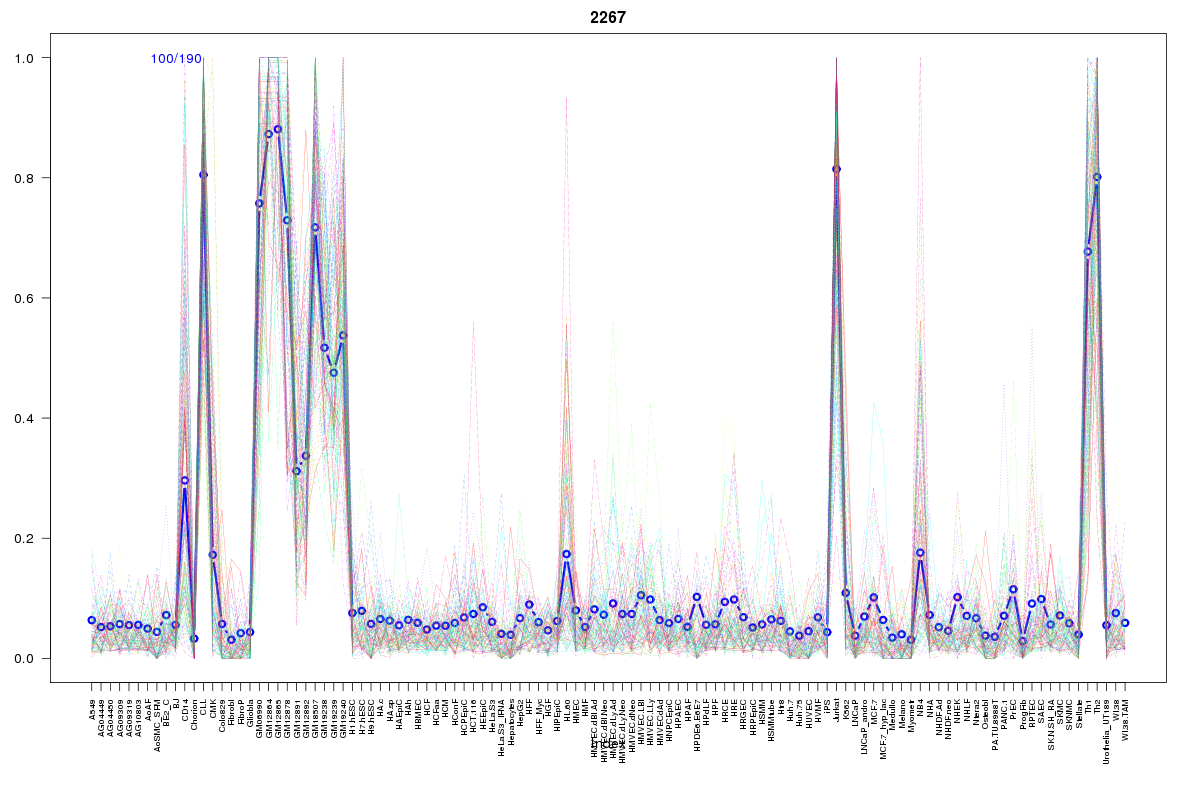
Cluster Hypersensitivity Profile

Genomic Location Trend
These plots show the distribution of the DHS sites surrounding the Transcript Start Site of the nearest gene.
Stats
Number of sites: 190Promoter: 8%
CpG-Island: 0%
Conserved: 37%
Enriched Motifs & Matches
Match Detail: [Jaspar]
|
| ||
|---|---|---|
| Sites: 49/100 | e-val: 0.000000000000001 | ||
| Factor | e-val(match) | DB |
| FEV | 0.0000000042539 | JASPAR |
| SPI1 | 0.000000012295 | JASPAR |
| ELK4 | 0.000000012446 | JASPAR |
| GABPA | 0.00000048121 | JASPAR |
| SPIB | 0.0000013765 | JASPAR |
|
| ||
| Sites: 19/100 | e-val: 0.0000038 | ||
| Factor | e-val(match) | DB |
| Foxd3 | 0.0011169 | JASPAR |
| SOX10 | 0.0025294 | JASPAR |
| IRF1 | 0.0074734 | JASPAR |
| EWSR1-FLI1 | 0.018297 | JASPAR |
| Pax4 | 0.019663 | JASPAR |
BED file downloads
Top 10 Example Regions
| Location | Gene Link | Dist. |
|---|---|---|
| chr8: 124168840-124168990 | FAM83A | 29.66 |
| chr8: 124168840-124168990 | TBC1D31 | 29.66 |
| chr8: 124168840-124168990 | FAM83A-AS1 | 29.66 |
| chr8: 42623800-42623950 | THAP1 | 34.75 |
| chr8: 42623800-42623950 | CHRNA6 | 34.75 |
| chr22: 36831840-36831990 | RP5-1119A7.14 | 46.41 |
| chr22: 36831840-36831990 | EIF3D | 46.41 |
| chr19: 50004260-50004410 | SLC17A7 | 50.1 |
| chr19: 50004260-50004410 | RCN3 | 50.1 |
| chr19: 50004260-50004410 | PTH2 | 50.1 |