SOM cluster: 392
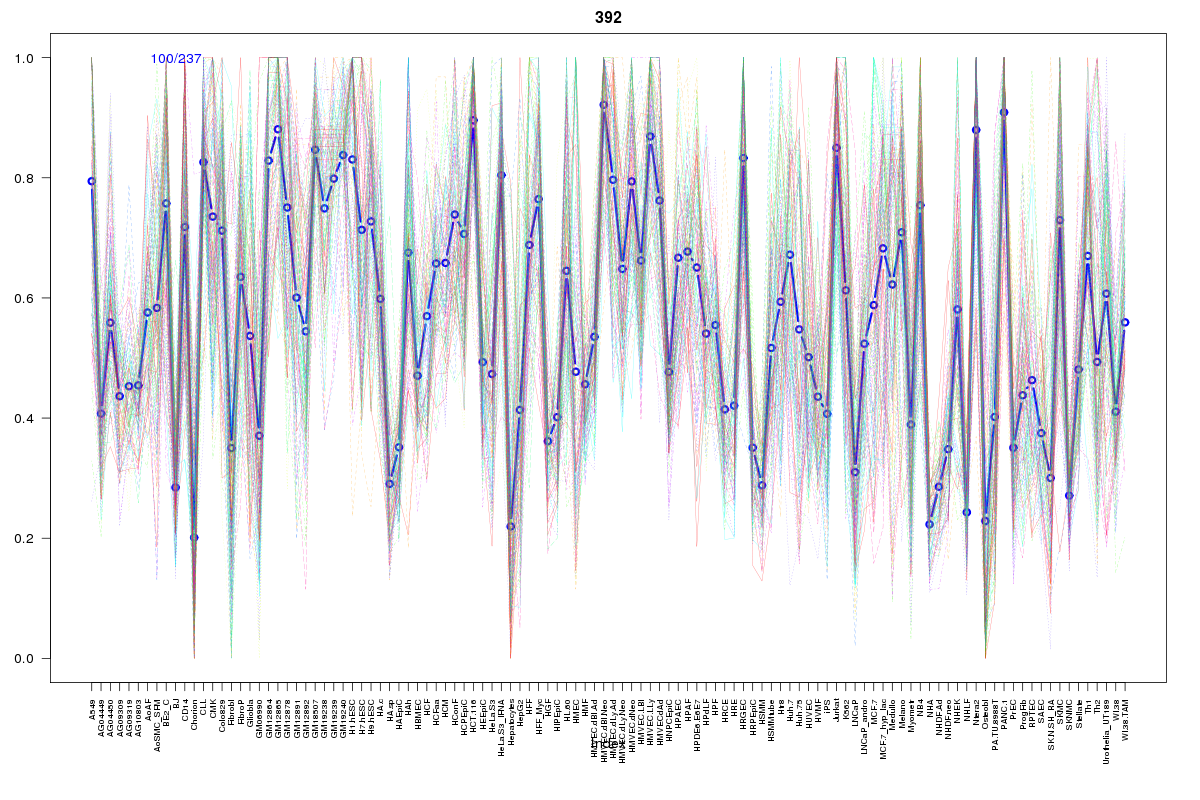
Cluster Hypersensitivity Profile

Genomic Location Trend
These plots show the distribution of the DHS sites surrounding the Transcript Start Site of the nearest gene.
Stats
Number of sites: 237Promoter: 1%
CpG-Island: 0%
Conserved: 69%
Enriched Motifs & Matches
Match Detail: [Jaspar]
|
| ||
|---|---|---|
| Sites: 89/100 | e-val: 0 | ||
| Factor | e-val(match) | DB |
| CTCF | 0 | JASPAR |
| INSM1 | 0.00001343 | JASPAR |
| PLAG1 | 0.00044861 | JASPAR |
| Zfp423 | 0.0024126 | JASPAR |
| SP1 | 0.0066216 | JASPAR |
BED file downloads
Top 10 Example Regions
| Location | Gene Link | Dist. |
|---|---|---|
| chr8: 97192460-97192610 | UQCRB | 42.36 |
| chr2: 30937040-30937190 | CAPN13 | 49.4 |
| chr1: 65541160-65541310 | RP4-700A9.1 | 59.59 |
| chr5: 126011920-126012070 | RP11-395C3.1 | 61.58 |
| chr1: 214434960-214435110 | SMYD2 | 63.03 |
| chr3: 32989320-32989470 | SEC13P1 | 65.09 |
| chr9: 36555920-36556070 | MELK | 65.47 |
| chr9: 36103080-36103230 | RECK | 65.68 |
| chr9: 36103080-36103230 | OR2S1P | 65.68 |
| chr3: 141160320-141160470 | RASA2 | 66.19 |