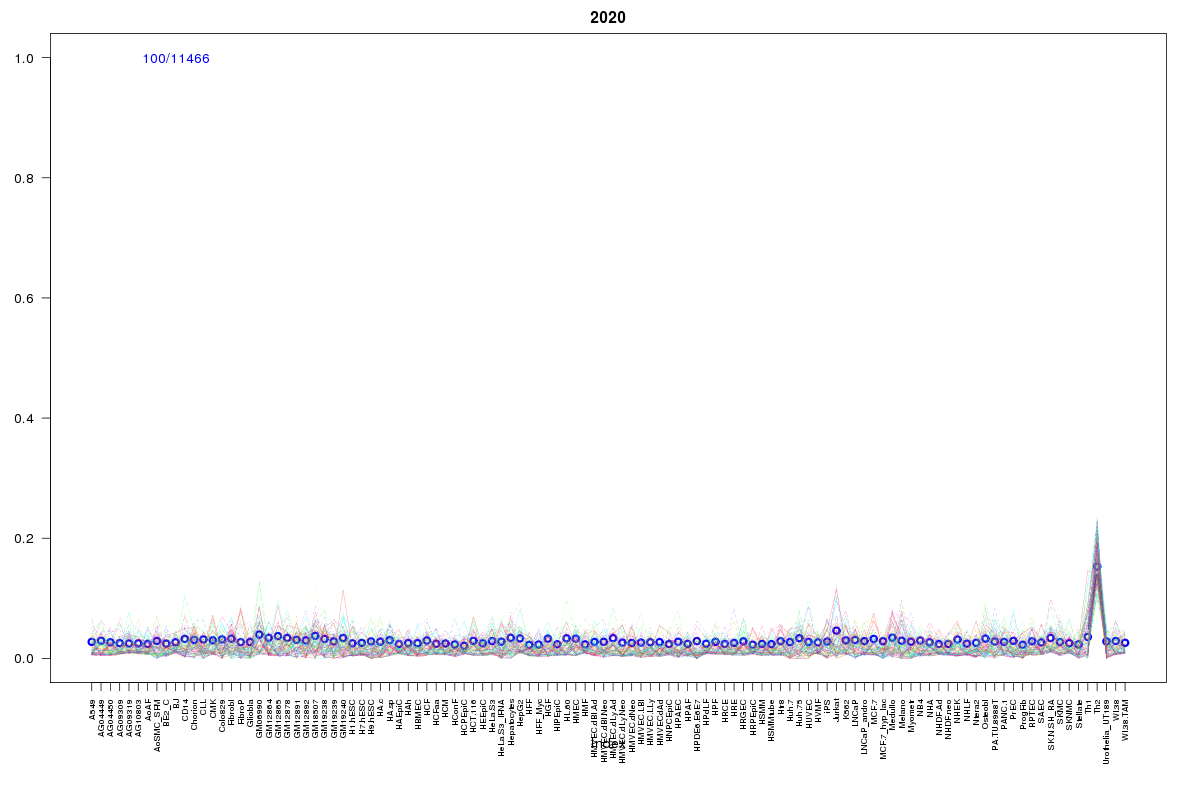
SOM cluster: 2020
Cluster Hypersensitivity Profile

Genomic Location Trend
These plots show the distribution of the DHS sites surrounding the Transcript Start Site of the nearest gene.
Stats
Number of sites: 11466Promoter: 1%
CpG-Island: 0%
Conserved: 16%
Enriched Motifs & Matches
Match Detail: [Jaspar]
|
| ||
|---|---|---|
| Sites: 36/100 | e-val: 0.00000000000042 | ||
| Factor | e-val(match) | DB |
| Foxd3 | 0.000054928 | JASPAR |
| MEF2A | 0.0004907 | JASPAR |
| Foxq1 | 0.0034393 | JASPAR |
| Lhx3 | 0.01762 | JASPAR |
| Pax4 | 0.02287 | JASPAR |
|
| ||
| Sites: 14/100 | e-val: 1.8 | ||
| Factor | e-val(match) | DB |
| FOXD1 | 0.00018447 | JASPAR |
| FOXO3 | 0.00021908 | JASPAR |
| Foxa2 | 0.0012596 | JASPAR |
| FOXA1 | 0.0017619 | JASPAR |
| Foxd3 | 0.0020403 | JASPAR |