Gene: TP53I11
chr11: 44907453-44972840Expression Profile
(log scale)
Graphical Connections
Distribution of linked clusters:
You may find it interesting if many of the connected DHS sites belong to the same cluster.| Cluster Profile | Cluster ID | Number of DHS sites in this cluster |
|---|---|---|
 | 935 | 2 |
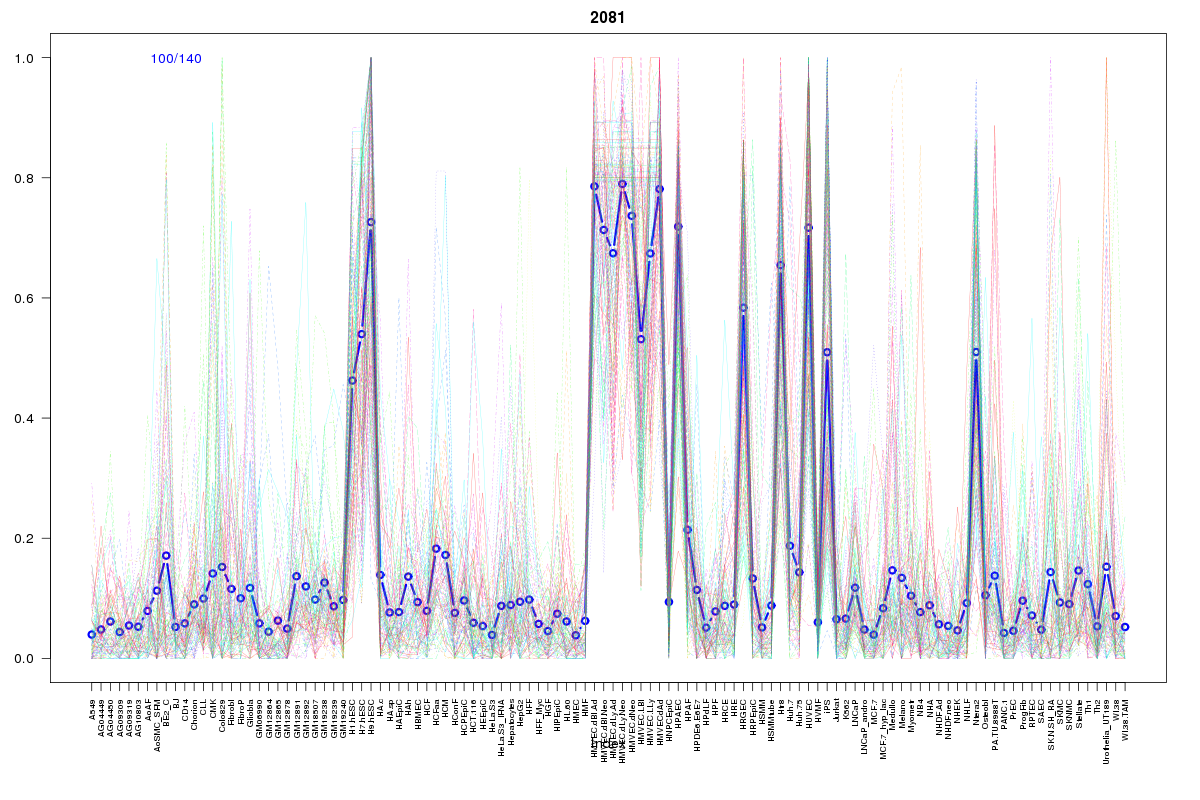 | 2081 | 2 |
 | 979 | 2 |
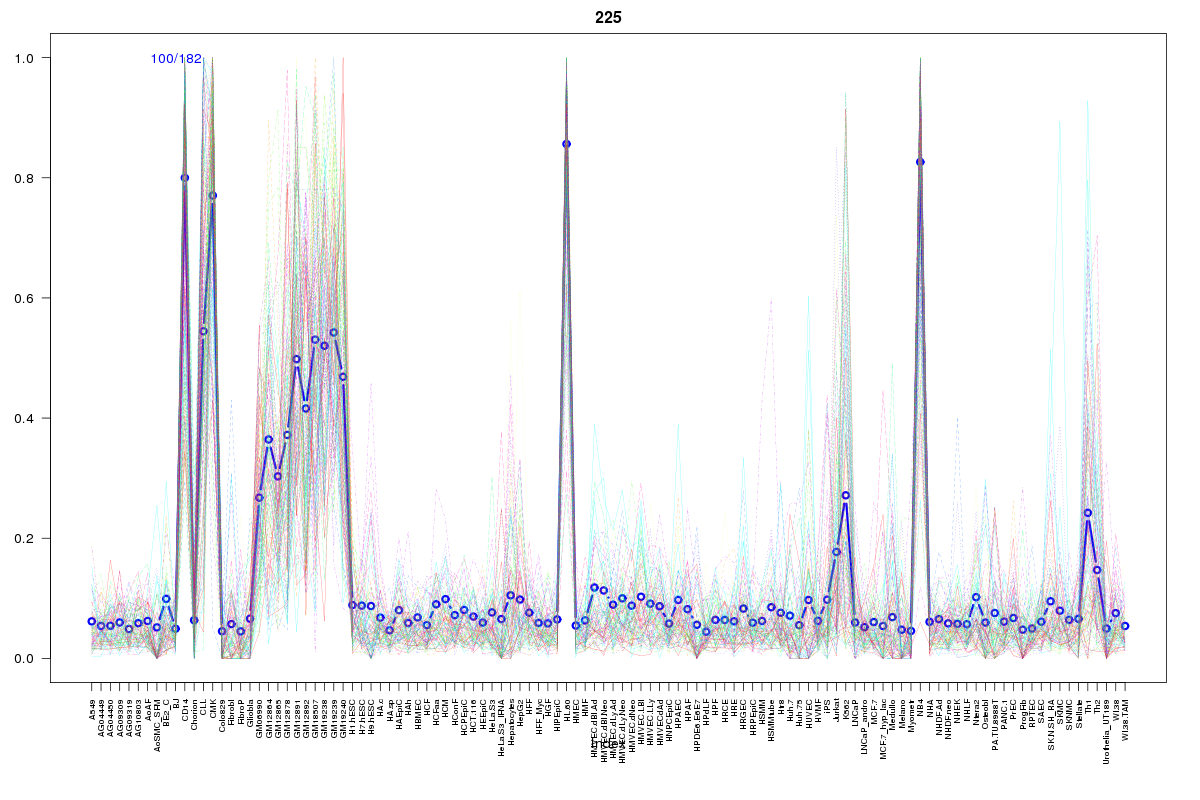 | 225 | 1 |
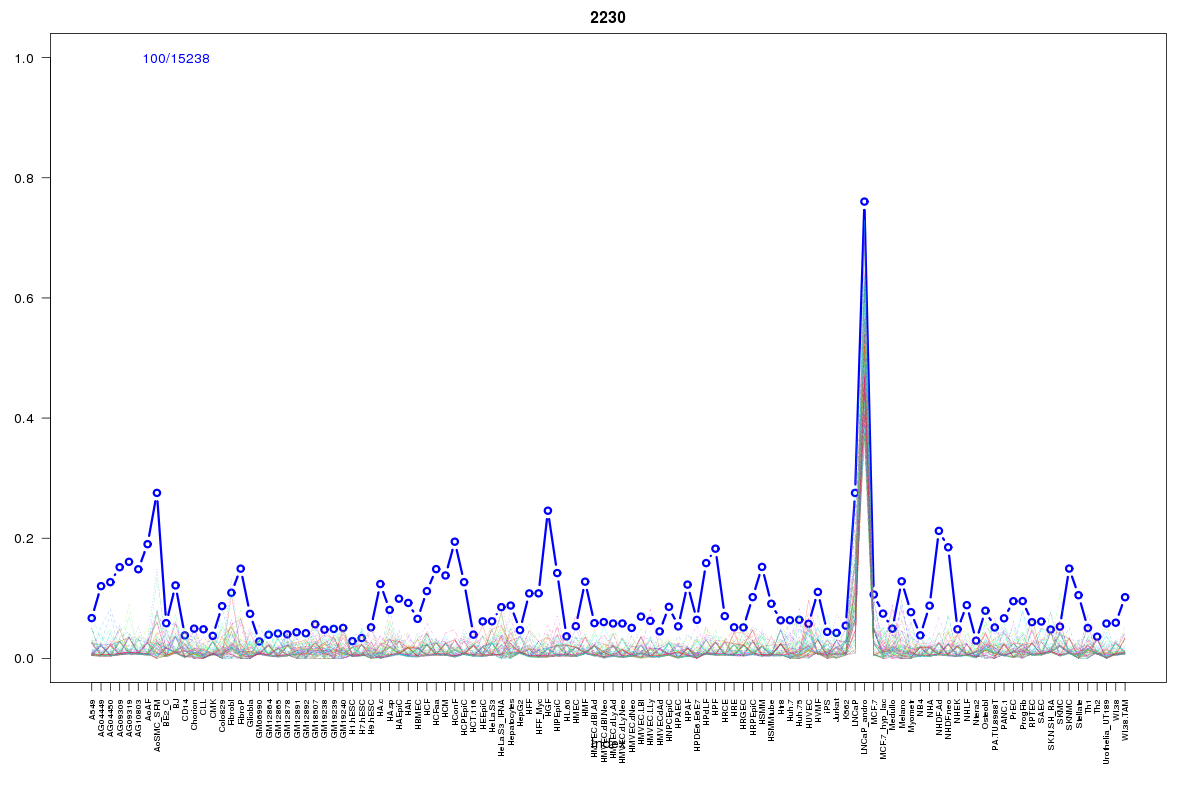 | 2230 | 1 |
 | 934 | 1 |
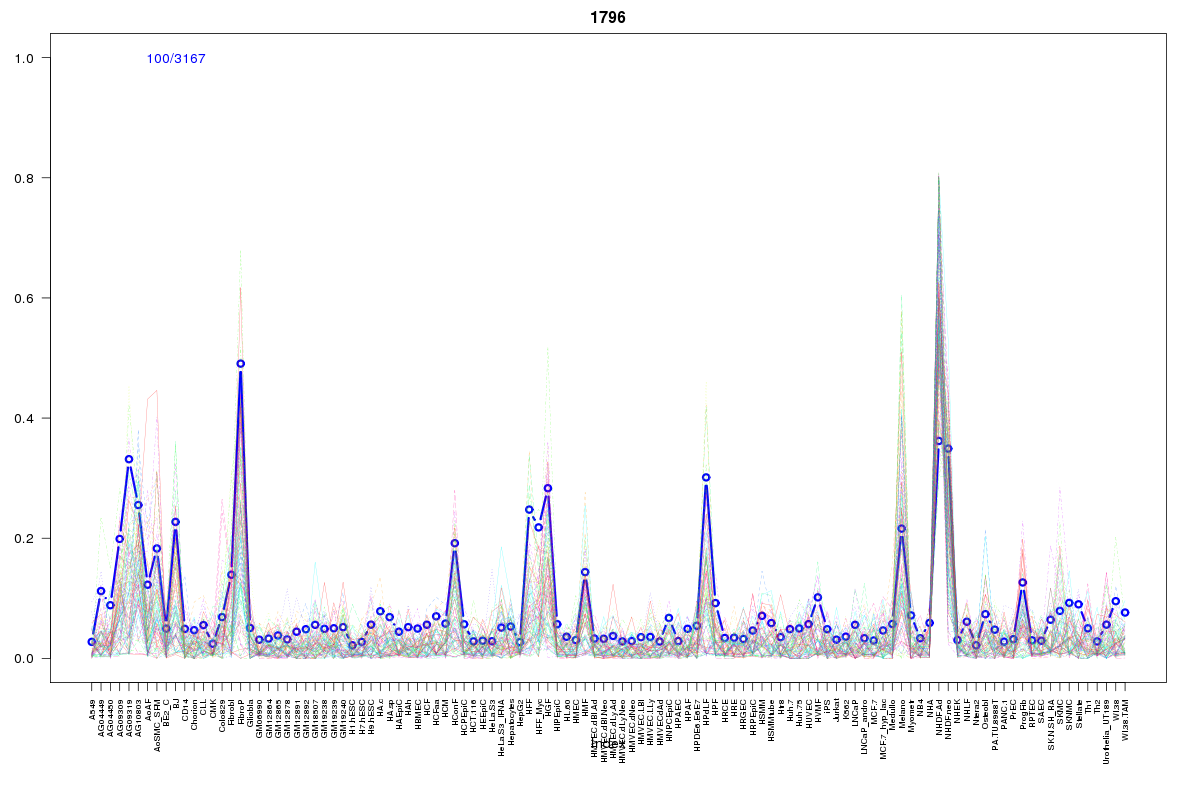 | 1796 | 1 |
 | 1493 | 1 |
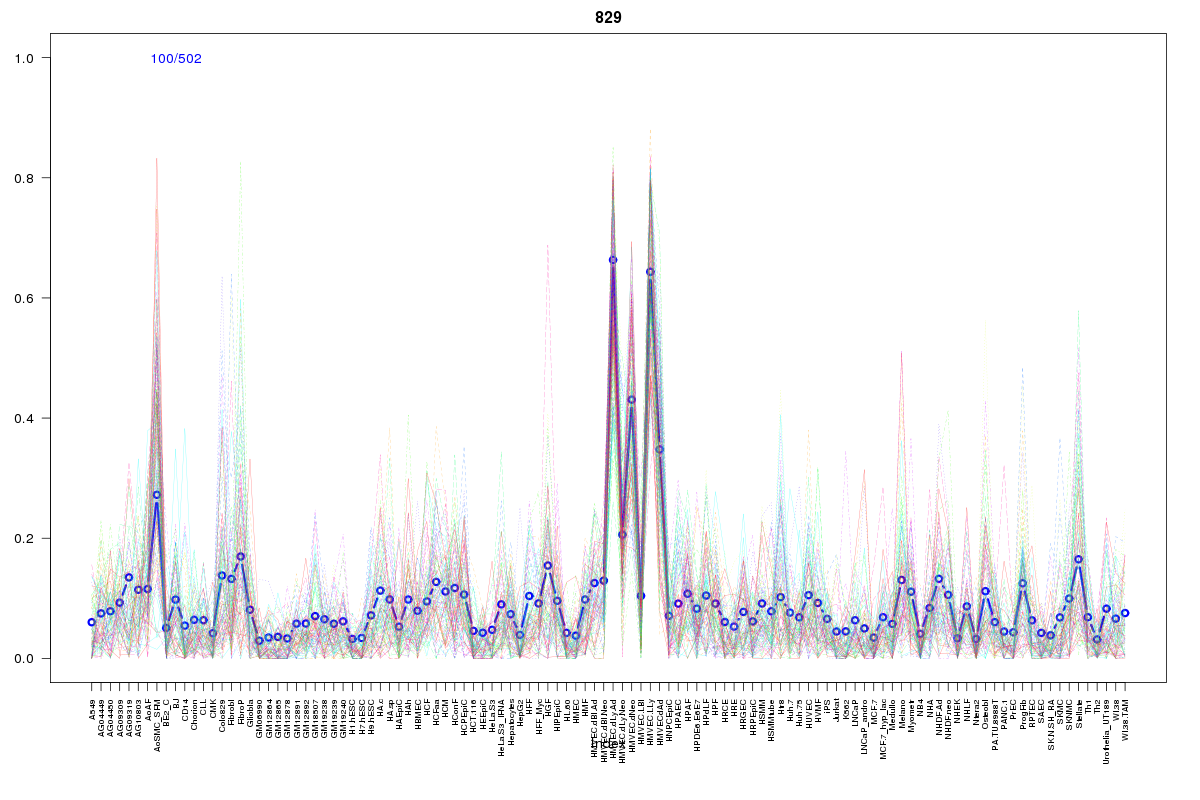 | 829 | 1 |
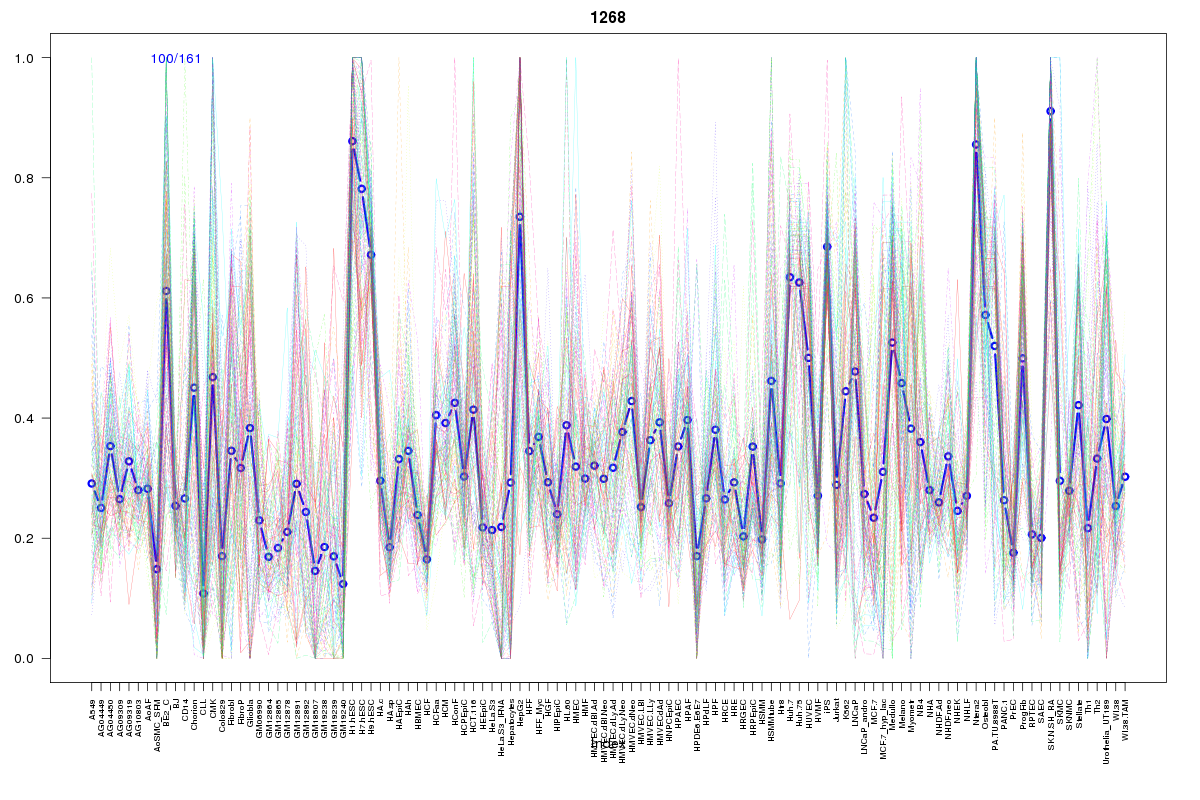 | 1268 | 1 |
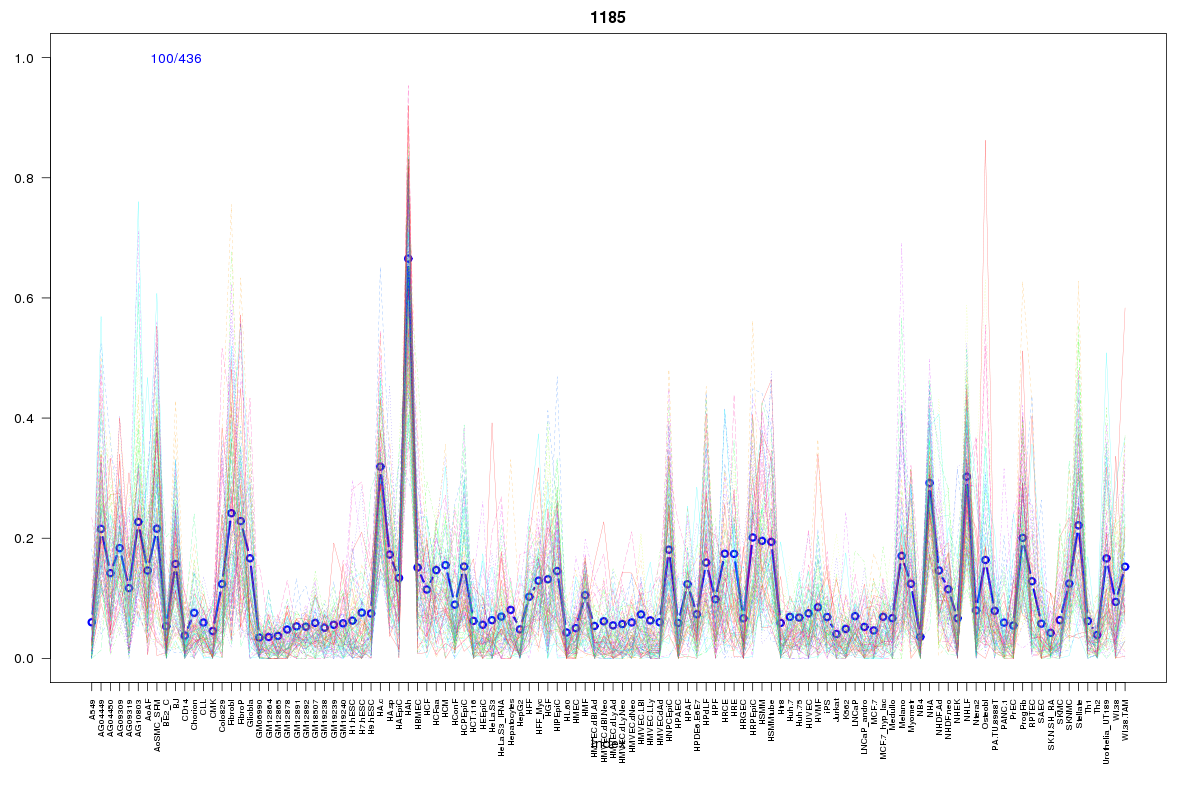 | 1185 | 1 |
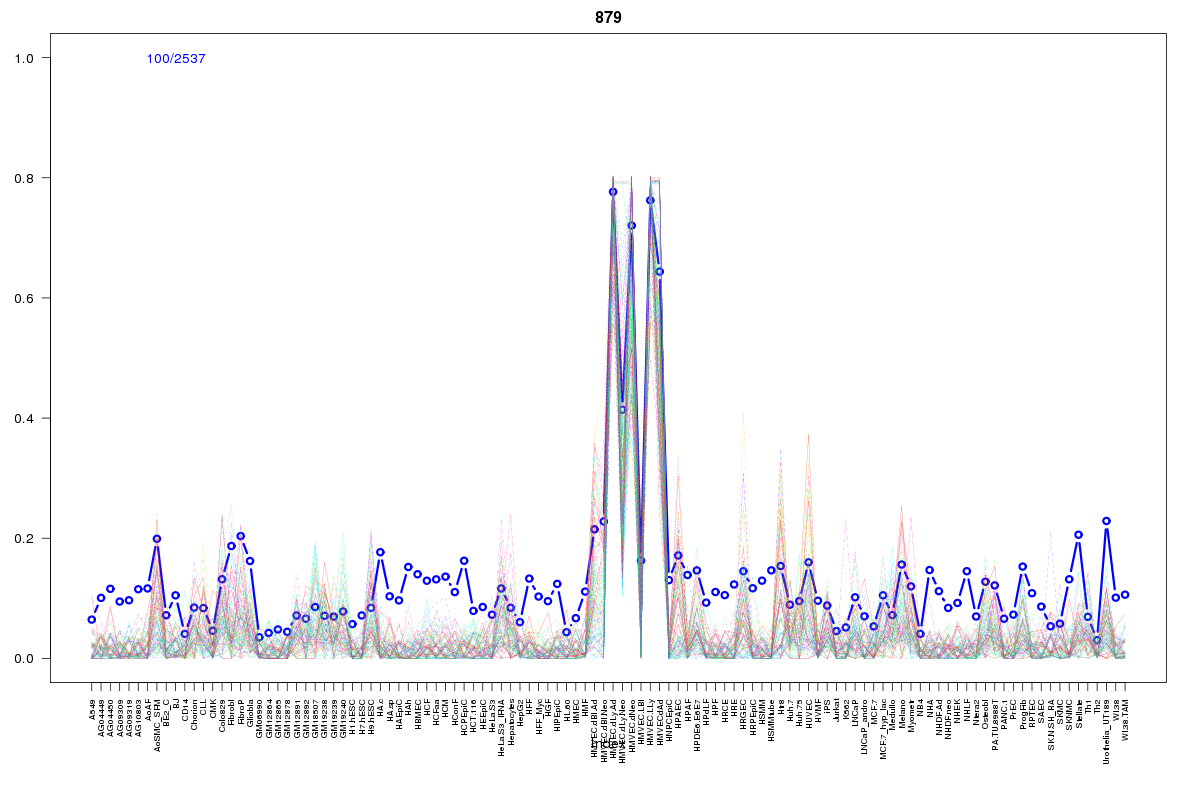 | 879 | 1 |
 | 952 | 1 |
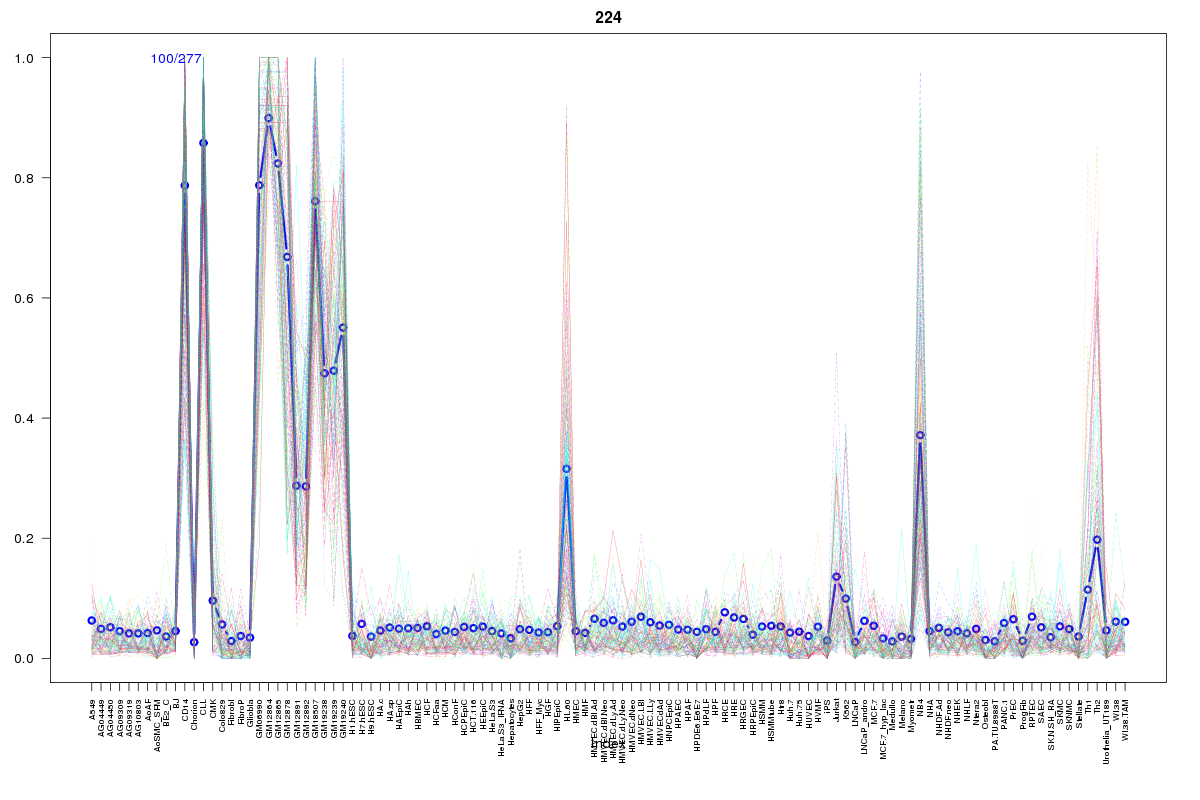 | 224 | 1 |
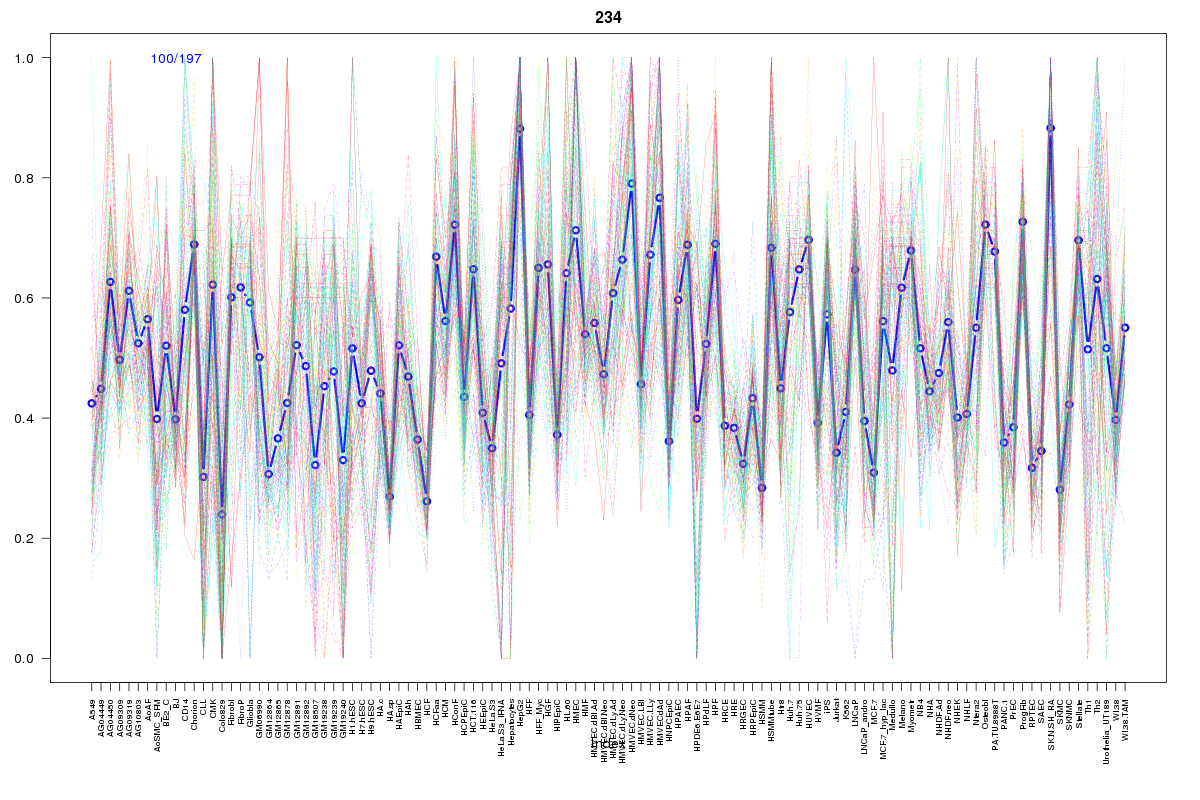 | 234 | 1 |
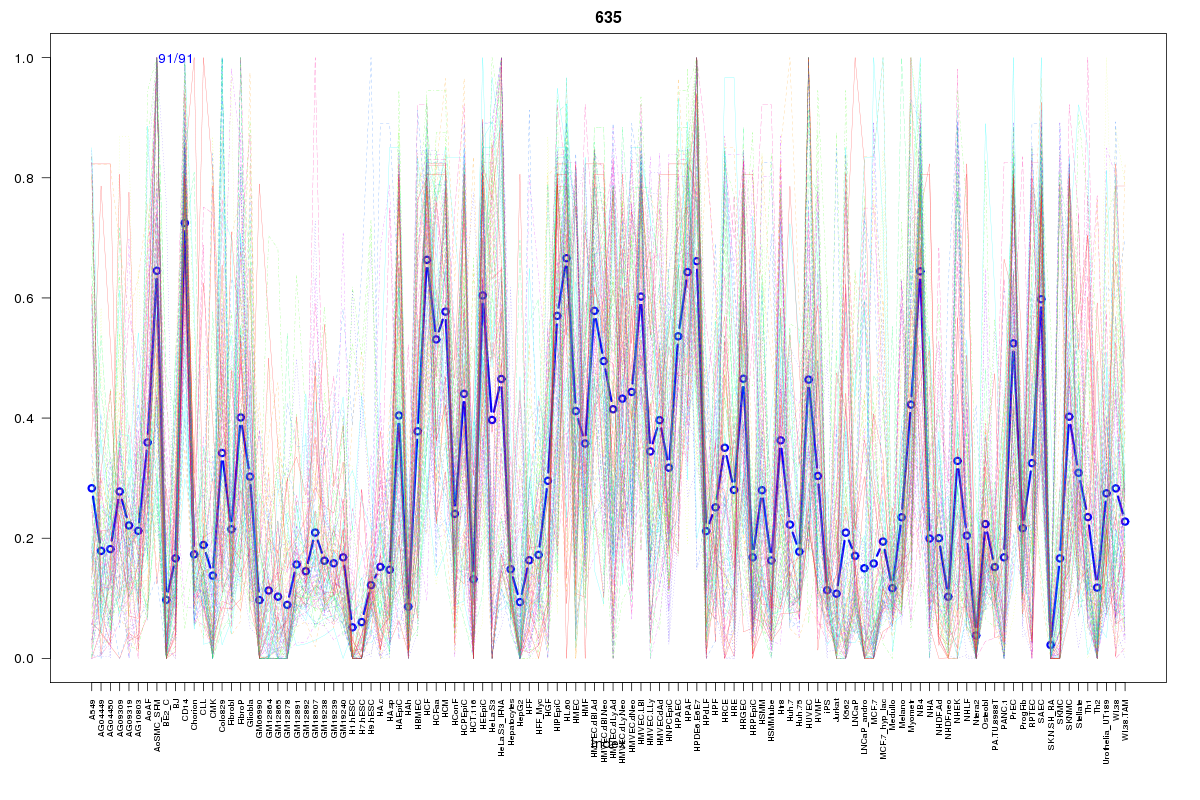 | 635 | 1 |
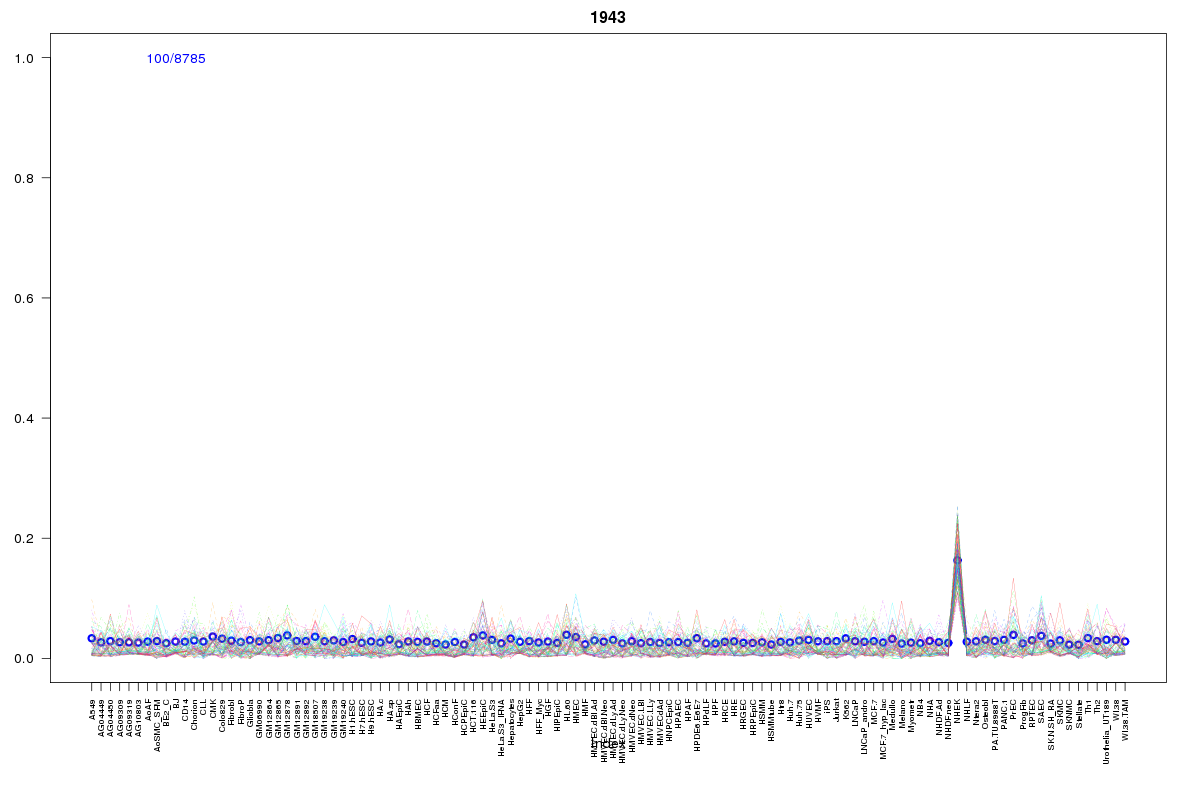 | 1943 | 1 |
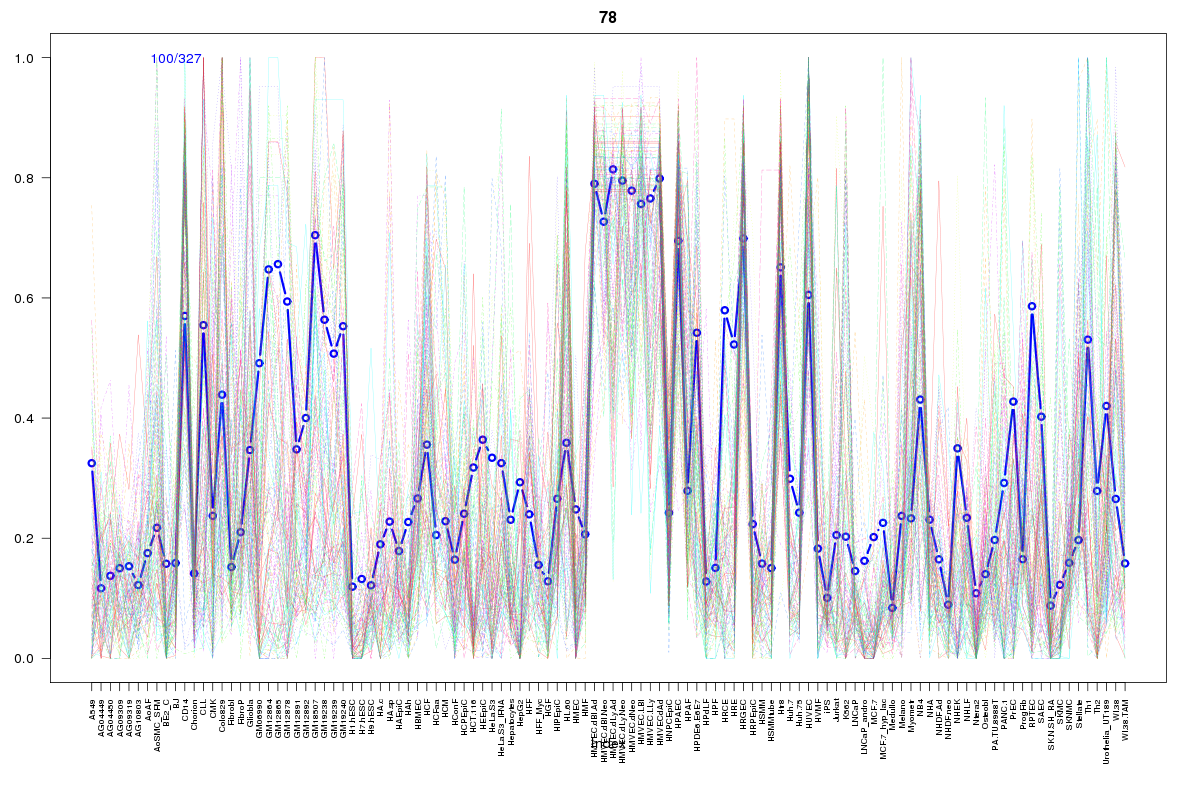 | 78 | 1 |
 | 882 | 1 |
 | 2211 | 1 |
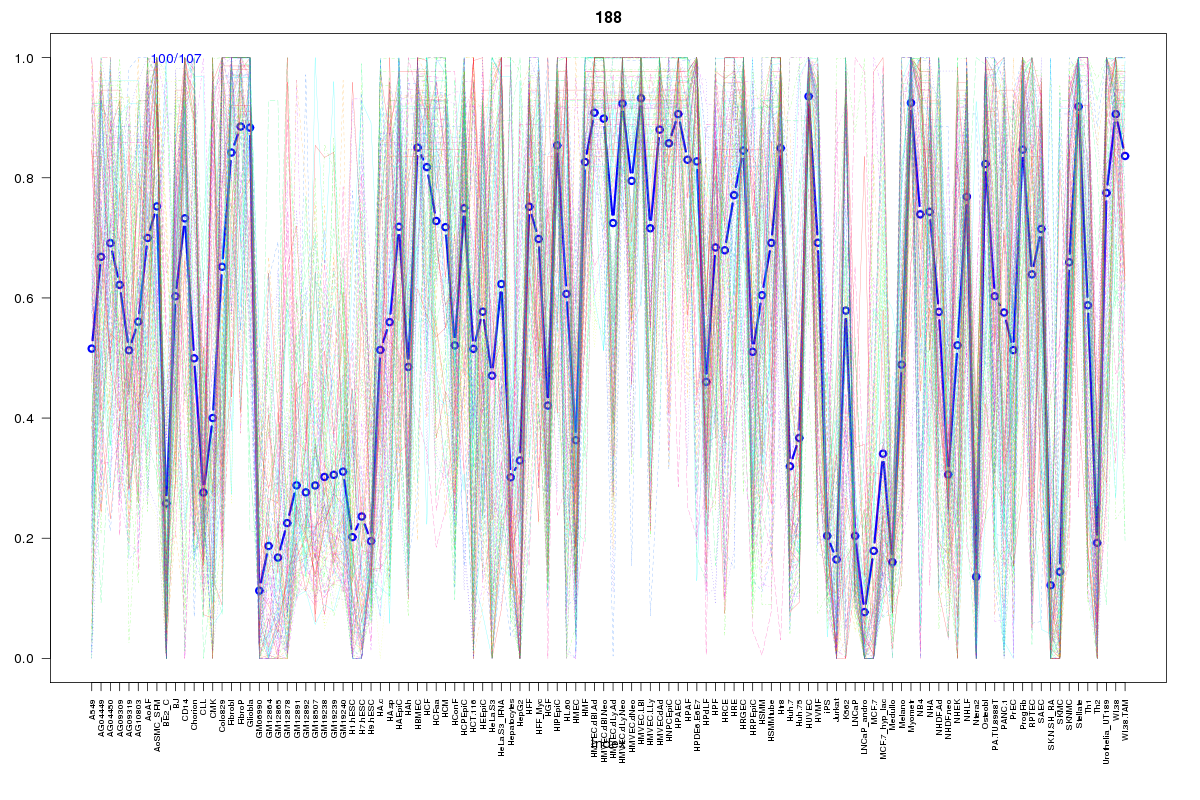 | 188 | 1 |
 | 2181 | 1 |
 | 1605 | 1 |
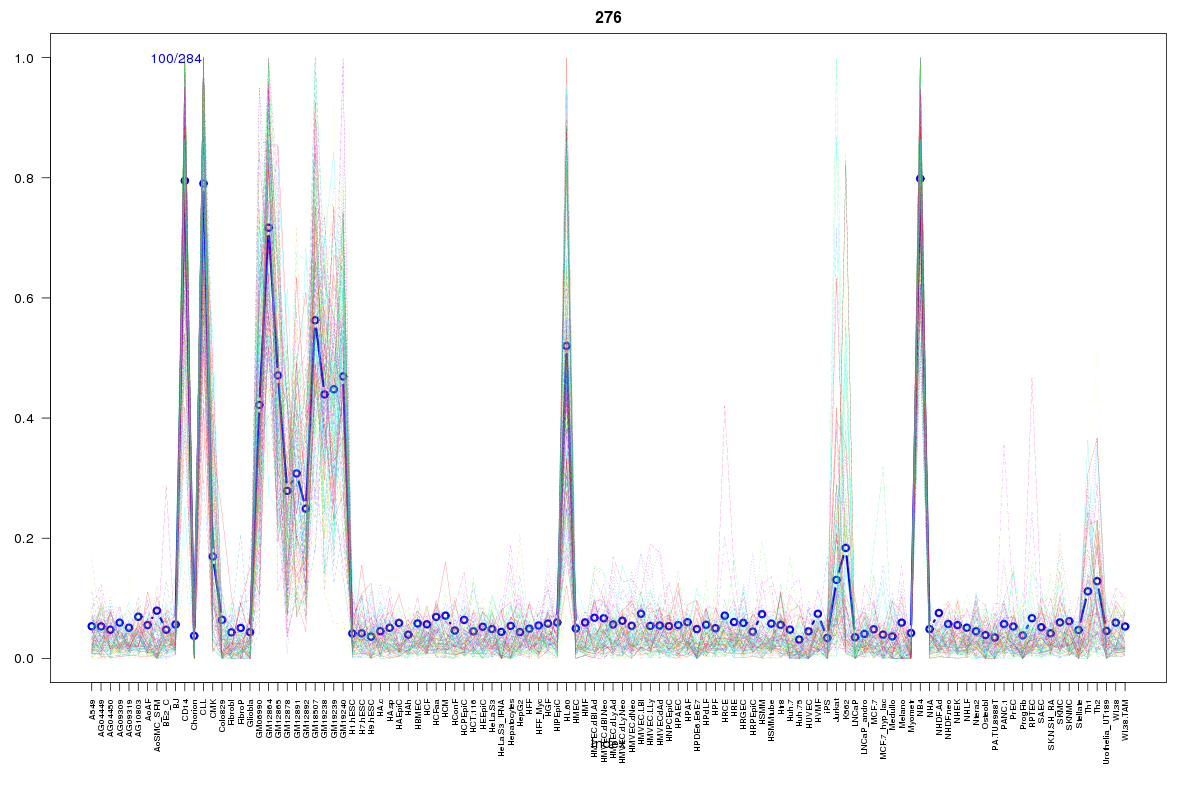 | 276 | 1 |
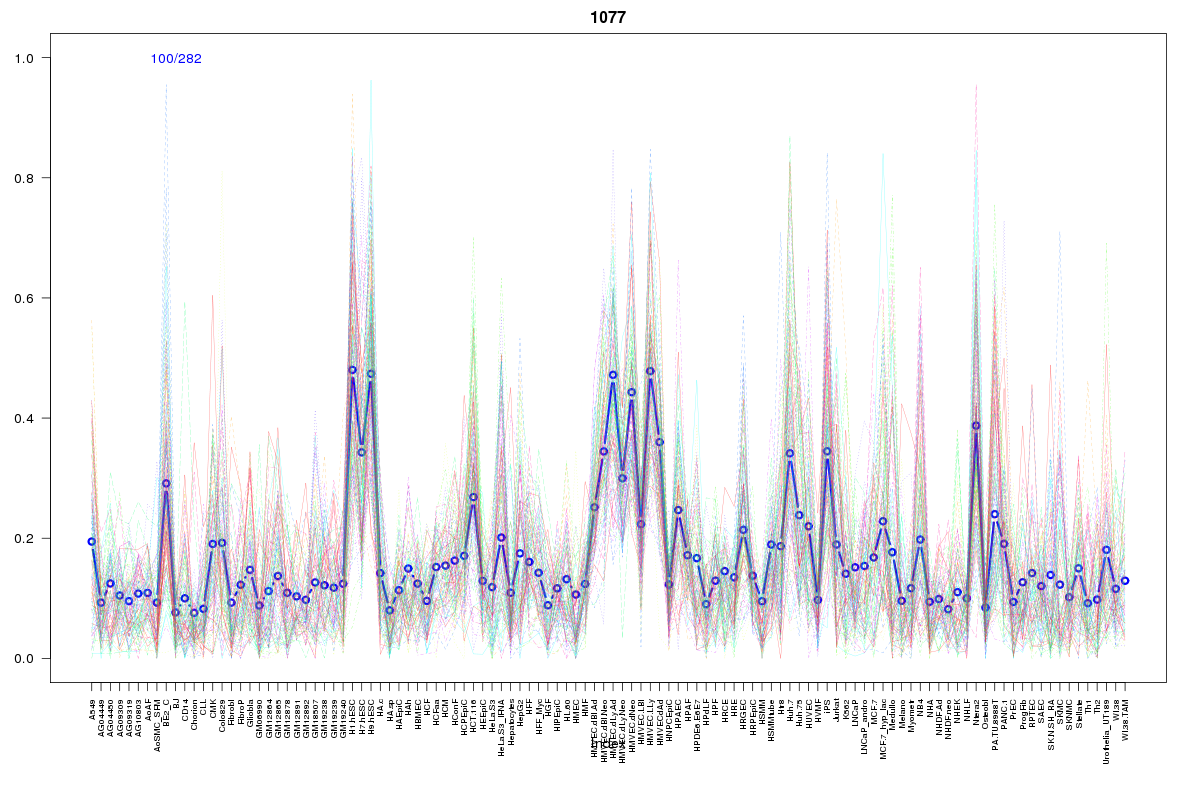 | 1077 | 1 |
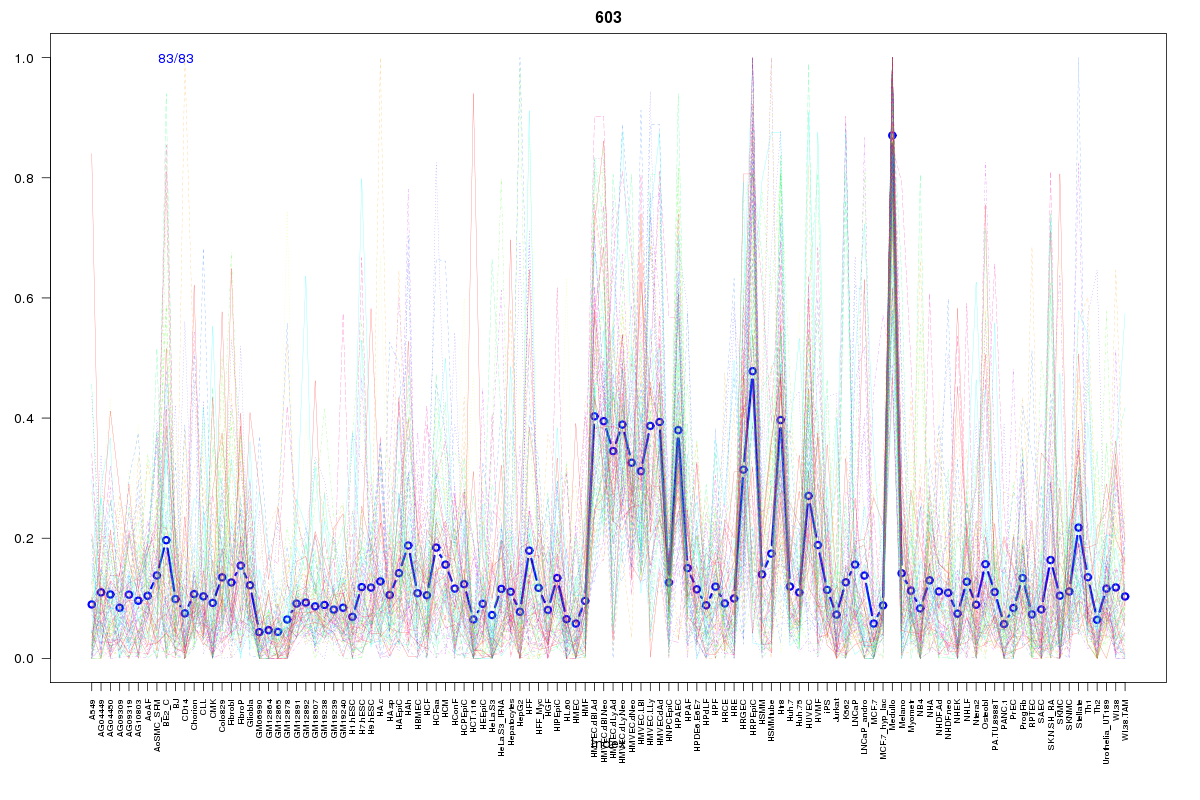 | 603 | 1 |
 | 2055 | 1 |
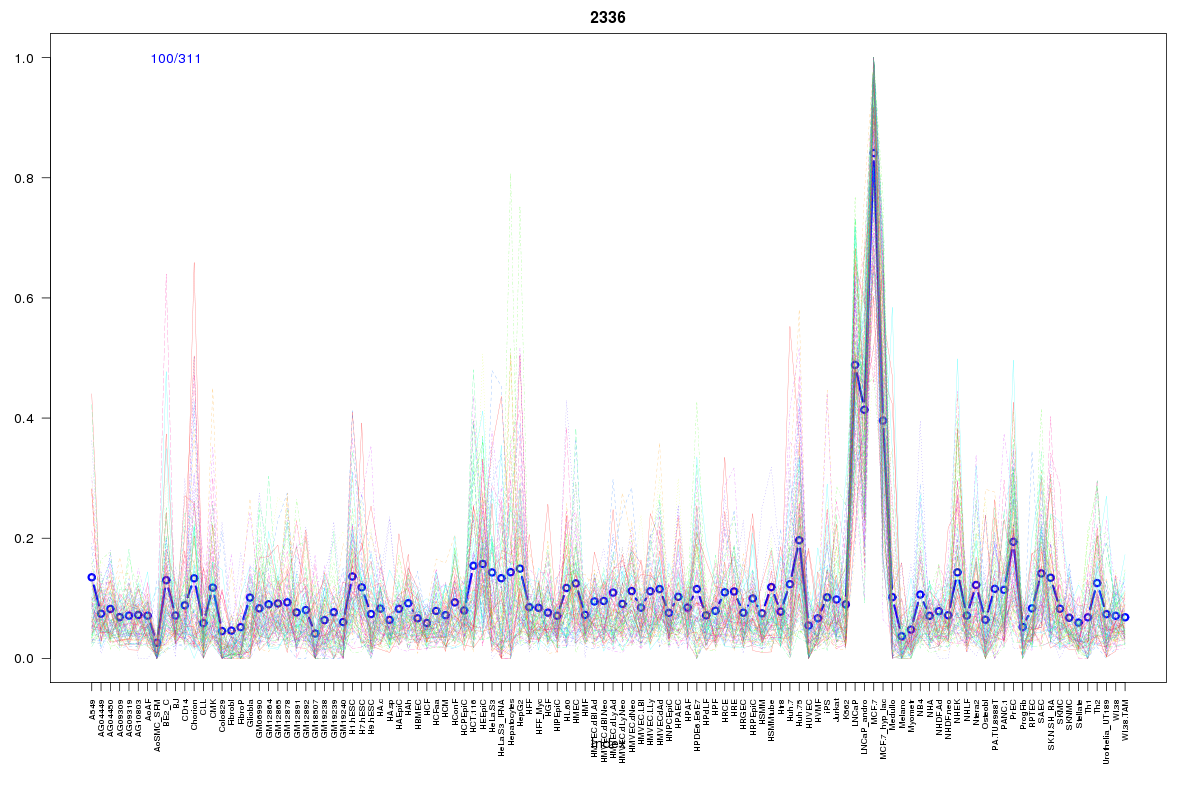 | 2336 | 1 |
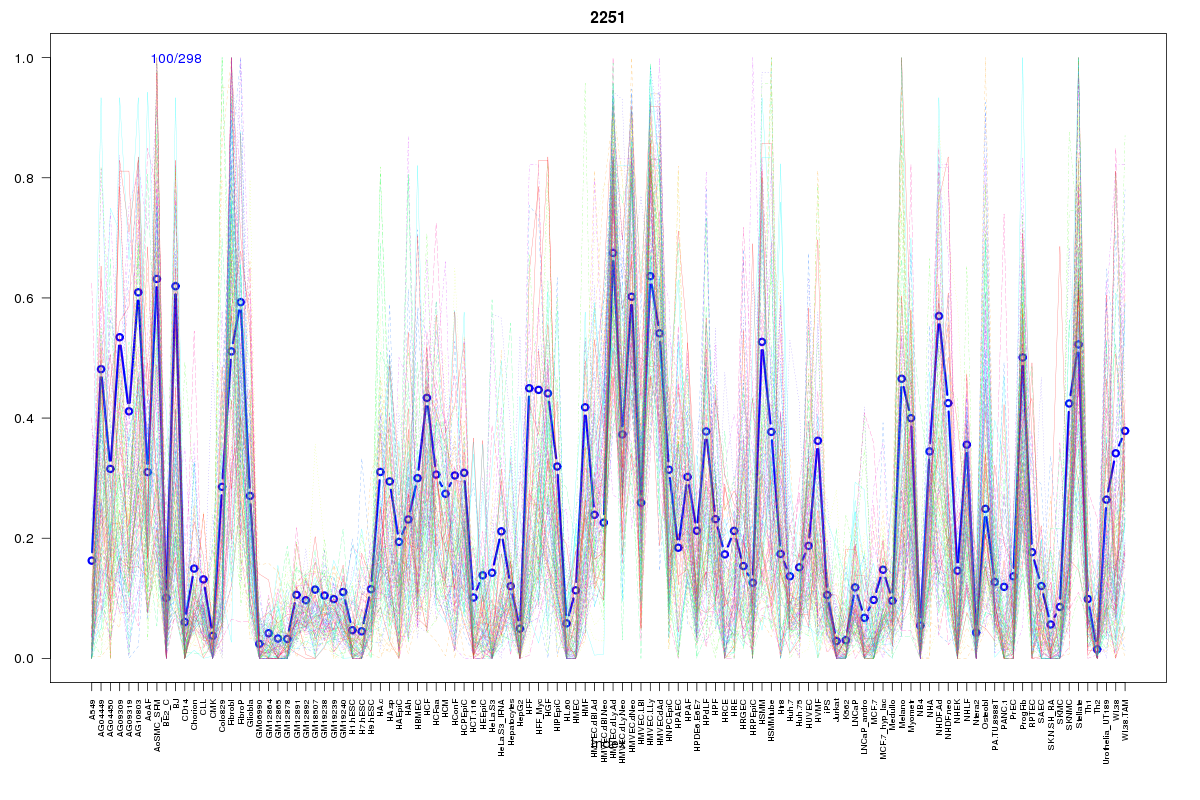 | 2251 | 1 |
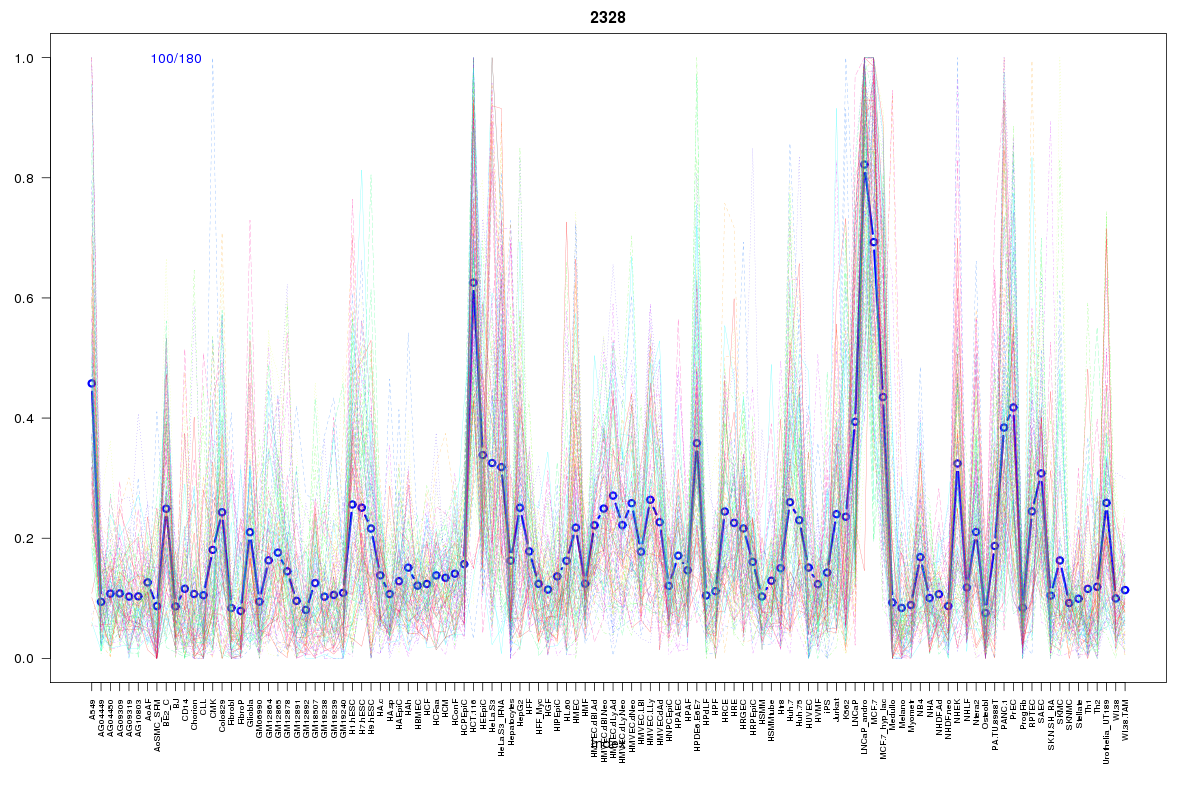 | 2328 | 1 |
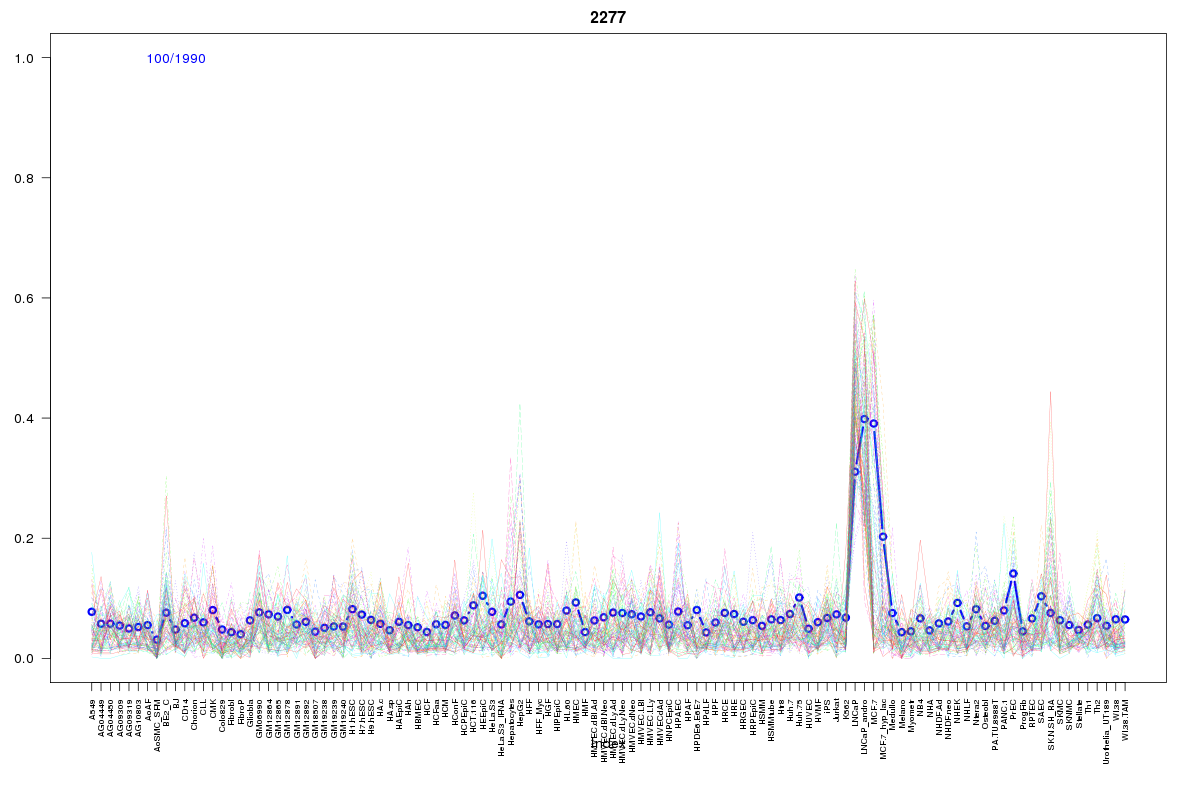 | 2277 | 1 |
 | 2233 | 1 |
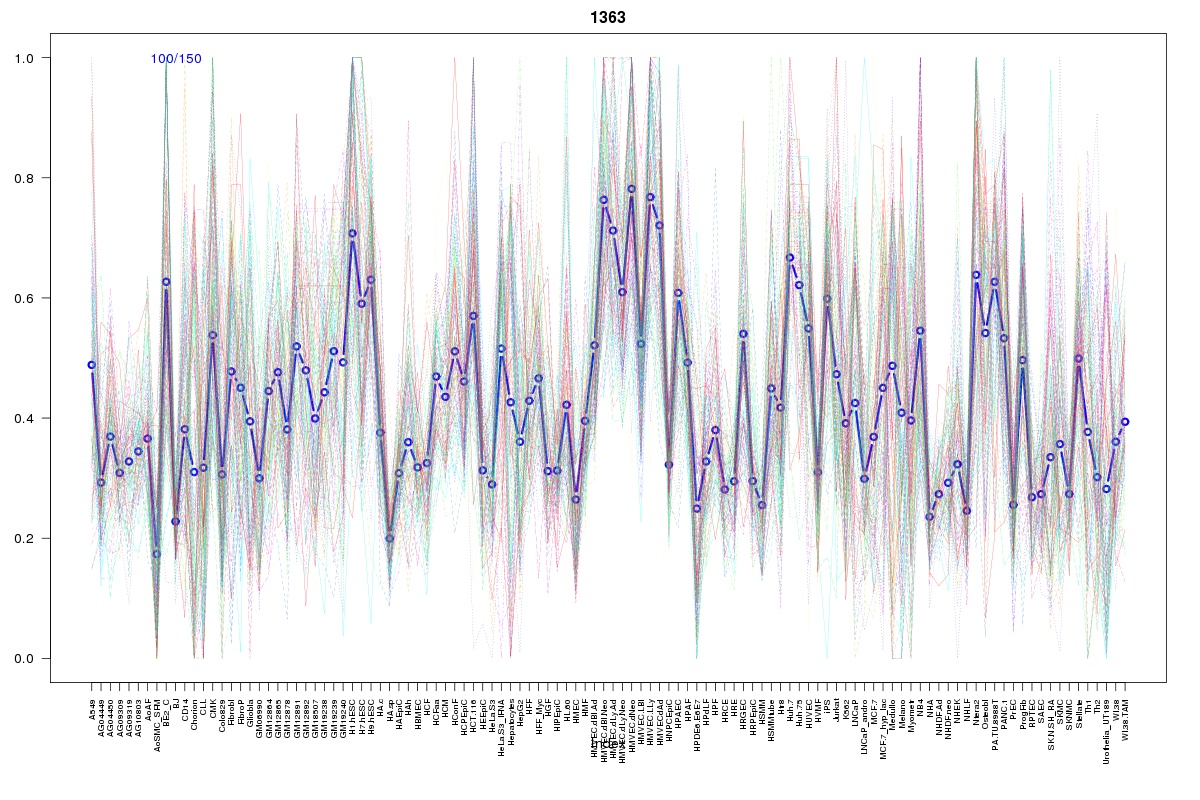 | 1363 | 1 |
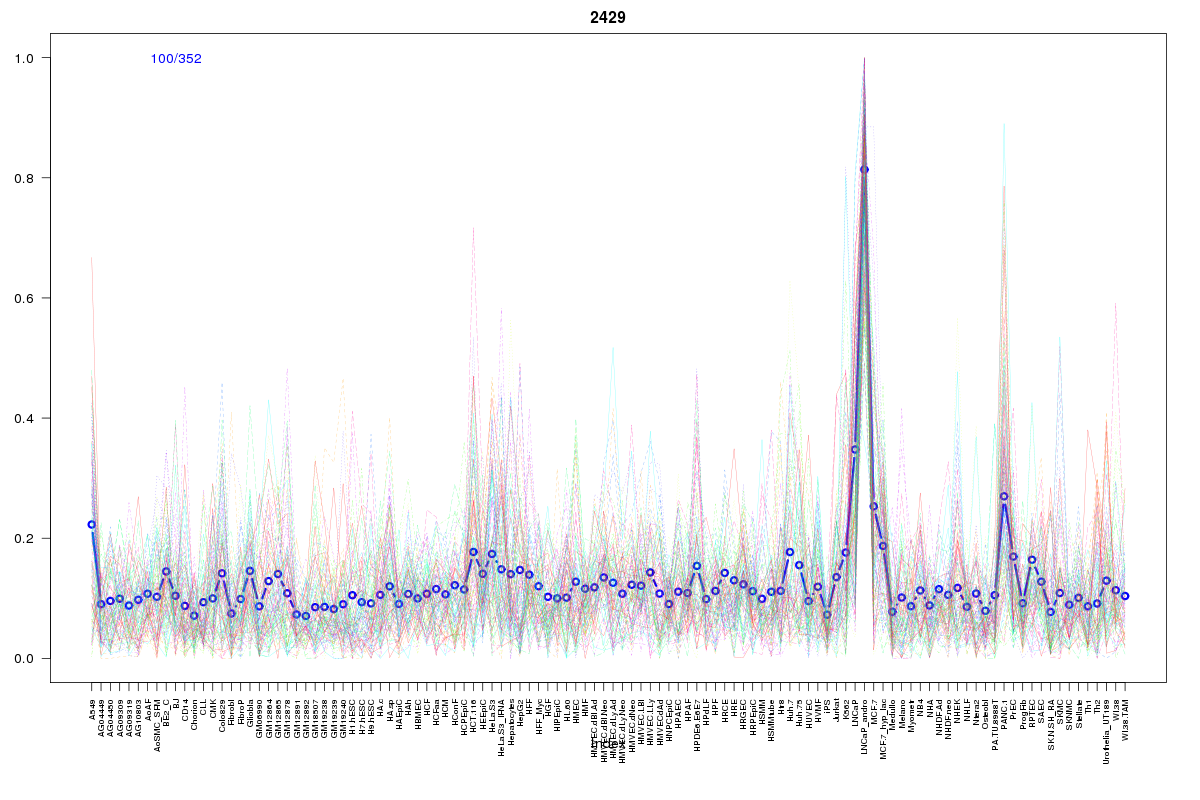 | 2429 | 1 |
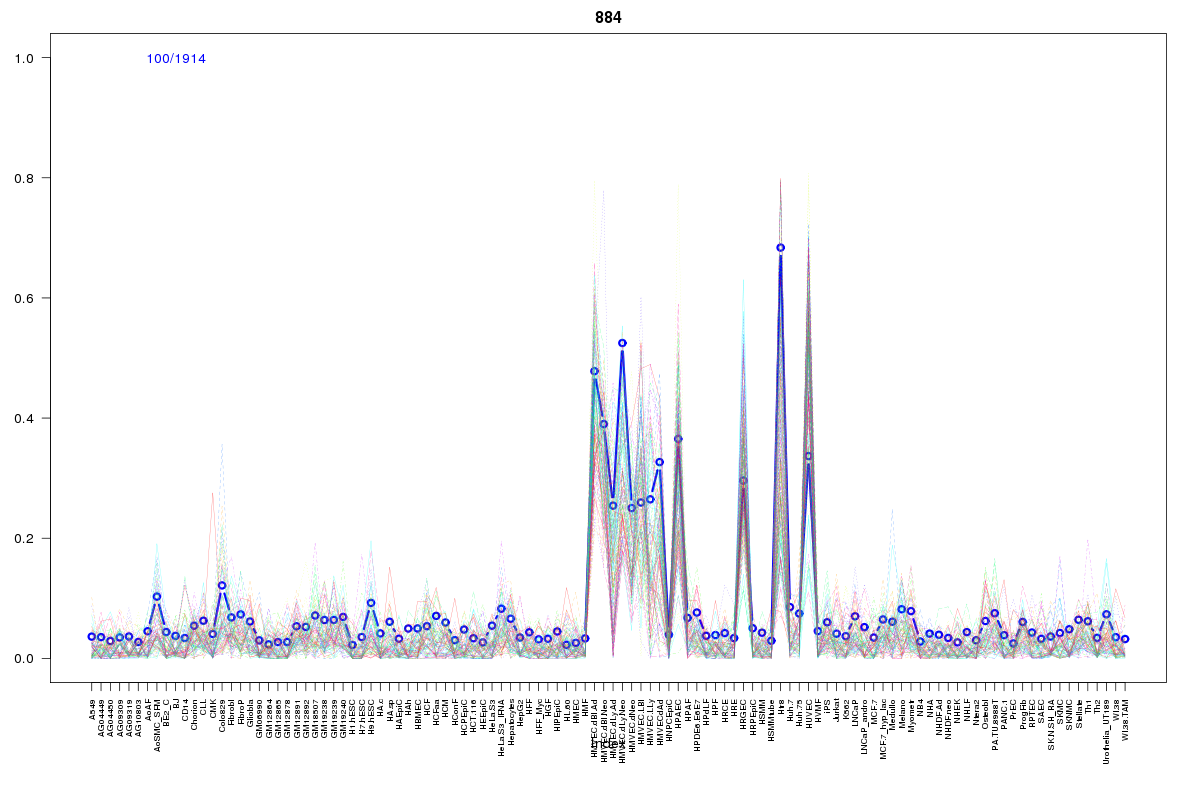 | 884 | 1 |
 | 251 | 1 |
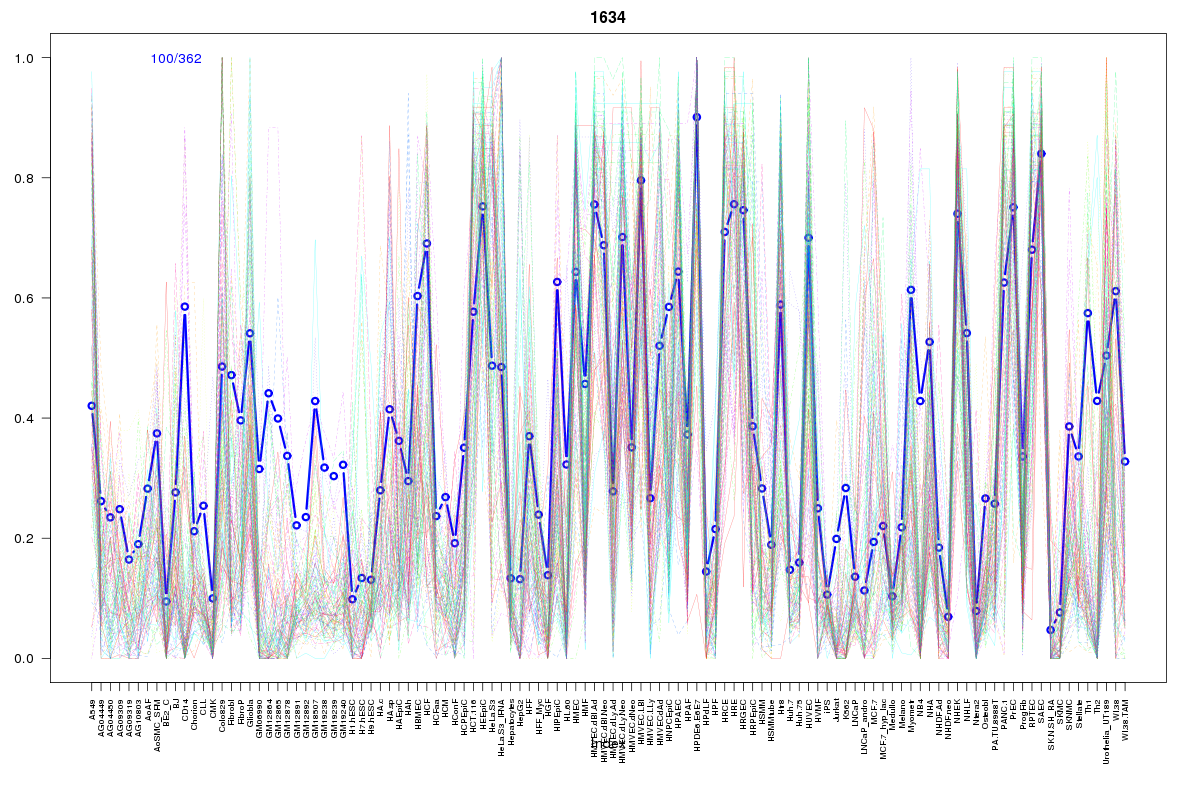 | 1634 | 1 |
 | 108 | 1 |
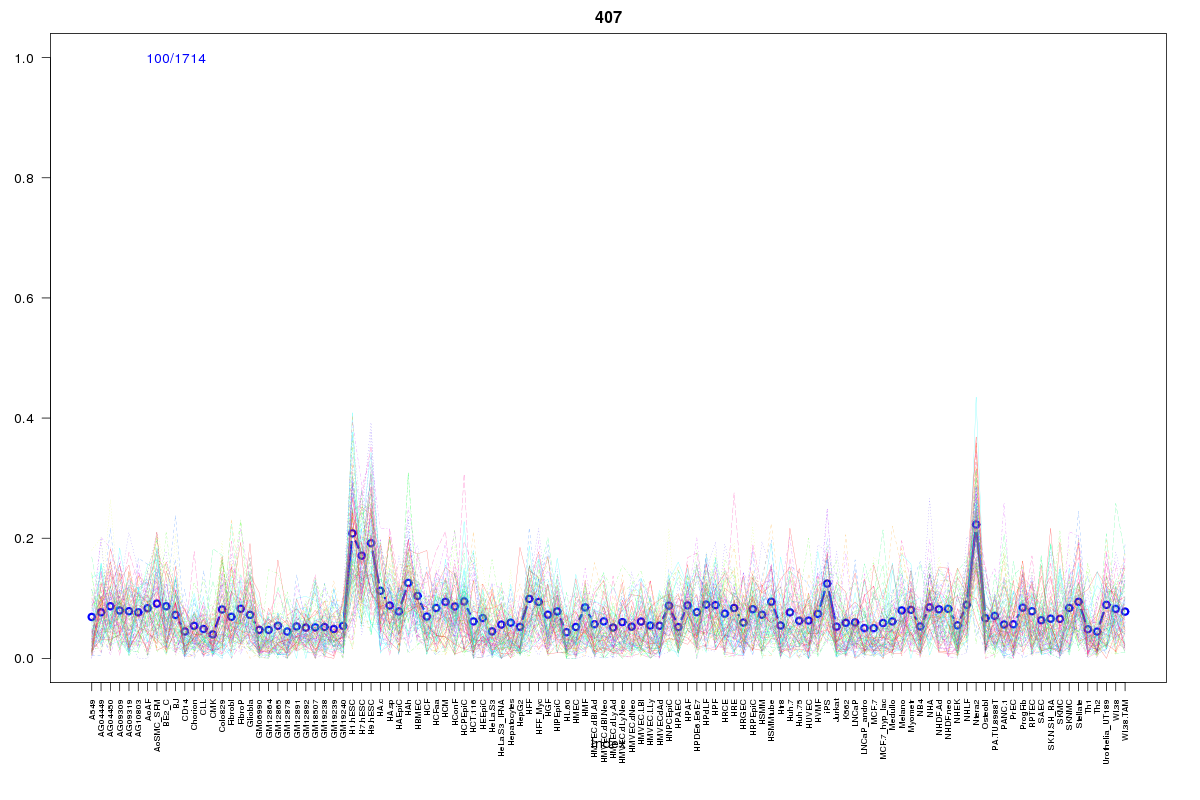 | 407 | 1 |
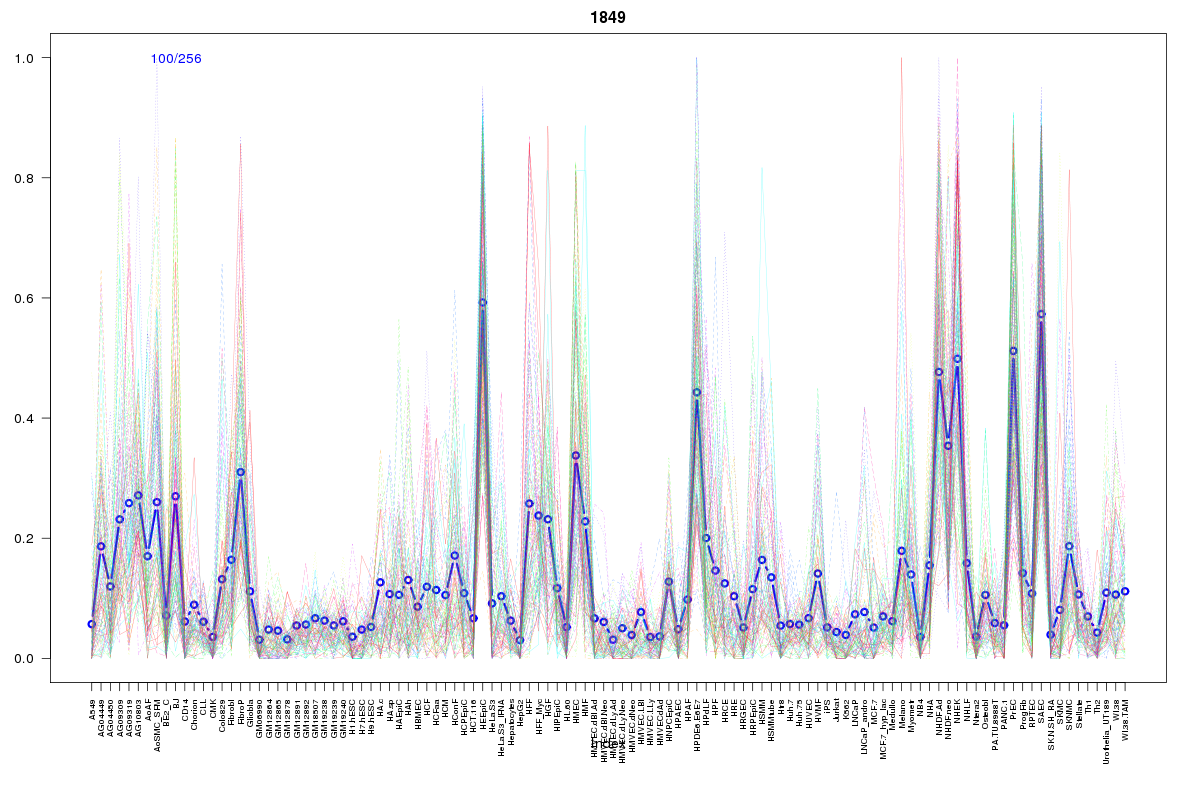 | 1849 | 1 |
Resources
BED file downloads
Connects to 43 DHS sitesTop 10 Correlated DHS Sites
p-values indiciate significant higher or lower correlation| Location | Cluster | P-value |
|---|---|---|
| chr11:44972405-44972555 | 234 | 0 |
| chr11:44976720-44976870 | 188 | 0.002 |
| chr11:45001425-45001575 | 2429 | 0.002 |
| chr11:45043500-45043650 | 1493 | 0.002 |
| chr11:44999860-45000010 | 935 | 0.002 |
| chr11:44970745-44970895 | 1268 | 0.002 |
| chr11:44976560-44976710 | 78 | 0.002 |
| chr11:44839200-44839350 | 829 | 0.005 |
| chr11:44908460-44908610 | 2251 | 0.005 |
| chr11:45069980-45070130 | 882 | 0.005 |
| chr11:44999400-44999550 | 603 | 0.005 |
External Databases
UCSCEnsembl (ENSG00000175274)