SOM cluster: 2233
Cluster Hypersensitivity Profile

Genomic Location Trend
These plots show the distribution of the DHS sites surrounding the Transcript Start Site of the nearest gene.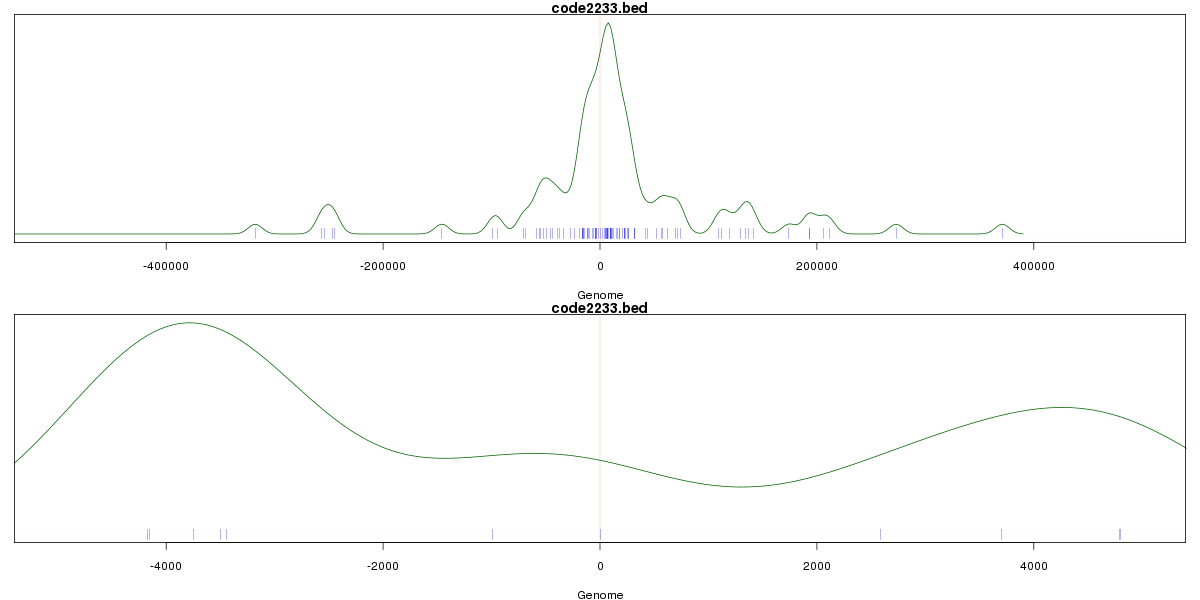
Stats
Number of sites: 924Promoter: 2%
CpG-Island: 0%
Conserved: 38%
Enriched Motifs & Matches
Match Detail: [Jaspar]
|
| ||
|---|---|---|
| Sites: 37/100 | e-val: 0.0000000011 | ||
| Factor | e-val(match) | DB |
| FOXA1 | 0.0000000000041946 | JASPAR |
| Foxa2 | 0.000000000046655 | JASPAR |
| HNF1B | 0.00000010904 | JASPAR |
| FOXO3 | 0.0000041948 | JASPAR |
| FOXD1 | 0.0000057295 | JASPAR |
BED file downloads
Top 10 Example Regions
| Location | Gene Link | Dist. |
|---|---|---|
| chr1: 151029100-151029250 | ANXA9 | 18.26 |
| chr3: 124729485-124729635 | HEG1 | 39.43 |
| chr15: 101469200-101469350 | RP11-66B24.1 | 49.44 |
| chr21: 37618540-37618690 | RPL3P1 | 49.55 |
| chr17: 4542225-4542375 | ALOX15 | 49.78 |
| chr17: 4542225-4542375 | RP11-314A20.2 | 49.78 |
| chr19: 19706240-19706390 | CILP2 | 51.69 |
| chr11: 17008880-17009030 | PLEKHA7 | 52.71 |
| chr11: 17008880-17009030 | OR7E14P | 52.71 |
| chr19: 50709245-50709395 | MYH14 | 55.42 |