SOM cluster: 635
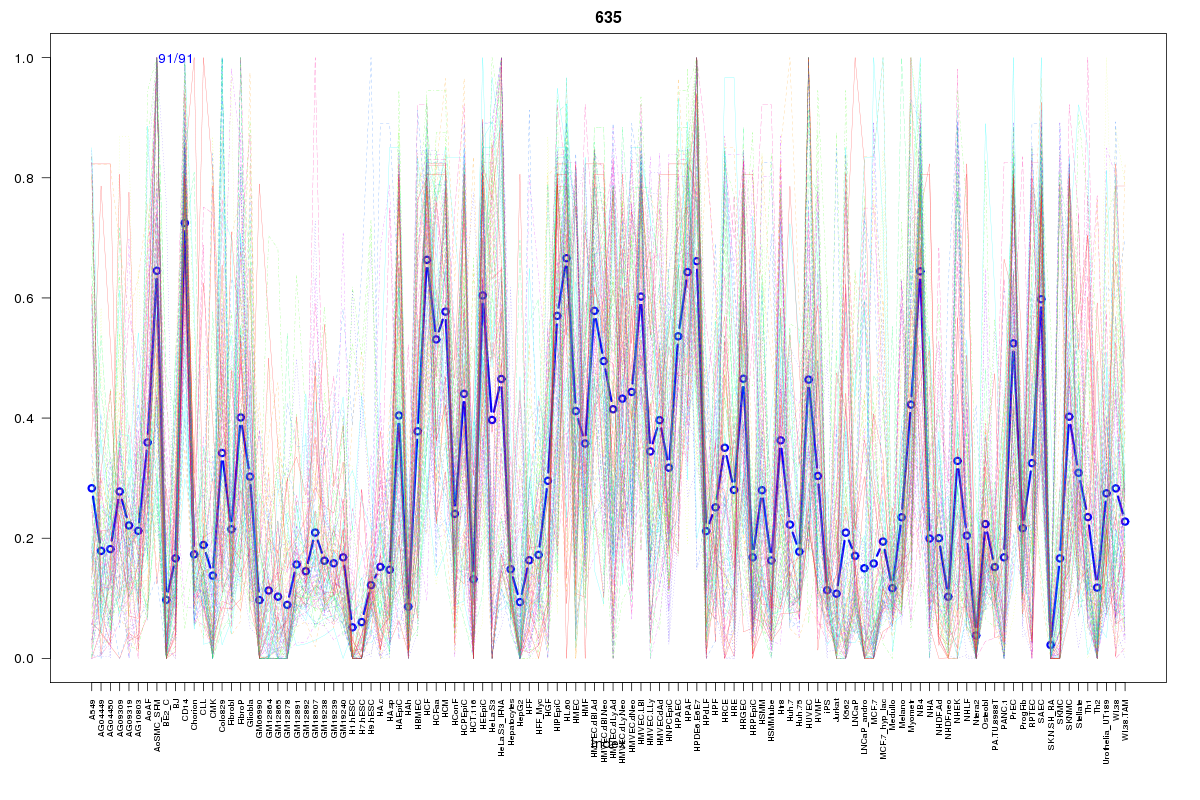
Cluster Hypersensitivity Profile

Genomic Location Trend
These plots show the distribution of the DHS sites surrounding the Transcript Start Site of the nearest gene.
Stats
Number of sites: 91Promoter: 2%
CpG-Island: 0%
Conserved: 30%
Enriched Motifs & Matches
Match Detail: [Jaspar]
|
| ||
|---|---|---|
| Sites: 25/91 | e-val: 0.000000013 | ||
| Factor | e-val(match) | DB |
| FEV | 0.0000021362 | JASPAR |
| SPI1 | 0.0000057349 | JASPAR |
| SPIB | 0.000013055 | JASPAR |
| EWSR1-FLI1 | 0.000047537 | JASPAR |
| ELF5 | 0.000077352 | JASPAR |
|
| ||
| Sites: 23/91 | e-val: 0.59 | ||
| Factor | e-val(match) | DB |
| CEBPA | 0.0000010887 | JASPAR |
| Pou5f1 | 0.0000018917 | JASPAR |
| NFIL3 | 0.0000031414 | JASPAR |
| Sox2 | 0.0000034953 | JASPAR |
| HLF | 0.0000057146 | JASPAR |
BED file downloads
Top 10 Example Regions
| Location | Gene Link | Dist. |
|---|---|---|
| chr1: 97955520-97955670 | SEC63P1 | 50.4 |
| chr5: 77178620-77178770 | TBCA | 52.08 |
| chr3: 172280620-172280770 | TNFSF10 | 55.32 |
| chr2: 28940300-28940450 | AC097724.3 | 61.84 |
| chr1: 89740120-89740270 | GBP4 | 63.99 |
| chrX: 38206500-38206650 | OTC | 66.61 |
| chrX: 38206500-38206650 | TDGF1P1 | 66.61 |
| chr1: 10438620-10438770 | APITD1-CORT | 66.98 |
| chr10: 129846540-129846690 | PTPRE | 71.85 |
| chr22: 36767340-36767490 | MYH9 | 78.55 |