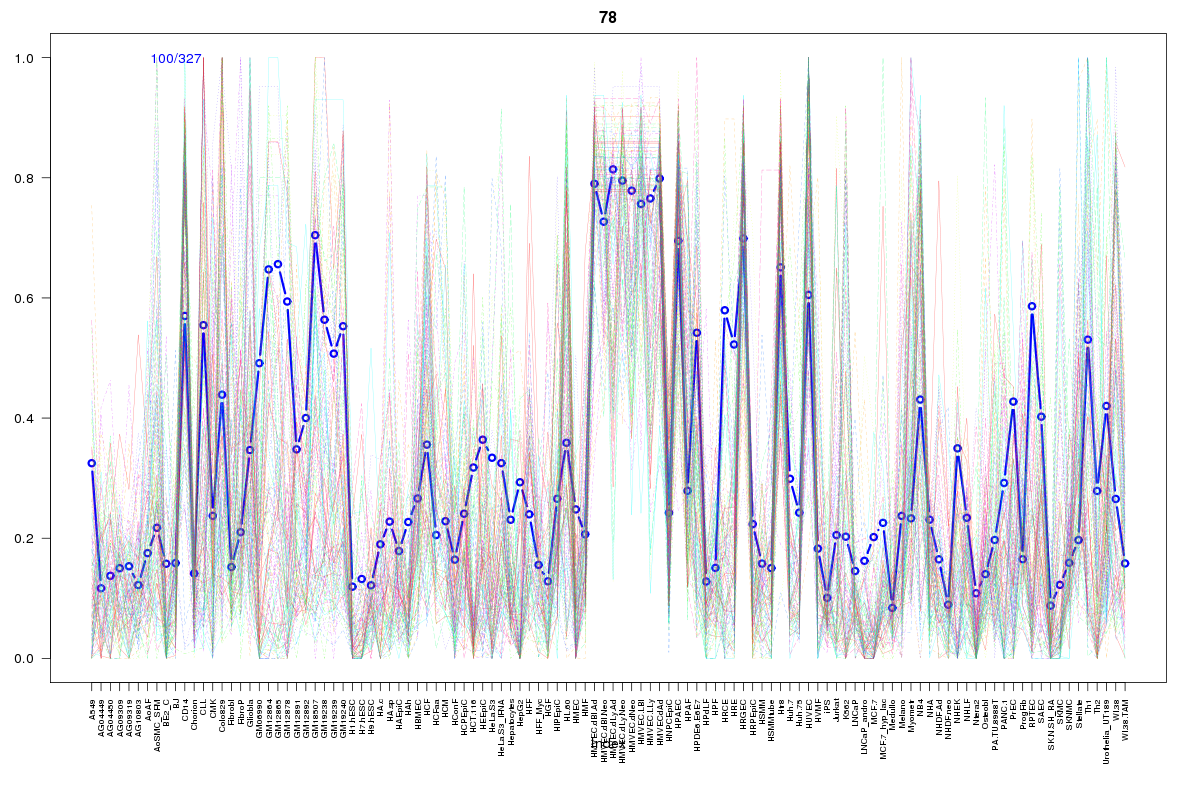
SOM cluster: 78
Cluster Hypersensitivity Profile

Genomic Location Trend
These plots show the distribution of the DHS sites surrounding the Transcript Start Site of the nearest gene.
Stats
Number of sites: 327Promoter: 11%
CpG-Island: 0%
Conserved: 46%
Enriched Motifs & Matches
Match Detail: [Jaspar]
|
| ||
|---|---|---|
| Sites: 56/100 | e-val: 1.1e-26 | ||
| Factor | e-val(match) | DB |
| FEV | 0.00000000012848 | JASPAR |
| SPI1 | 0.0000000045844 | JASPAR |
| ELK4 | 0.000000013381 | JASPAR |
| ELF5 | 0.0000038537 | JASPAR |
| SPIB | 0.000008705 | JASPAR |
BED file downloads
Top 10 Example Regions
| Location | Gene Link | Dist. |
|---|---|---|
| chr11: 6656585-6656735 | RP11-732A19.9 | 47.26 |
| chr11: 6656585-6656735 | TPP1 | 47.26 |
| chr11: 6656585-6656735 | DCHS1 | 47.26 |
| chr2: 26183900-26184050 | KIF3C | 52.43 |
| chr13: 110993320-110993470 | COL4A1 | 52.76 |
| chr13: 110993320-110993470 | snoU13 | 52.76 |
| chr13: 110993320-110993470 | COL4A2 | 52.76 |
| chr2: 163175420-163175570 | IFIH1 | 55.91 |
| chr2: 163175420-163175570 | FAP | 55.91 |
| chr12: 113344580-113344730 | OAS3 | 57.65 |