SOM cluster: 224
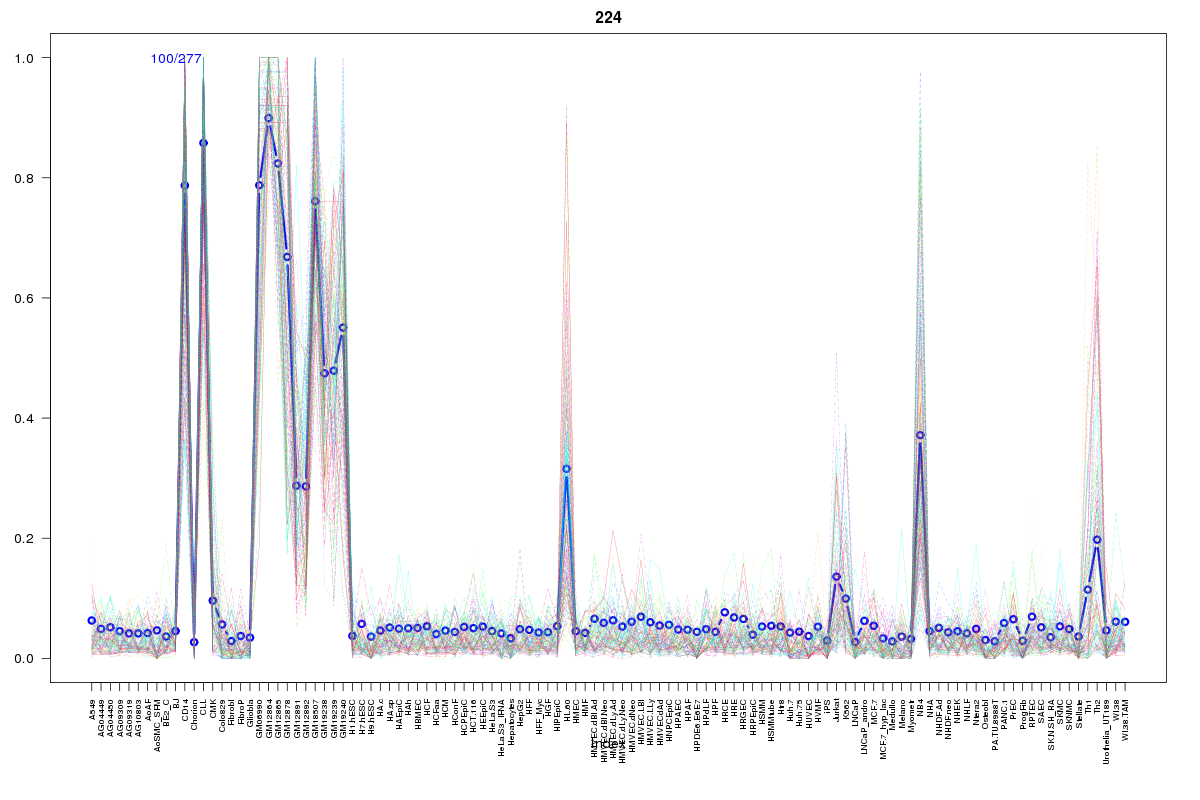
Cluster Hypersensitivity Profile

Genomic Location Trend
These plots show the distribution of the DHS sites surrounding the Transcript Start Site of the nearest gene.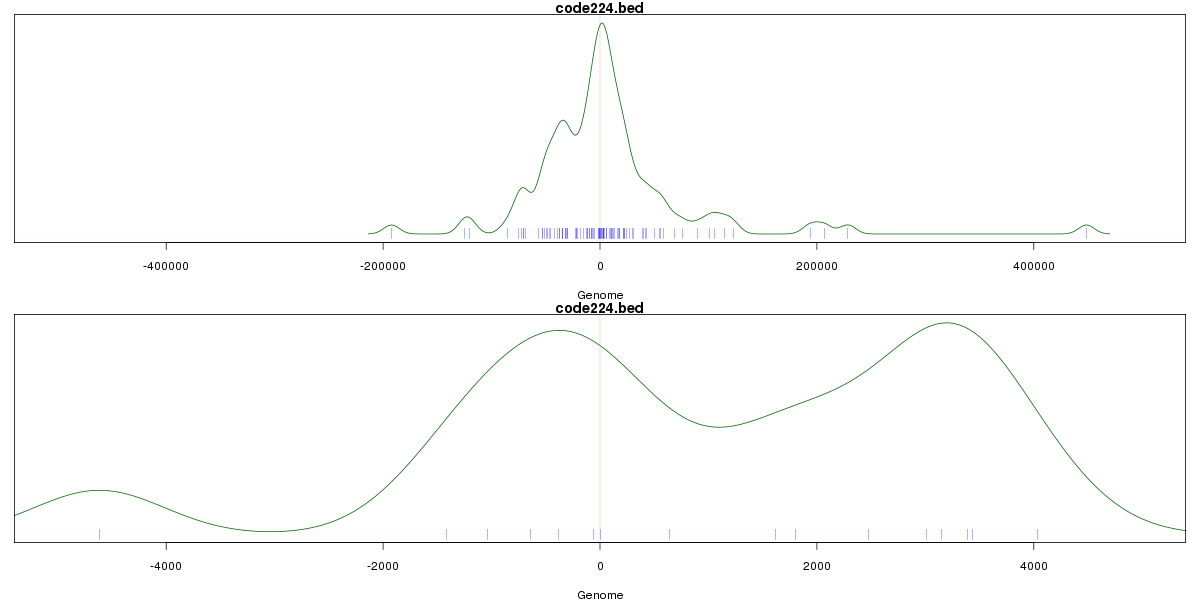
Stats
Number of sites: 277Promoter: 7%
CpG-Island: 0%
Conserved: 37%
Enriched Motifs & Matches
Match Detail: [Jaspar]
|
| ||
|---|---|---|
| Sites: 56/100 | e-val: 0 | ||
| Factor | e-val(match) | DB |
| SPI1 | 0.000000090179 | JASPAR |
| SPIB | 0.00000074052 | JASPAR |
| IRF1 | 0.000018402 | JASPAR |
| FEV | 0.00019833 | JASPAR |
| ELF5 | 0.00093276 | JASPAR |
|
| ||
| Sites: 22/100 | e-val: 0.0000000033 | ||
| Factor | e-val(match) | DB |
| SPI1 | 0.00000055059 | JASPAR |
| SPIB | 0.000004518 | JASPAR |
| IRF1 | 0.0000087734 | JASPAR |
| IRF2 | 0.000068688 | JASPAR |
| FEV | 0.00064609 | JASPAR |
|
| ||
| Sites: 10/100 | e-val: 1.8 | ||
| Factor | e-val(match) | DB |
| IRF1 | 0.00000005652 | JASPAR |
| IRF2 | 0.00043695 | JASPAR |
| SPI1 | 0.00076579 | JASPAR |
| SOX9 | 0.00098864 | JASPAR |
| GABPA | 0.0065712 | JASPAR |
BED file downloads
Top 10 Example Regions
| Location | Gene Link | Dist. |
|---|---|---|
| chr1: 161709740-161709890 | FCGR2B | 35.64 |
| chr1: 161709740-161709890 | FCRLA | 35.64 |
| chr1: 161709740-161709890 | RPL31P11 | 35.64 |
| chr1: 161709740-161709890 | RP11-25K21.1 | 35.64 |
| chr5: 118677480-118677630 | TNFAIP8 | 50.04 |
| chr3: 179066240-179066390 | ZNF639 | 50.62 |
| chr3: 179066240-179066390 | MFN1 | 50.62 |
| chrX: 65266860-65267010 | RP6-159A1.2 | 53.02 |
| chr6: 114126400-114126550 | RP1-249H1.4 | 53.93 |
| chr11: 63399040-63399190 | HRASLS2 | 55.55 |