Gene: SGTA
chr19: 2754711-2783369Expression Profile
(log scale)
Graphical Connections
Distribution of linked clusters:
You may find it interesting if many of the connected DHS sites belong to the same cluster.| Cluster Profile | Cluster ID | Number of DHS sites in this cluster |
|---|---|---|
 | 626 | 3 |
 | 1355 | 2 |
 | 1008 | 2 |
 | 1070 | 1 |
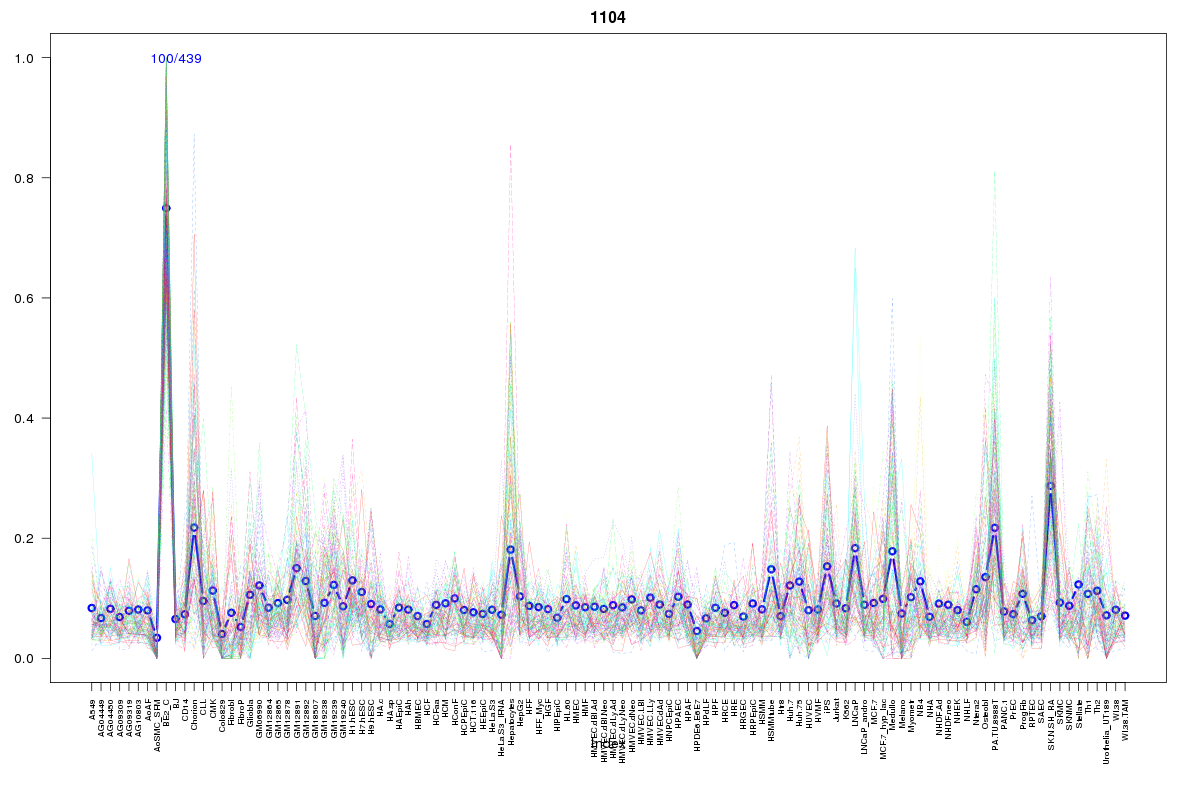 | 1104 | 1 |
 | 15 | 1 |
 | 1078 | 1 |
 | 2055 | 1 |
 | 570 | 1 |
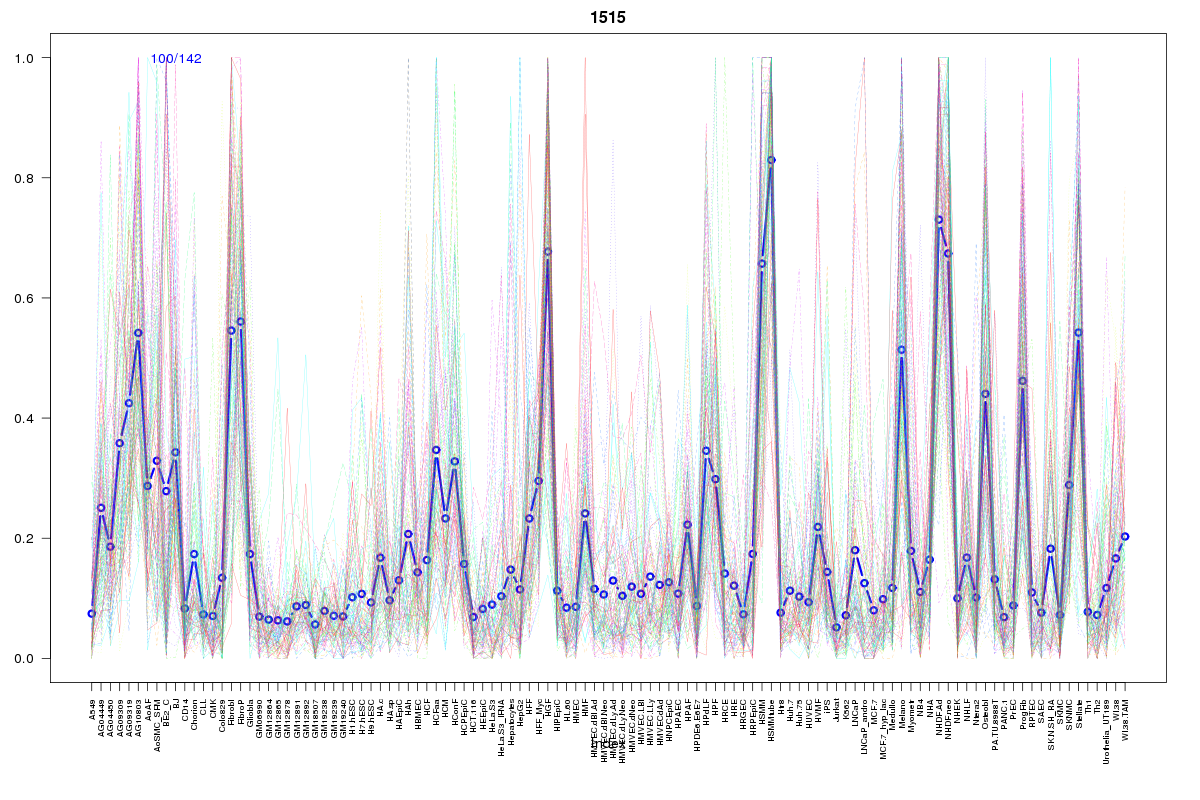 | 1515 | 1 |
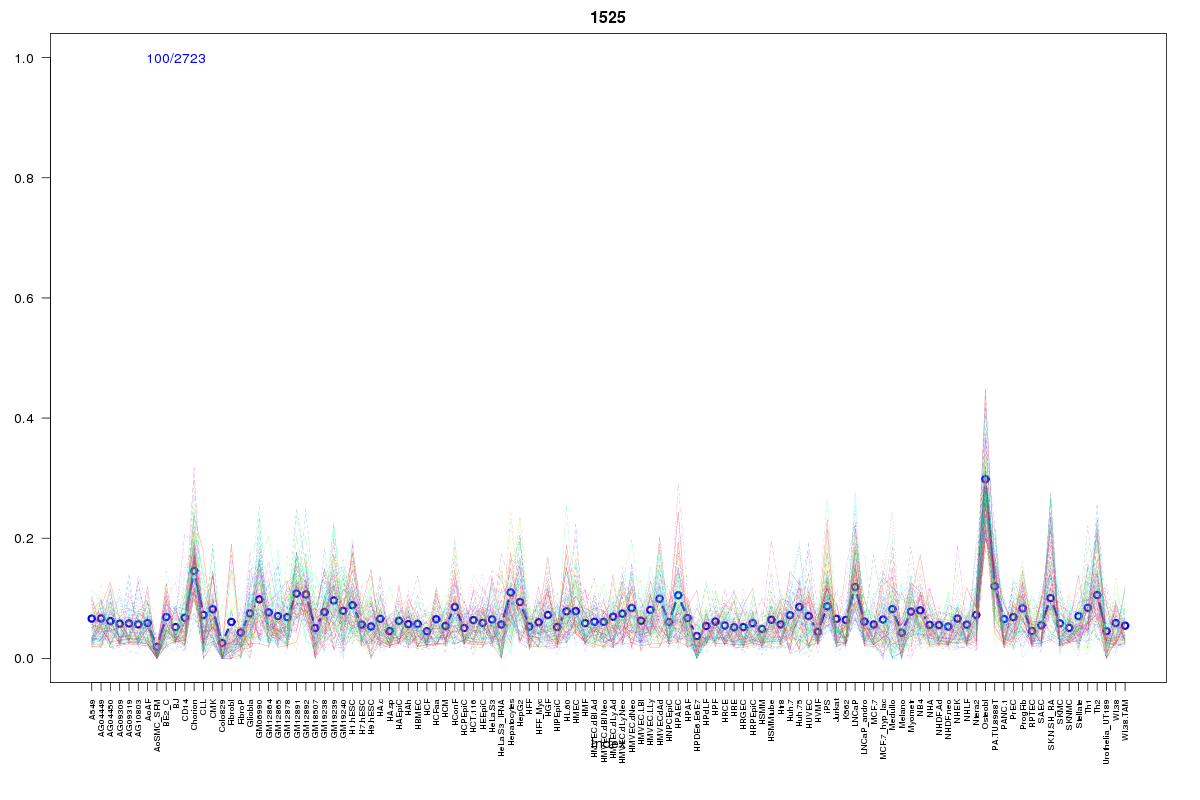 | 1525 | 1 |
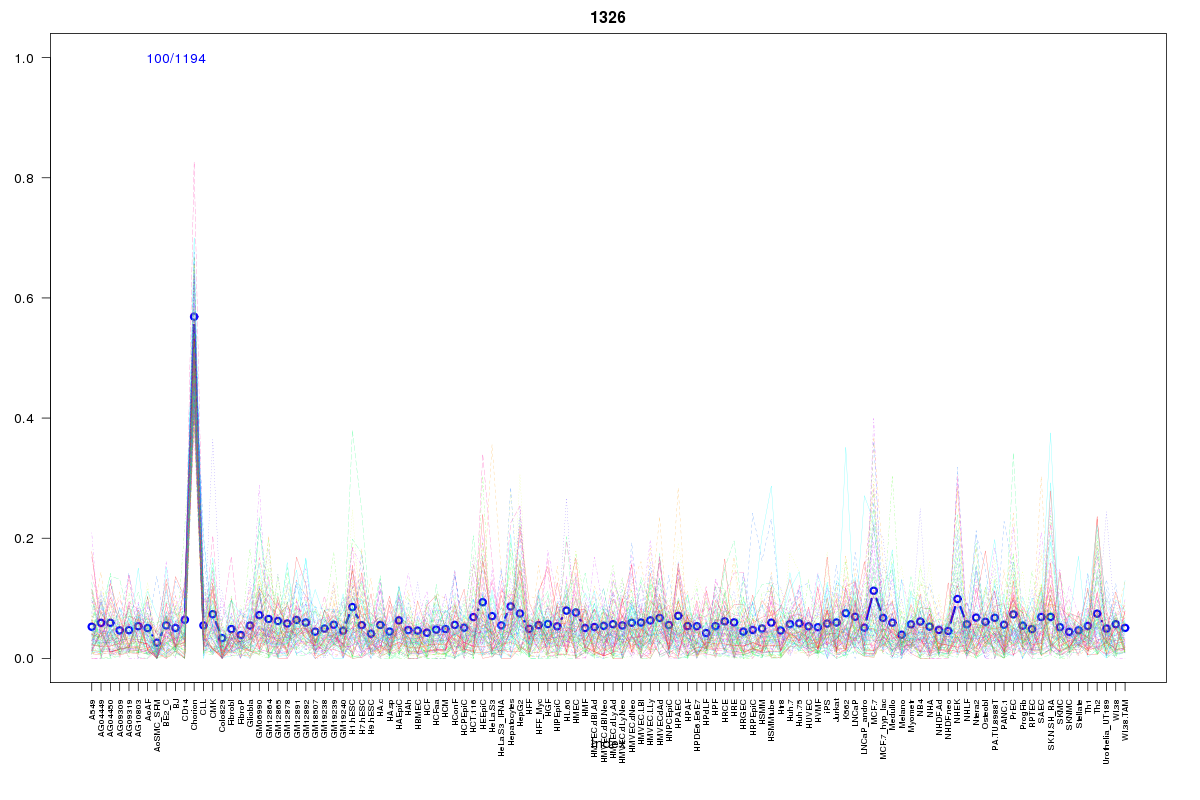 | 1326 | 1 |
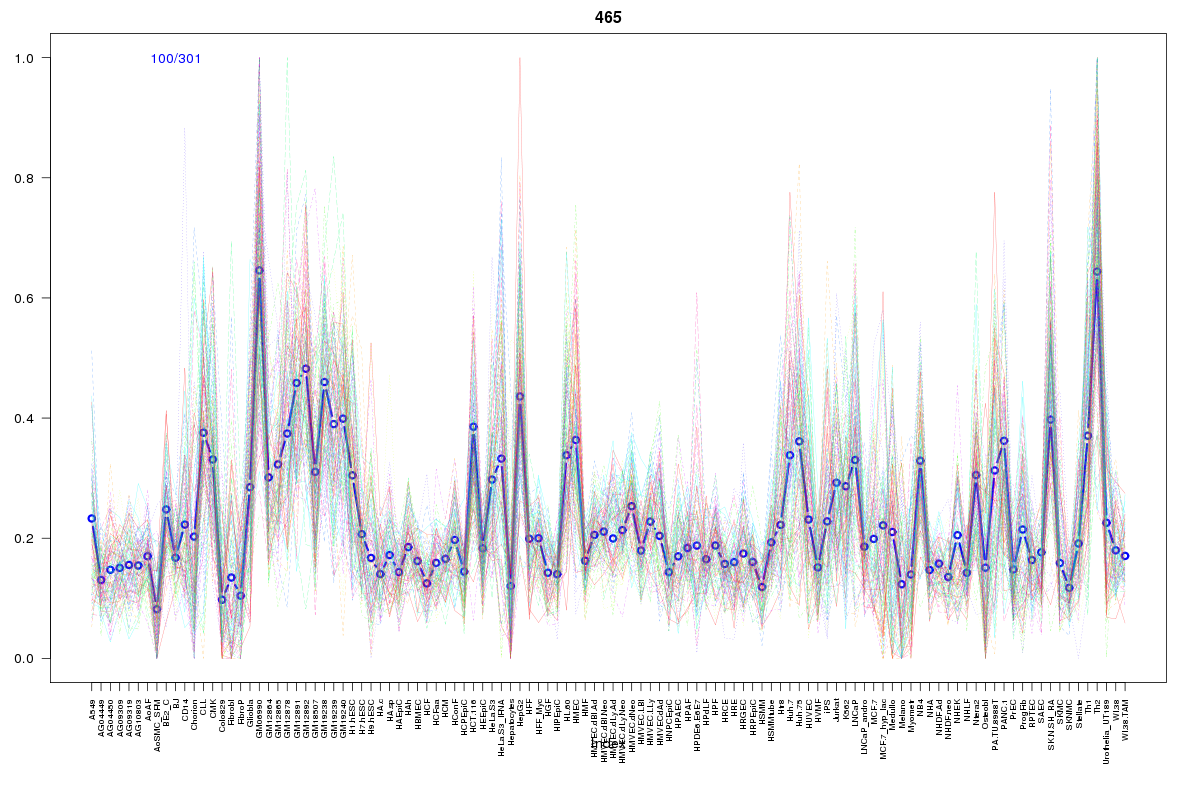 | 465 | 1 |
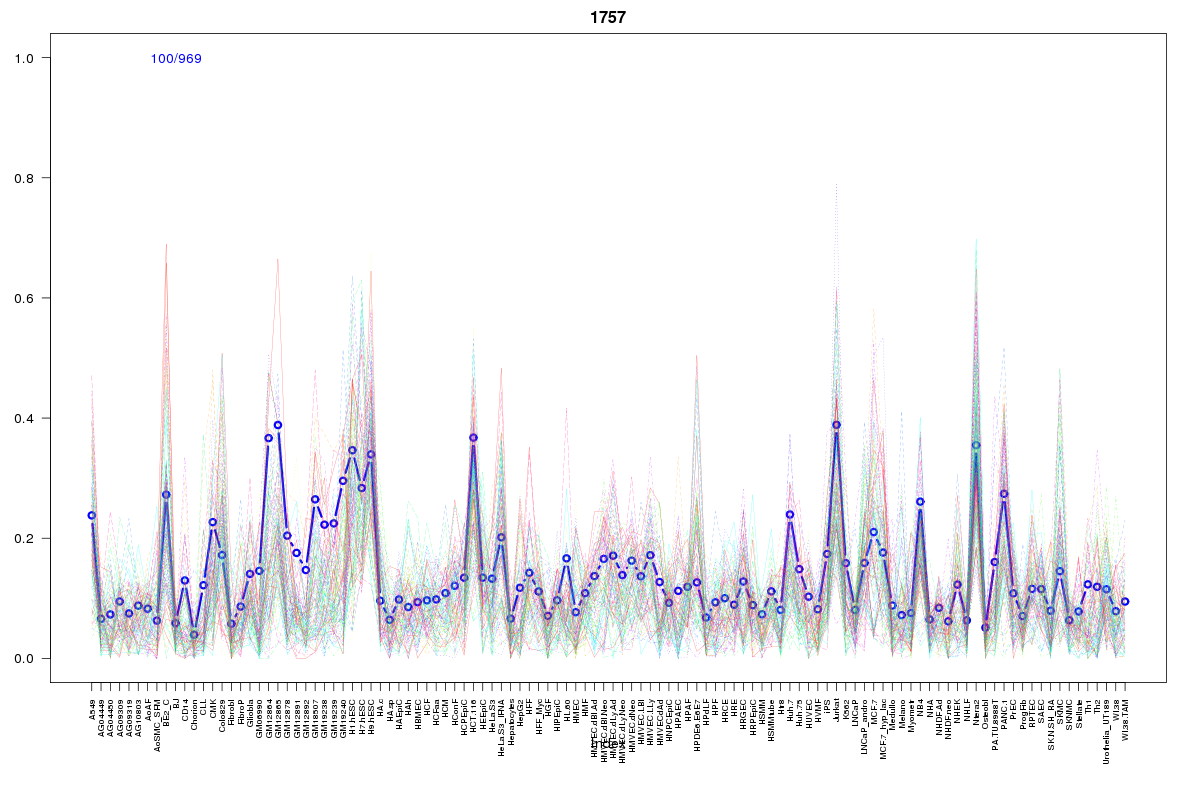 | 1757 | 1 |
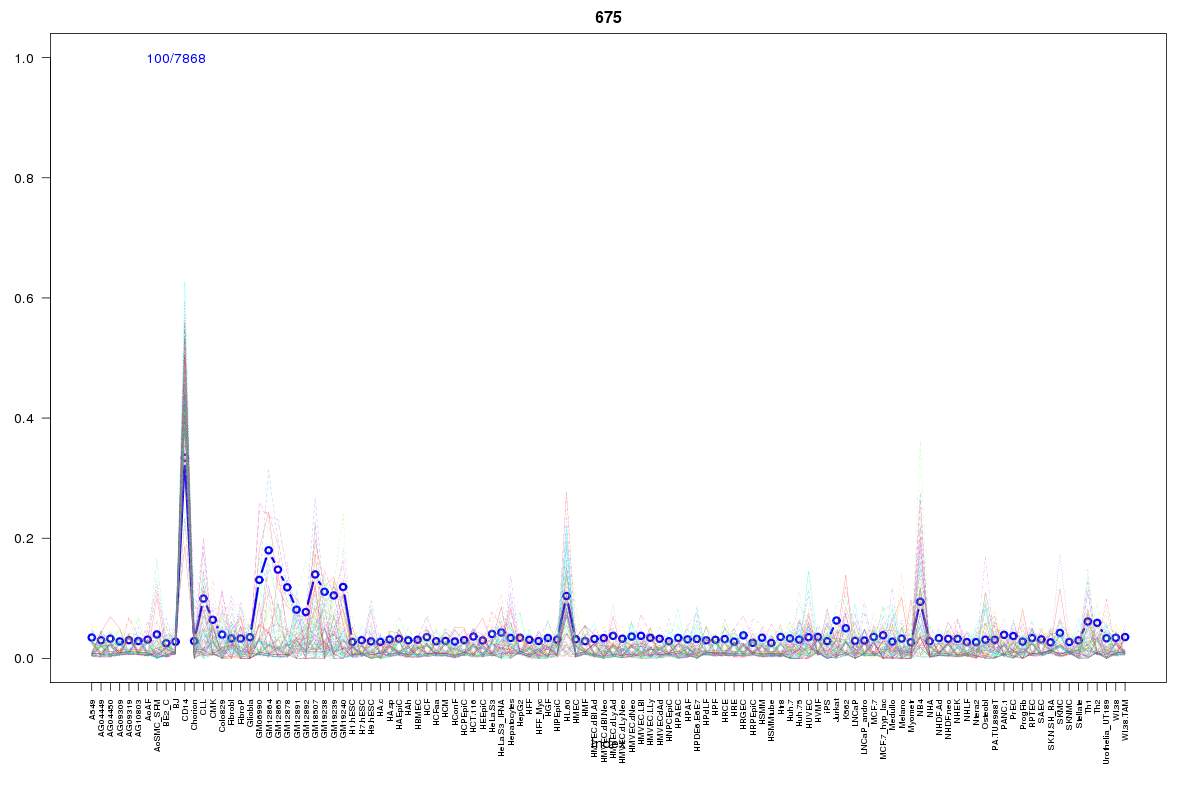 | 675 | 1 |
 | 615 | 1 |
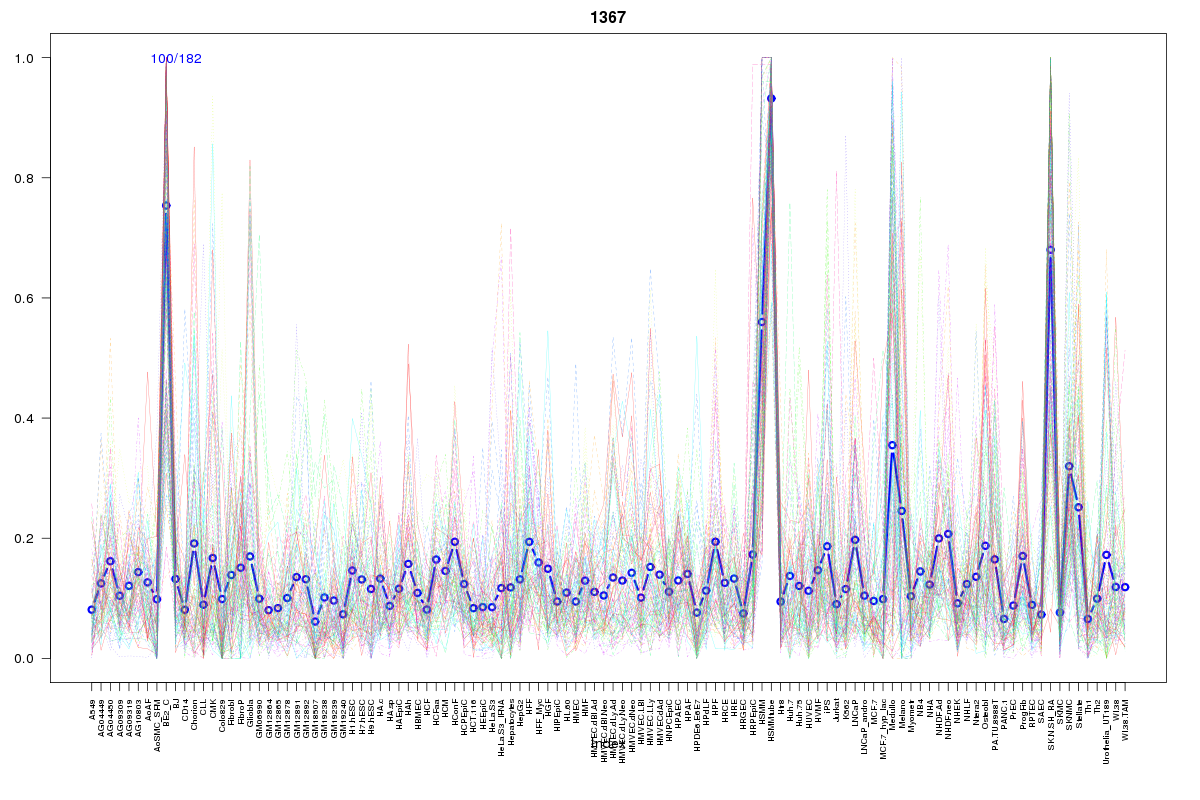 | 1367 | 1 |
 | 927 | 1 |
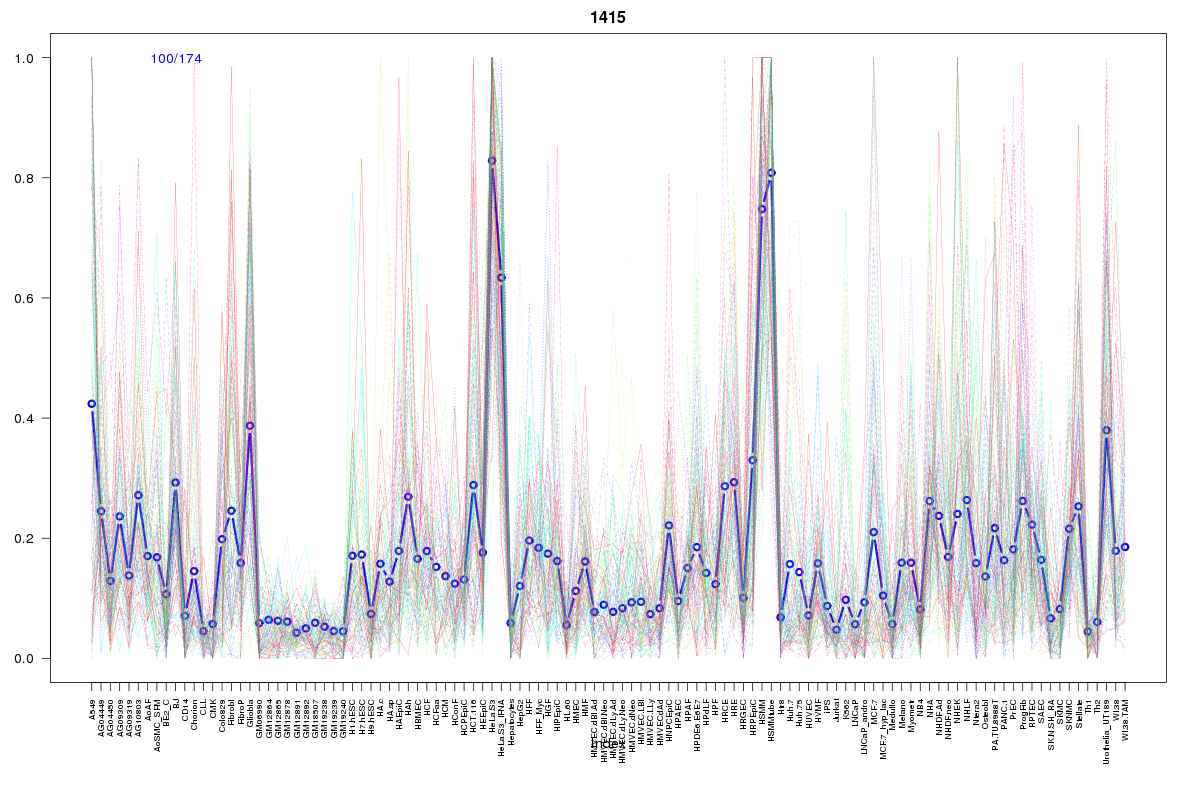 | 1415 | 1 |
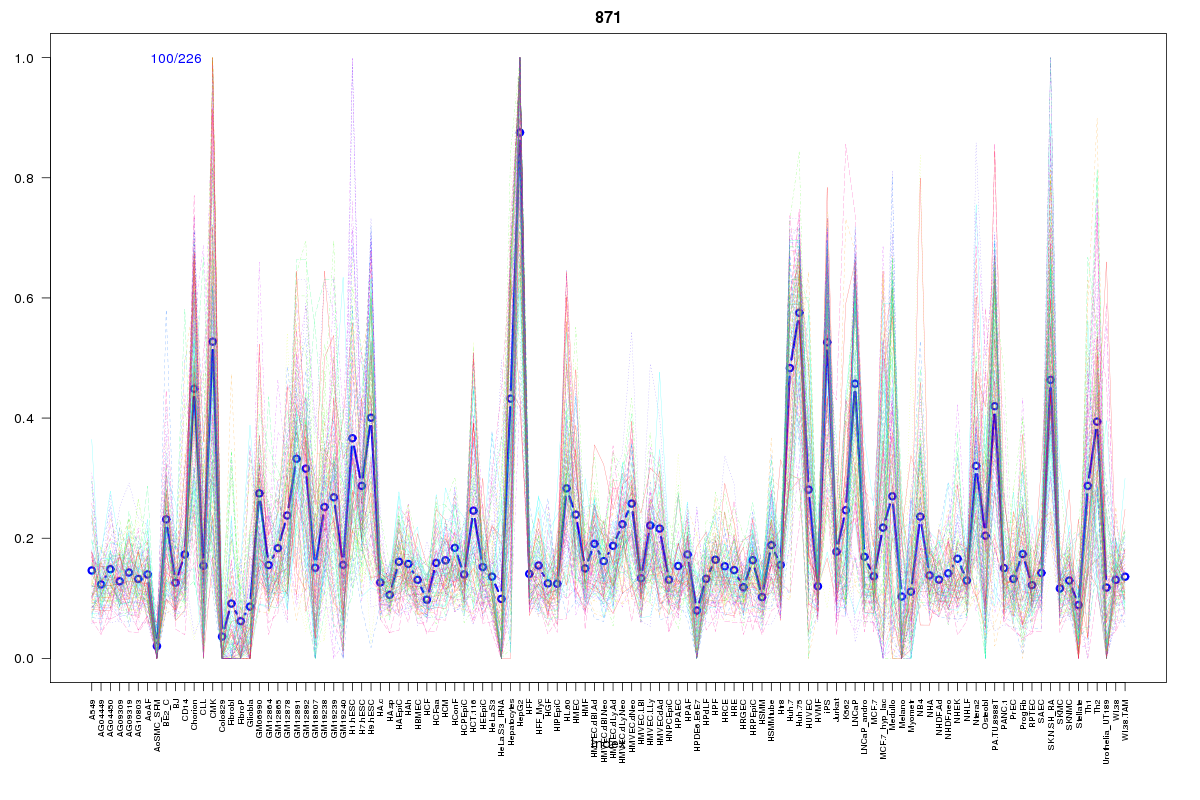 | 871 | 1 |
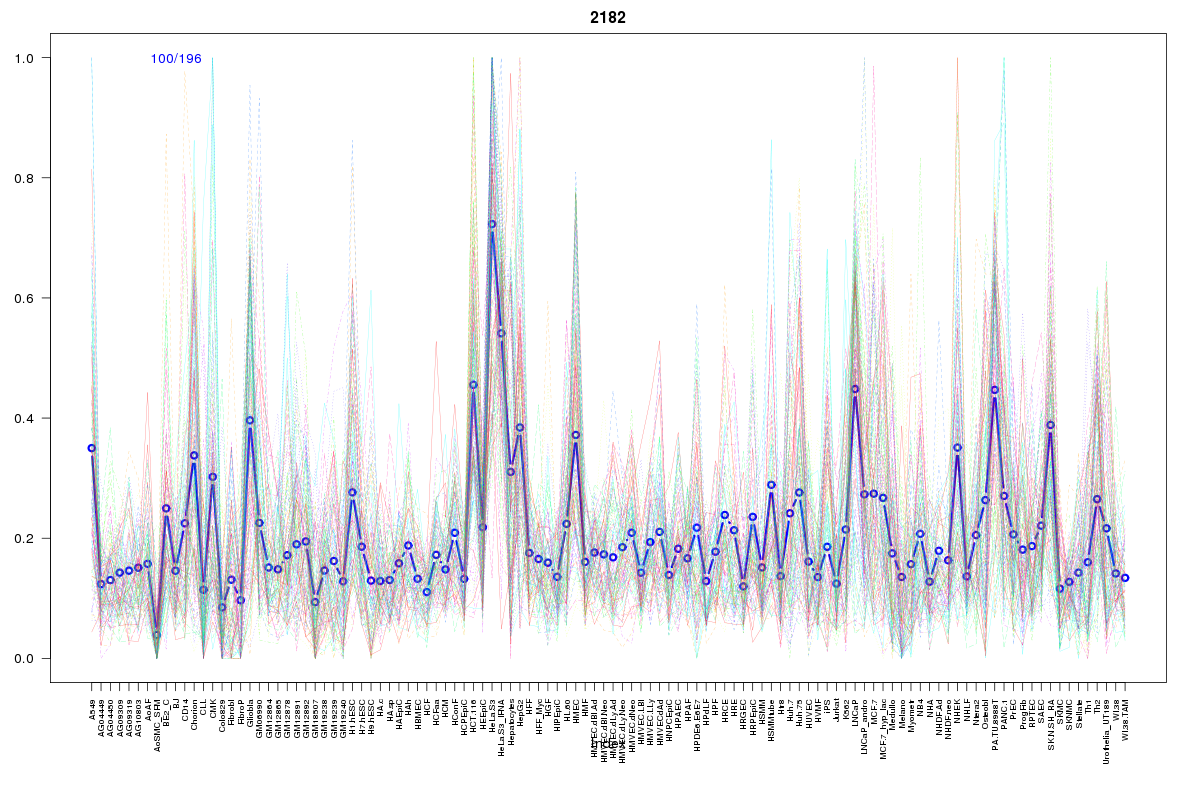 | 2182 | 1 |
Resources
BED file downloads
Connects to 25 DHS sitesTop 10 Correlated DHS Sites
p-values indiciate significant higher or lower correlation| Location | Cluster | P-value |
|---|---|---|
| chr19:2661720-2661870 | 1757 | 0 |
| chr19:2867240-2867390 | 2182 | 0 |
| chr19:2819540-2819690 | 465 | 0.005 |
| chr19:2867080-2867230 | 1415 | 0.005 |
| chr19:2866865-2867015 | 1367 | 0.005 |
| chr19:2854960-2855110 | 1355 | 0.012 |
| chr19:2743200-2743350 | 15 | 0.013 |
| chr19:2729000-2729150 | 1104 | 0.015 |
| chr19:2866085-2866235 | 615 | 0.015 |
| chr19:2721345-2721495 | 871 | 0.019 |
| chr19:2685685-2685835 | 1355 | 0.024 |
External Databases
UCSCEnsembl (ENSG00000104969)