SOM cluster: 1326
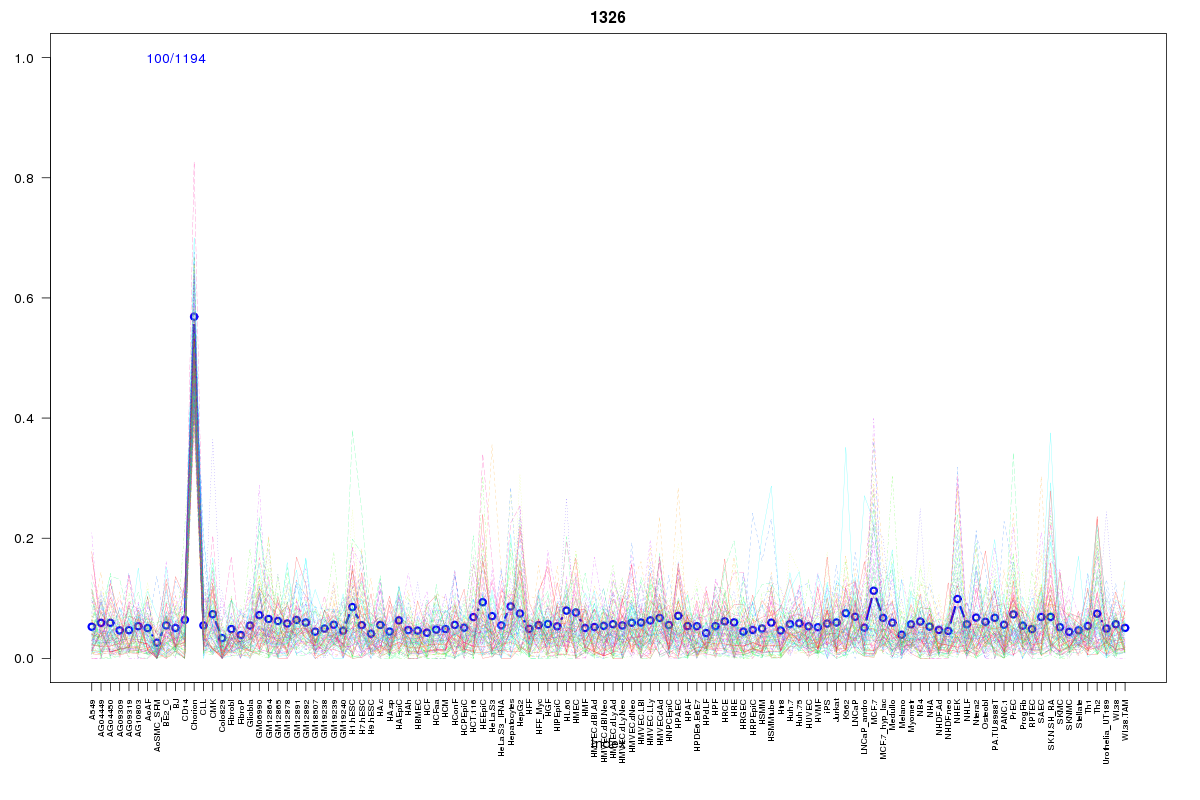
Cluster Hypersensitivity Profile

Genomic Location Trend
These plots show the distribution of the DHS sites surrounding the Transcript Start Site of the nearest gene.
Stats
Number of sites: 1194Promoter: 8%
CpG-Island: 12%
Conserved: 24%
Enriched Motifs & Matches
Match Detail: [Jaspar]
|
| ||
|---|---|---|
| Sites: 26/100 | e-val: 0.000000081 | ||
| Factor | e-val(match) | DB |
| RREB1 | 0.00060298 | JASPAR |
| SP1 | 0.002731 | JASPAR |
| TEAD1 | 0.0068561 | JASPAR |
| TFAP2A | 0.0099334 | JASPAR |
| Myb | 0.016116 | JASPAR |
|
| ||
| Sites: 25/100 | e-val: 0.42 | ||
| Factor | e-val(match) | DB |
| SP1 | 0.0000051174 | JASPAR |
| RREB1 | 0.0000093659 | JASPAR |
| Klf4 | 0.00060932 | JASPAR |
| Pax4 | 0.0041179 | JASPAR |
| PLAG1 | 0.0079885 | JASPAR |
BED file downloads
Top 10 Example Regions
| Location | Gene Link | Dist. |
|---|---|---|
| chr18: 47641680-47641830 | MYO5B | 38.69 |
| chr10: 120784440-120784590 | RP11-498J9.2 | 46.1 |
| chr1: 151153220-151153370 | SCNM1 | 48.64 |
| chr1: 152921460-152921610 | SPRR3 | 49.74 |
| chr1: 1183645-1183795 | MIR200A | 51.67 |
| chr1: 1183645-1183795 | UBE2J2 | 51.67 |
| chr19: 457645-457795 | TPGS1 | 53.97 |
| chr11: 2041665-2041815 | AC051649.6 | 54.66 |
| chr16: 3140145-3140295 | ZNF205 | 55.61 |
| chr17: 81049885-81050035 | B3GNTL1 | 55.84 |