SOM cluster: 675
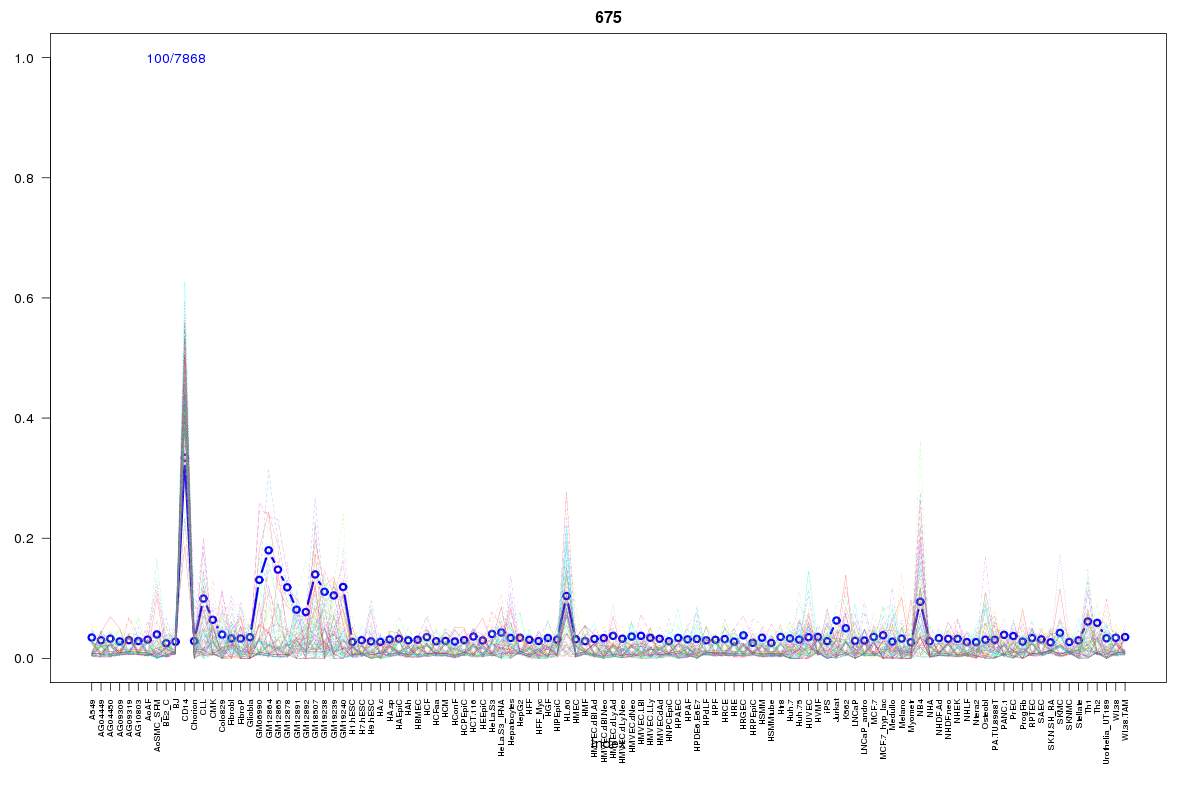
Cluster Hypersensitivity Profile

Genomic Location Trend
These plots show the distribution of the DHS sites surrounding the Transcript Start Site of the nearest gene.
Stats
Number of sites: 7868Promoter: 1%
CpG-Island: 0%
Conserved: 11%
Enriched Motifs & Matches
Match Detail: [Jaspar]
|
| ||
|---|---|---|
| Sites: 19/100 | e-val: 0.000000026 | ||
| Factor | e-val(match) | DB |
| SPIB | 0.00014838 | JASPAR |
| IRF1 | 0.001027 | JASPAR |
| MEF2A | 0.0010831 | JASPAR |
| EWSR1-FLI1 | 0.014254 | JASPAR |
| SPI1 | 0.020332 | JASPAR |
BED file downloads
Top 10 Example Regions
| Location | Gene Link | Dist. |
|---|---|---|
| chr1: 150155440-150155590 | APH1A | 18.76 |
| chr1: 192578560-192578710 | RGS1 | 25.68 |
| chr1: 168001400-168001550 | GPR161 | 26.99 |
| chr1: 150538200-150538350 | GOLPH3L | 29.64 |
| chr17: 18088420-18088570 | MIEF2 | 29.79 |
| chr12: 31986520-31986670 | RP11-428G5.5 | 35.1 |
| chr12: 31986520-31986670 | RNU6-1069P | 35.1 |
| chr19: 55119120-55119270 | LILRA2 | 35.72 |
| chr19: 55119120-55119270 | LILRB1 | 35.72 |
| chr19: 55119120-55119270 | LILRA1 | 35.72 |