Gene: TTC4
chr1: 55181494-55208330Expression Profile
(log scale)
Graphical Connections
Distribution of linked clusters:
You may find it interesting if many of the connected DHS sites belong to the same cluster.| Cluster Profile | Cluster ID | Number of DHS sites in this cluster |
|---|---|---|
 | 860 | 2 |
 | 626 | 2 |
 | 2055 | 2 |
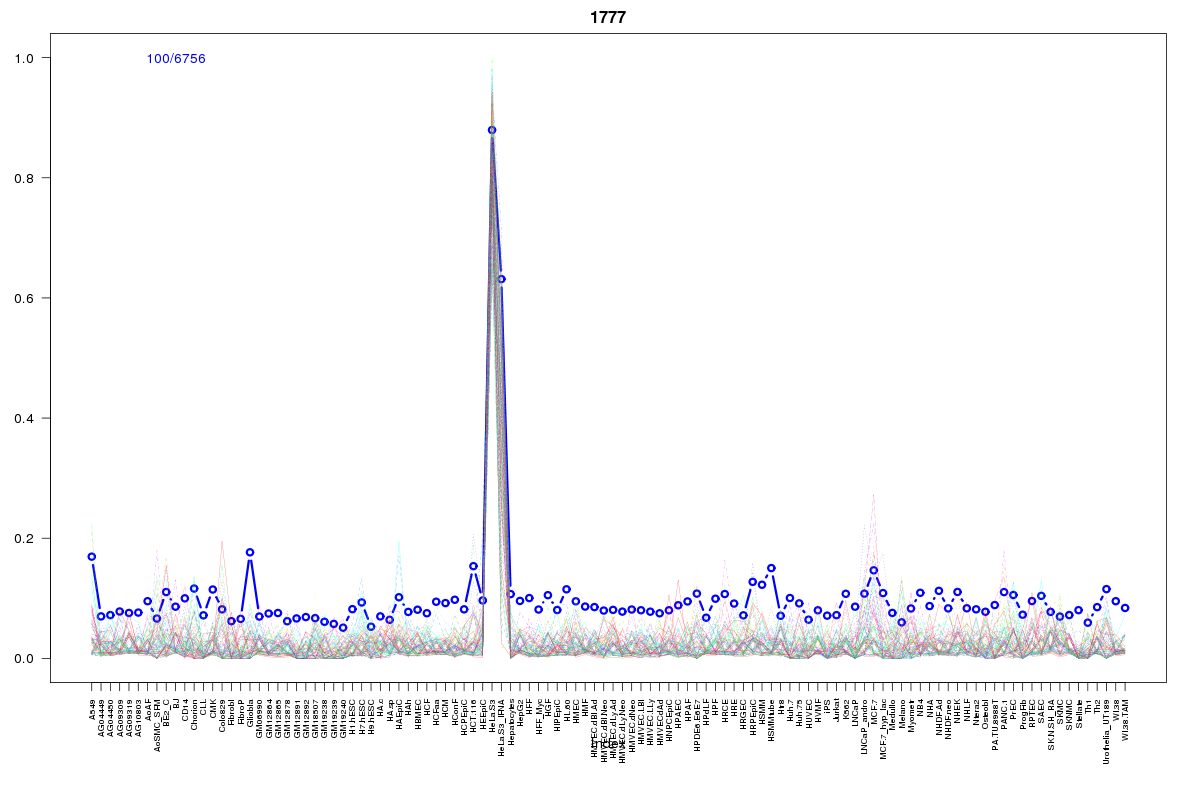 | 1777 | 1 |
 | 881 | 1 |
 | 615 | 1 |
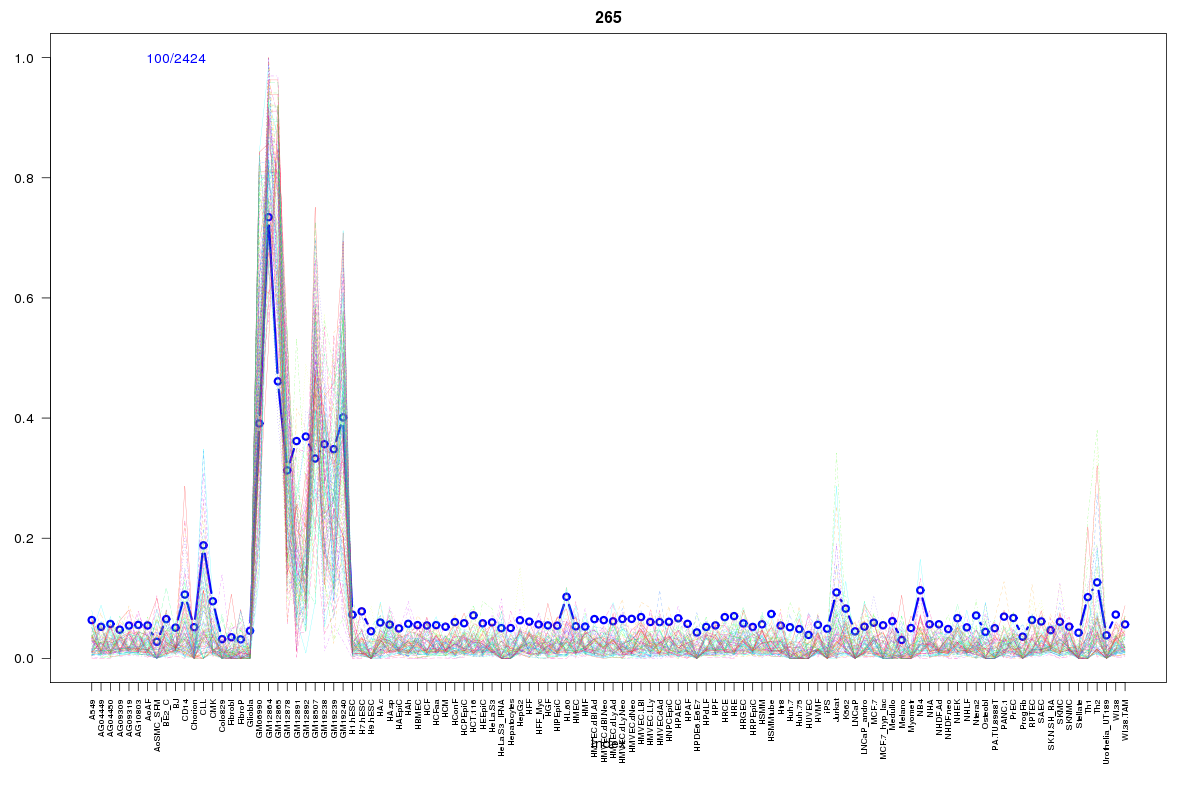 | 265 | 1 |
 | 1605 | 1 |
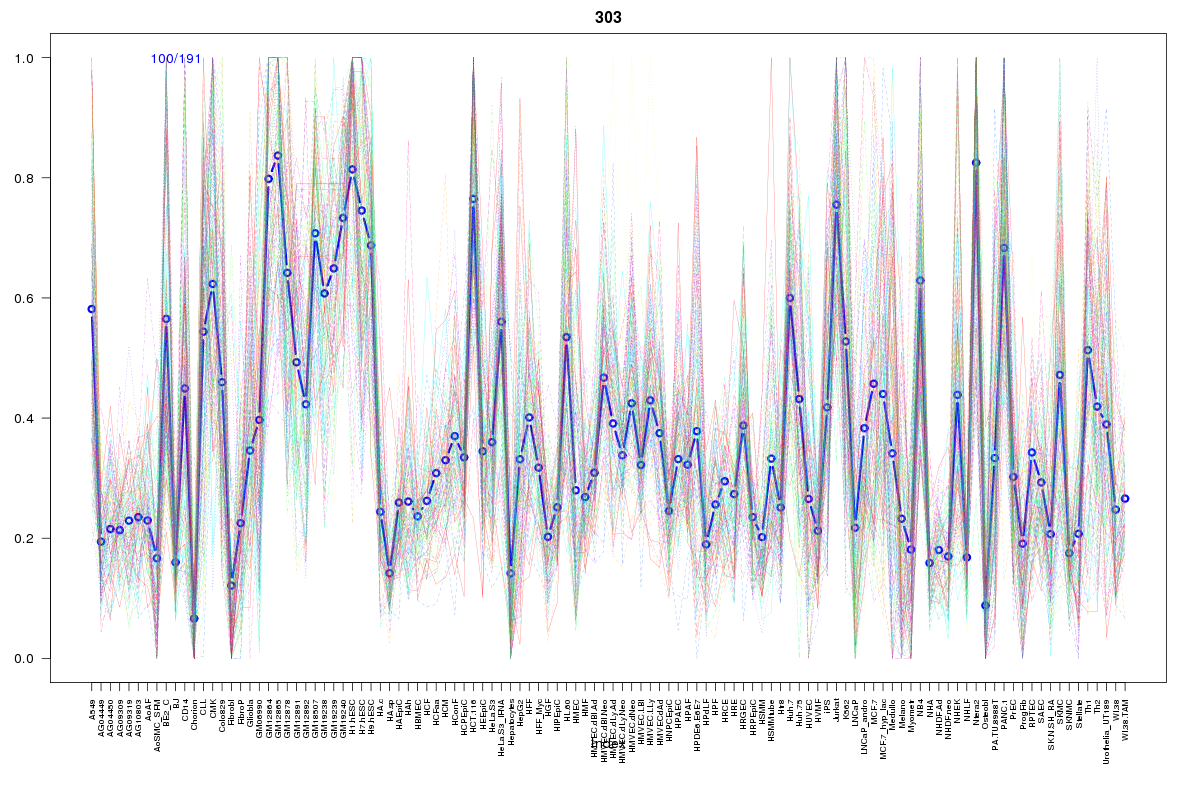 | 303 | 1 |
 | 1755 | 1 |
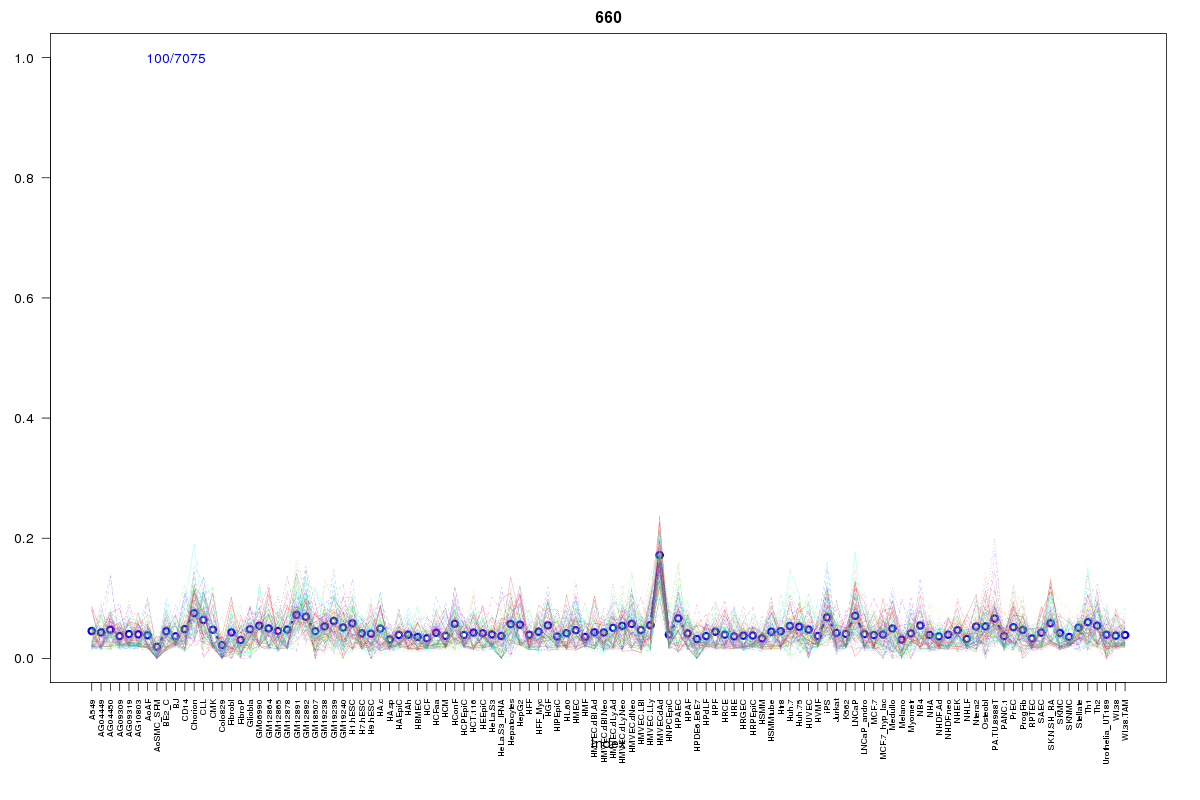 | 660 | 1 |
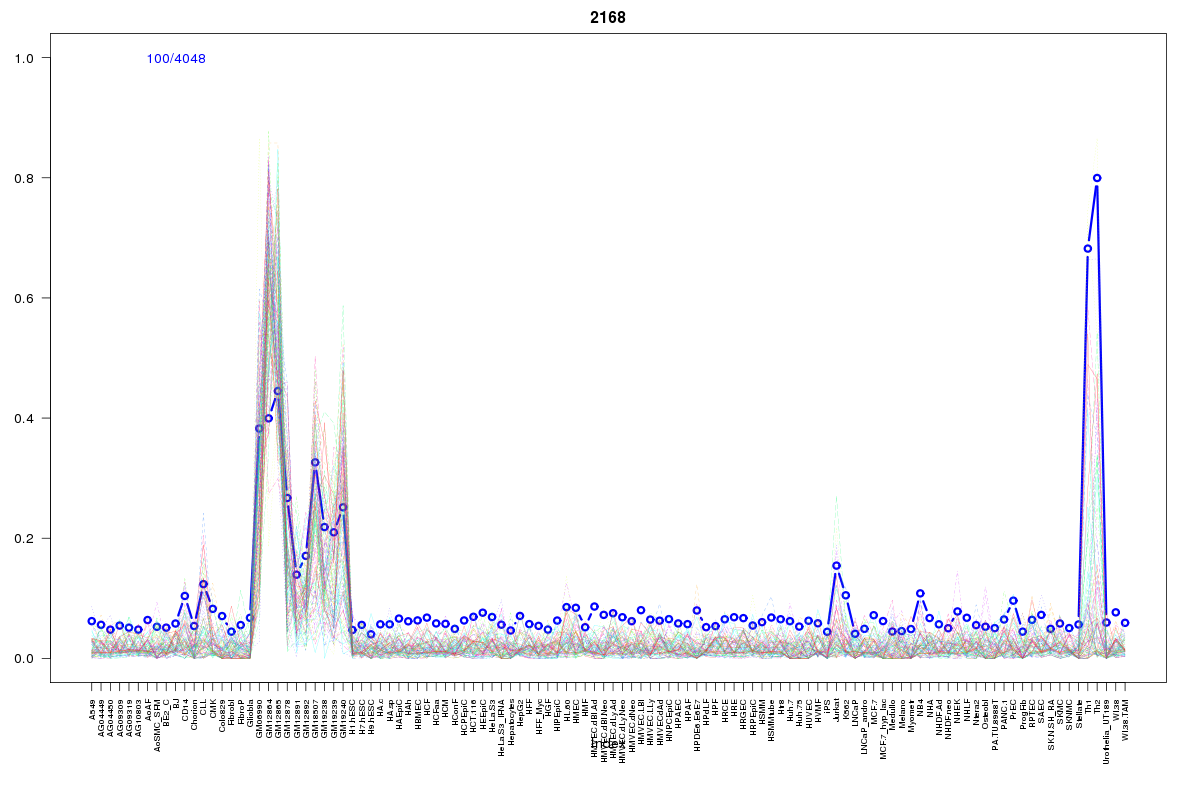 | 2168 | 1 |
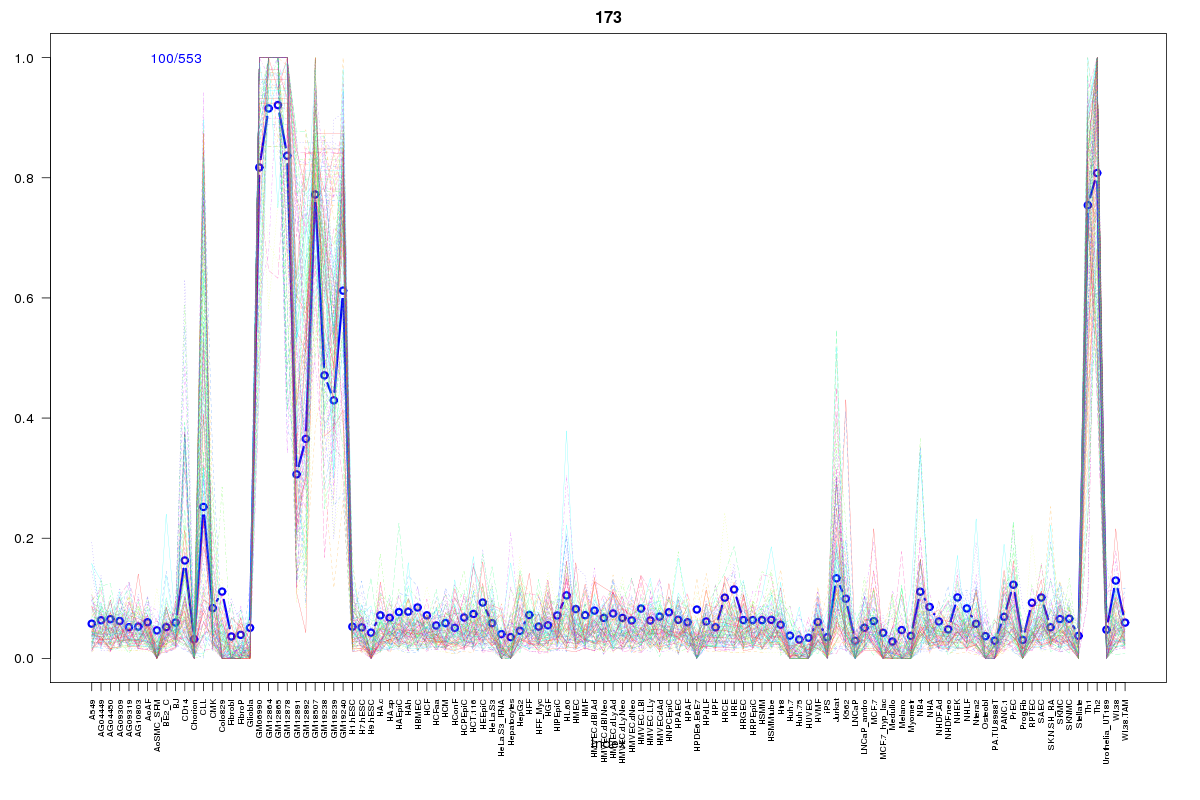 | 173 | 1 |
 | 2062 | 1 |
 | 2211 | 1 |
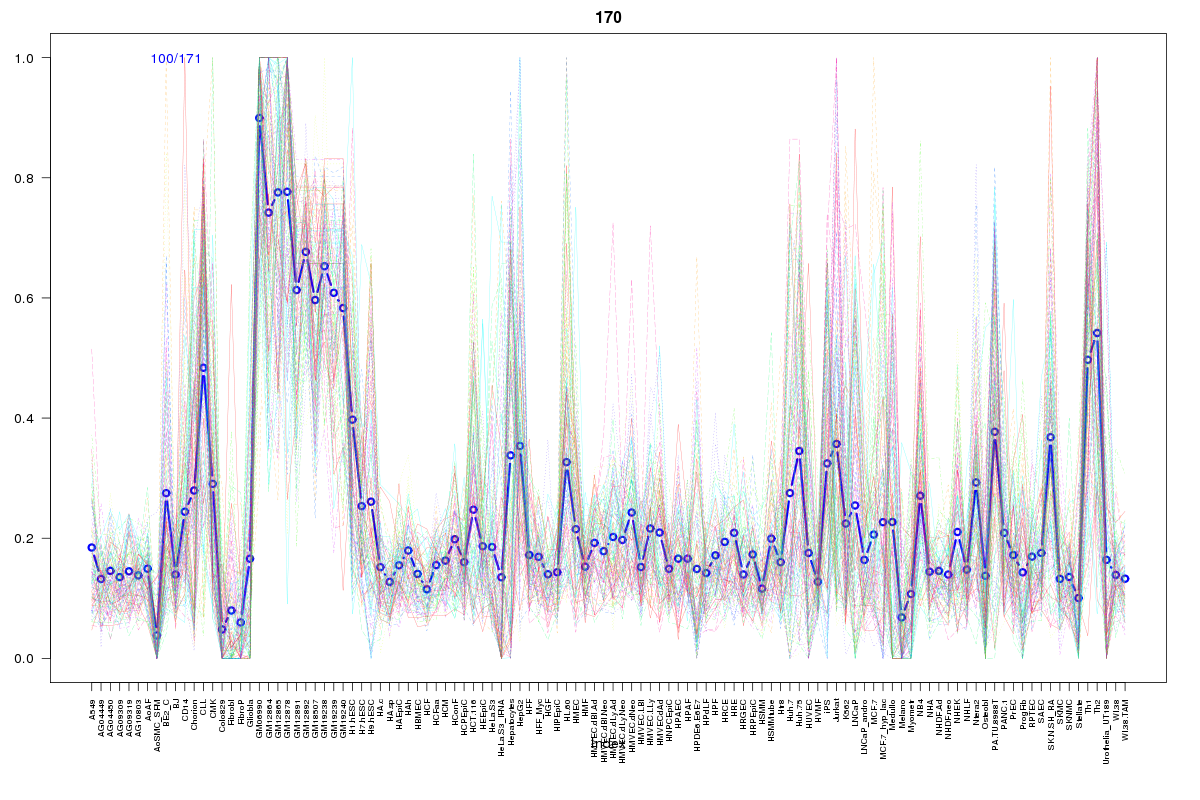 | 170 | 1 |
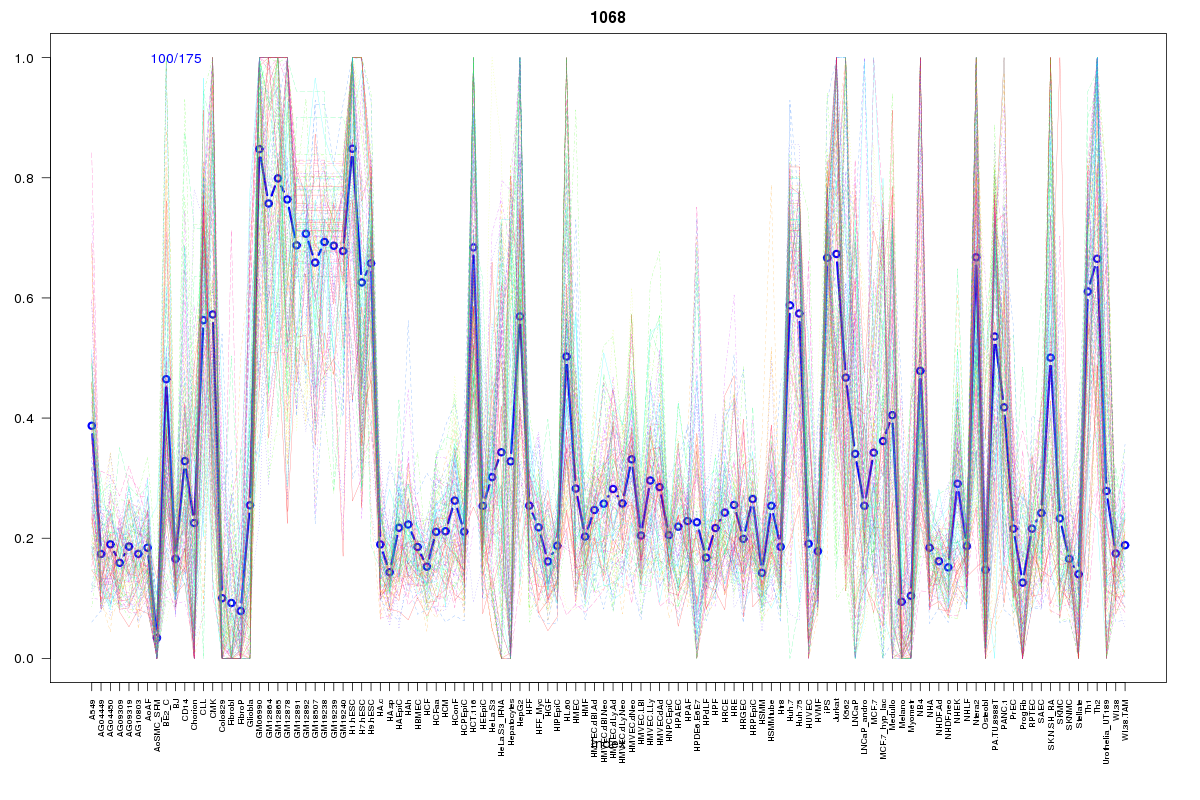 | 1068 | 1 |
Resources
BED file downloads
Connects to 20 DHS sitesTop 10 Correlated DHS Sites
p-values indiciate significant higher or lower correlation| Location | Cluster | P-value |
|---|---|---|
| chr1:55137860-55138010 | 303 | 0 |
| chr1:55264600-55264750 | 173 | 0.003 |
| chr1:55278900-55279050 | 265 | 0.004 |
| chr1:55265080-55265230 | 2062 | 0.006 |
| chr1:55264445-55264595 | 2168 | 0.006 |
| chr1:55158505-55158655 | 1755 | 0.007 |
| chr1:55136585-55136735 | 1605 | 0.012 |
| chr1:55265505-55265655 | 2211 | 0.016 |
| chr1:55087480-55087630 | 615 | 0.016 |
| chr1:55266880-55267030 | 170 | 0.018 |
| chr1:55267220-55267370 | 1068 | 0.019 |
External Databases
UCSCEnsembl (ENSG00000243725)