SOM cluster: 170
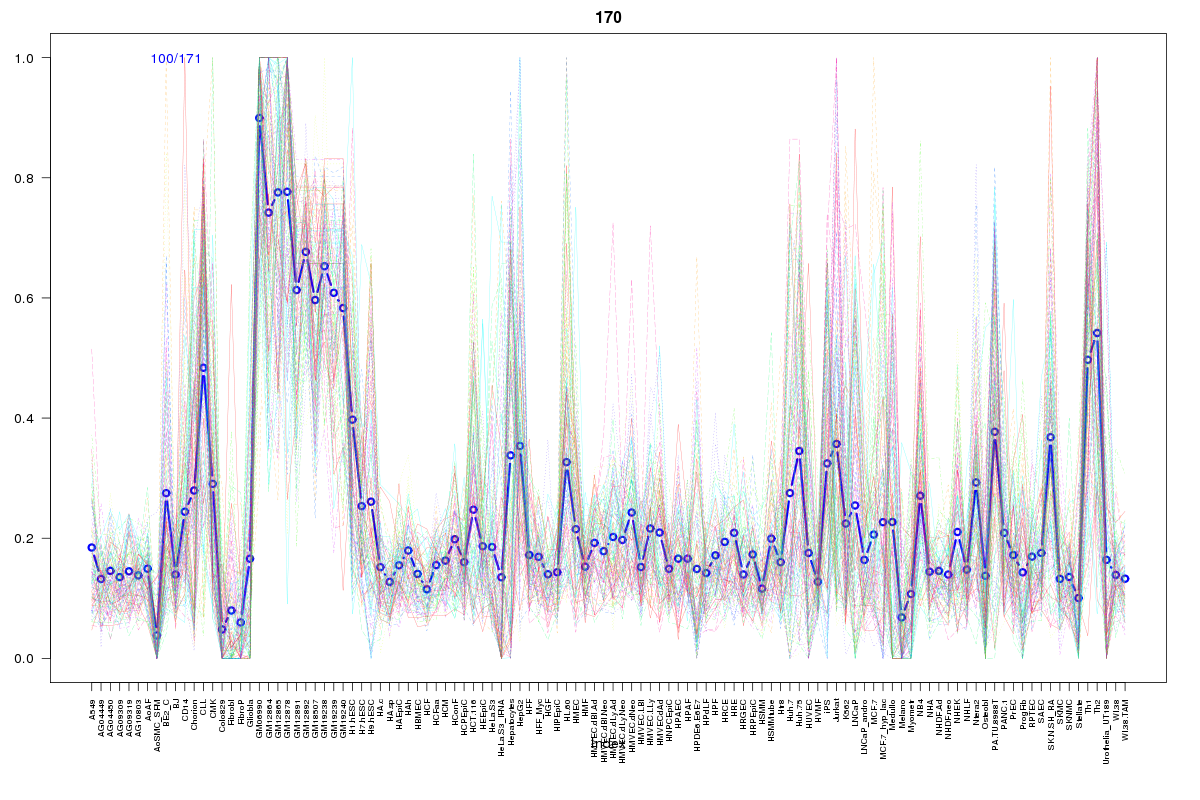
Cluster Hypersensitivity Profile

Genomic Location Trend
These plots show the distribution of the DHS sites surrounding the Transcript Start Site of the nearest gene.
Stats
Number of sites: 171Promoter: 38%
CpG-Island: 51%
Conserved: 56%
Enriched Motifs & Matches
Match Detail: [Jaspar]
|
| ||
|---|---|---|
| Sites: 89/100 | e-val: 4.5e-37 | ||
| Factor | e-val(match) | DB |
| SP1 | 0.0001407 | JASPAR |
| Klf4 | 0.0011781 | JASPAR |
| RREB1 | 0.0017879 | JASPAR |
| Egr1 | 0.005823 | JASPAR |
| Pax4 | 0.011474 | JASPAR |
|
| ||
| Sites: 39/100 | e-val: 0.000025 | ||
| Factor | e-val(match) | DB |
| SP1 | 0.00000028046 | JASPAR |
| Pax4 | 0.00025529 | JASPAR |
| PLAG1 | 0.00038192 | JASPAR |
| INSM1 | 0.0040681 | JASPAR |
| EWSR1-FLI1 | 0.004951 | JASPAR |
BED file downloads
Top 10 Example Regions
| Location | Gene Link | Dist. |
|---|---|---|
| chr10: 31609260-31609410 | ZEB1-AS1 | 42.18 |
| chr10: 31609260-31609410 | RP11-192P3.5 | 42.18 |
| chr10: 88160620-88160770 | WAPAL | 46.48 |
| chr16: 89002520-89002670 | CBFA2T3 | 48.74 |
| chr16: 89002520-89002670 | TRAPPC2L | 48.74 |
| chr9: 92112125-92112275 | SEMA4D | 54.65 |
| chr11: 119185905-119186055 | CBL | 59.93 |
| chr11: 119185905-119186055 | C1QTNF5 | 59.93 |
| chr11: 119185905-119186055 | MFRP | 59.93 |
| chr19: 12978180-12978330 | RNASEH2A | 61.58 |